Abstract
Chemical exchange–dependent saturation transfer and paramagnetic chemical exchange–dependent saturation transfer are agent-mediated contrast mechanisms that depend on saturating spins at the resonant frequency of the exchangeable protons on the agent, thereby indirectly saturating the bulk water. In general, longer saturating pulses produce stronger chemical and paramagnetic exchange–dependent saturation transfer effects, with returns diminishing for pulses longer than T1. This could make imaging slow, so one approach to chemical exchange–dependent saturation transfer imaging has been to follow a long, frequency-selective saturation period by a fast imaging method. A new approach is to insert a short frequency-selective saturation pulse before each spatially selective observation pulse in a standard, two-dimensional, gradient-echo pulse sequence. Being much less than T1 apart, the saturation pulses have a cumulative effect. Interleaved, multislice imaging is straightforward. Observation pulses directed at one slice did not produce observable, unintended chemical exchange–dependent saturation transfer effects in another slice. Pulse repetition time and signal-to noise ratio increase in the normal way as more slices are imaged simultaneously.
Keywords: CEST, PARACEST, quantitative imaging, multislice imaging, saturation transfer
Ward et al. (1) and Ward and Balaban (2) demonstrated that low-molecular-weight compounds with slowly exchanging –NH or –OH protons can alter tissue contrast via chemical exchange dependent saturation transfer (CEST) of chemically shifted, presaturated spins to bulk water. Images using CEST are typically generated by subtracting images obtained by applying a radiofrequency saturation pulse at the resonant frequency of the exchanging protons from images obtained by applying the saturation pulse at a control frequency. More recently, this CEST approach has been extended to exogenous paramagnetic lanthanide chelates with slow water exchange to produce MR contrast based on the paramagnetic CEST (PARACEST) effect (3,4). These PARACEST agents have advantages over more conventional T1-shortening agents because they are activated selectively by an excitation pulse applied at a specific frequency. Targeted CEST/PARACEST agents with different targets and different resonant frequencies for the exchanging protons may be injected together, yet imaged separately in a single examination (5). The CEST/PARACEST effect has been applied with responsive agents (6) to produce images sensitive to a variety of tissue parameters, including temperature (7), presence of enzymes (8), pH (2,9), and concentrations of glucose (10,11), lactate (12), and zinc (13). Also, since the relaxivities of these PARACEST agents are low, endogenous MR contrast is preserved until external radiofrequency saturation is applied and there is no interference with subsequent imaging with T1-shortening agents.
In practice, the external radiofrequency saturation pulse is applied for a time longer than the T1 of the bulk water protons. Woessner et al. (14) have published numerical solutions to the Bloch equations that show that both CEST and PARACEST systems approach steady state under these conditions. As was recently pointed out by Liu et al. (15) and Sun et al. (16), the most straightforward acquisition schemes for PARACEST and CEST MRI involve collecting a single line of k-space data with radiofrequency irradiation and a control. This approach can lead to long acquisition times since this process can only be repeated with repetition times longer than the T1 of the tissue. They approached shorter acquisition times for PARACEST/CEST imaging with a fast imaging method like fast spin echo following a long presaturation period. The long presaturation period may contain many short saturation pulses rather than one long one, thereby placing less stress on the radiofrequency amplifier.
In our alternate approach, short presaturation pulses are interleaved within an ordinary two-dimensional, multislice, gradient echo pulse sequence (Fig. 1), one short presaturation pulse before each excitation pulse. The shorter presaturation pulses, being spaced at much less than T1, have a cumulative effect on the magnetization. The flexibility in speed, coverage, and signal-to-noise ratio of ordinary gradient echo imaging is preserved (17). This note shows that multislice imaging with PARACEST/CEST agents is practical and that in a uniform phantom the same effect is seen in each slice.
FIG. 1.
Pulse sequence for two-dimensional, multislice, gradient-echo CEST, shown here for three slices. Saturation pulses are not spatially selective so the saturation pulse before each spatially selective observed pulse produces a CEST effect on all slices. The number of saturation pulses in each TR period is equal to the number of slices imaged. Scanning k-space from most negative to most positive, rather than working from 0 out, along with four dummy acquisitions at the start, assures reaching steady state before reaching the center of k-space.
MATERIALS AND METHODS
Images were acquired in a circularly polarized, transmit-receive, birdcage coil 18 cm long, with 10-cm diameter in a 1.5-T Signa scanner (GE Healthcare, Waukesha, WI).
Phantom data in Table 1 and Figs. 2 and 3 came from 70mm-long Eppendorf centrifuge tubes, tapered over about a third of their length. One contained only water, one 20-mM, and one 60-mM (18). This agent has a chemical shift of 52 parts per million, or 3320 Hz at 1.5 T.
Table 1.
CEST Effect at Different TR, Observation Pulse Flip, and Agent Concentration
| Observation pulse flip degrees |
Conc mM | CEST contrast/noise | CEST percentage | ||||||
|---|---|---|---|---|---|---|---|---|---|
| 90 | 20 | 2.8 | 6.6 | 14.0 | 25.3 | 15 | 18 | 21 | 24 |
| 60 | 20 | 4.1 | 9.9 | 19.6 | 34.0 | 17 | 21 | 26 | 31 |
| 45 | 20 | 5.2 | 12.1 | 22.2 | 33.8 | 19 | 24 | 30 | 34 |
| 30 | 20 | 6.7 | 14.5 | 23.5 | 30.0 | 23 | 29 | 36 | 39 |
| 15 | 20 | 9.3 | 14.4 | 16.8 | 18.9 | 32 | 39 | 40 | 43 |
| 10 | 20 | 8.7 | 11.3 | 12.1 | 12.9 | 37 | 41 | 42 | 43 |
| 90 | 60 | 4.9 | 11.8 | 25.2 | 45.2 | 28 | 33 | 41 | 49 |
| 60 | 60 | 6.8 | 16.6 | 31.2 | 51.6 | 32 | 41 | 49 | 56 |
| 45 | 60 | 8.6 | 19.9 | 32.7 | 44.9 | 37 | 46 | 54 | 59 |
| 30 | 60 | 11.1 | 21.3 | 29.4 | 35.5 | 44 | 54 | 58 | 62 |
| 15 | 60 | 12.8 | 16.8 | 18.8 | 20.6 | 55 | 61 | 63 | 65 |
| 10 | 60 | 10.4 | 12.1 | 13.1 | 13.1 | 59 | 62 | 64 | 64 |
| Slices | 1 | 3 | 7 | 13 | 1 | 3 | 7 | 13 | |
| TR ms | 100 | 300 | 700 | 1300 | 100 | 300 | 700 | 1300 | |
FIG. 2.
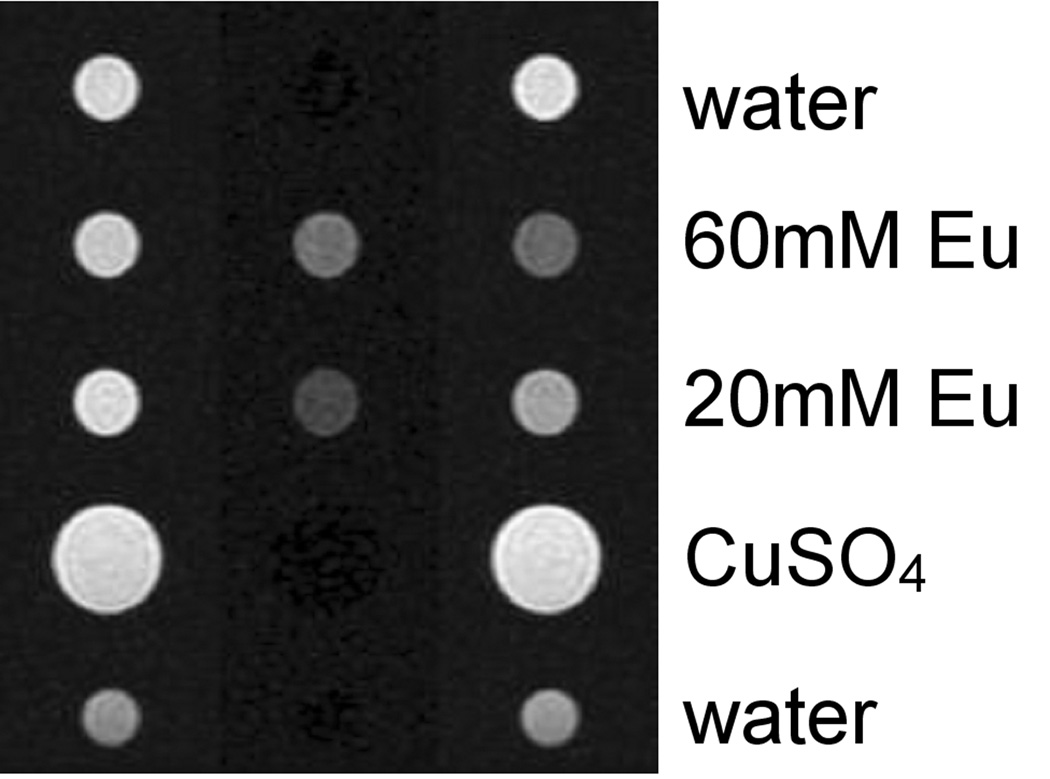
Images of several samples with and without EuDOTA-from observation pulses. (gly)4. Right column irradiated at agent resonance frequency, which is 3.3 kHz greater than water. Left column is the control experiment irradiated 3.3 kHz below water resonance. The center column is the difference between images, which shows only samples containing Eu (III)–1,4,7,10-tetrazacyclododecane–1,4,7,10-tetrakis (acetamidoacetic acid).
FIG. 3.
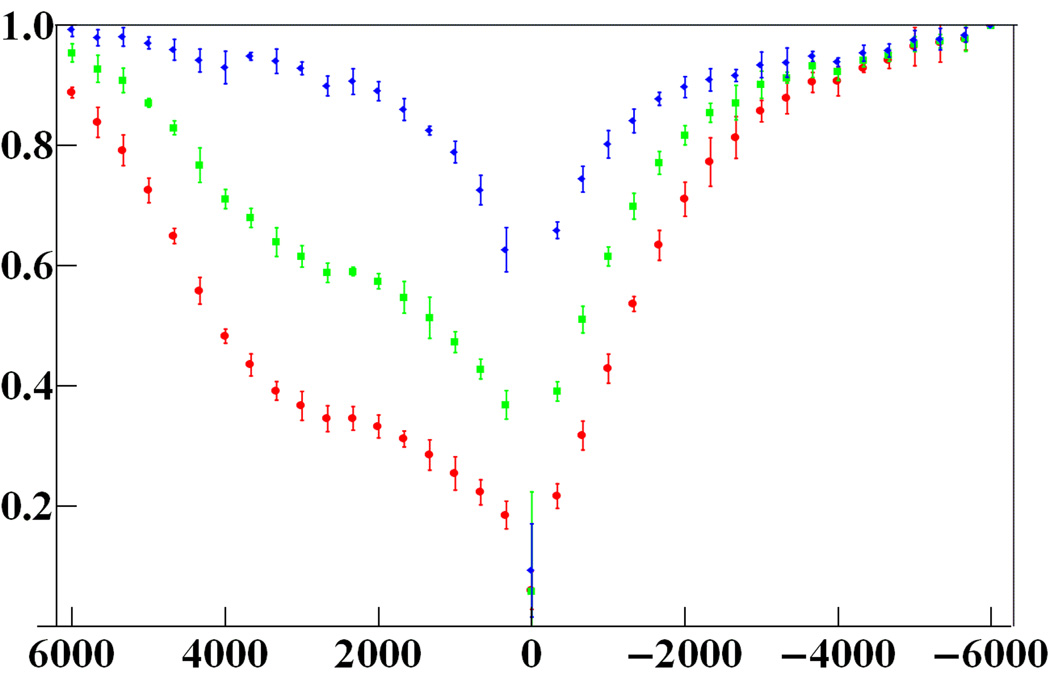
CEST-spectra. Y-axis: observed signal divided by signal with saturation pulse 6 kHz below water resonance. X-axis: saturation pulse frequency relative to water (Hz). Top to bottom: water with 0, 20, 60 mM Eu (III)−1,4,7,10-tetrazacyclododecone−1,4,7,10-tetrakis (acetamidoacetic acid). Plotting symbols are the mean signal from the five slices imaged at once. Error bars extend ±4 standard deviations from the means.
Slices were 5mm thick, separated by 5mm gaps. The field of view was 12 cm, echo time 5 ms. Pulse repetition time (TR) was 100 ms per slice, number of excitations was 2, and excitation flip 30°. With a 128 by 64 matrix, this required 12.8 sec scan time per image. The CEST saturation pulses were a Fermi function, with a maximum intensity of 1600 Hz. The expression below, with t in ms, describes half our 50-ms, symmetric Fermi pulse. The Fourier transform of this pulse has a full width at half maximum of 32 Hz, much less than the water-agent chemical shift difference.
RESULTS
A five-slice CEST experiment provided the data for Figs. 2 and 3. Figure 2 shows CEST images of the middle slice. Figure 3 shows the equivalence of CEST spectra across the five slices.
Table 1 shows the CEST effect for two agent concentrations, several numbers of slices (and therefore repeat times), and several observation pulse flip angles. The CEST effect is expressed in two independent ways, as a contrast-to-noise ratio and as the fraction of the signal destroyed by CEST. Specifically,
where Sr is the signal in an image made with saturation pulses resonant with the CEST agent. Sc is the signal with saturation pulses at a control frequency symmetrically on the other side of the water resonance. Noise, N, was assessed as mean magnitude in an empty part of the image. Noise did not vary with agent concentration, observation pulse flip, or the number of slices and TR. Increasing TR, as happens when the number of slices increases, increases the CEST effect by both criteria.
DISCUSSION
Sun et al. (16) and Liu et al. (15) have demonstrated that a long saturation pulse can be broken into shorter pulses, reducing the CEST effect somewhat, depending on the saturation pulse duty cycle. Here we have used the time this provides between saturation pulses to observe the signal. Imaging one slice with TR twice the saturation pulse duration gives a 50% duty cycle.
The attractions of this method depend on the coverage required. To image a single slice, the early acronym FLASH (19) for Fast Low Angle SHot is appropriate. Interleaving more slices while continuing to follow the pulse sequence diagram of Fig. 1 and keeping the saturation pulse duration constant increases TR. Spins in a given slice have longer to relax before the next observation pulse at their resonant frequency occurs. Hence, sensitivity increases with the number of slices imaged. Table 1 shows this for two concentrations at a variety of observation pulse flips.
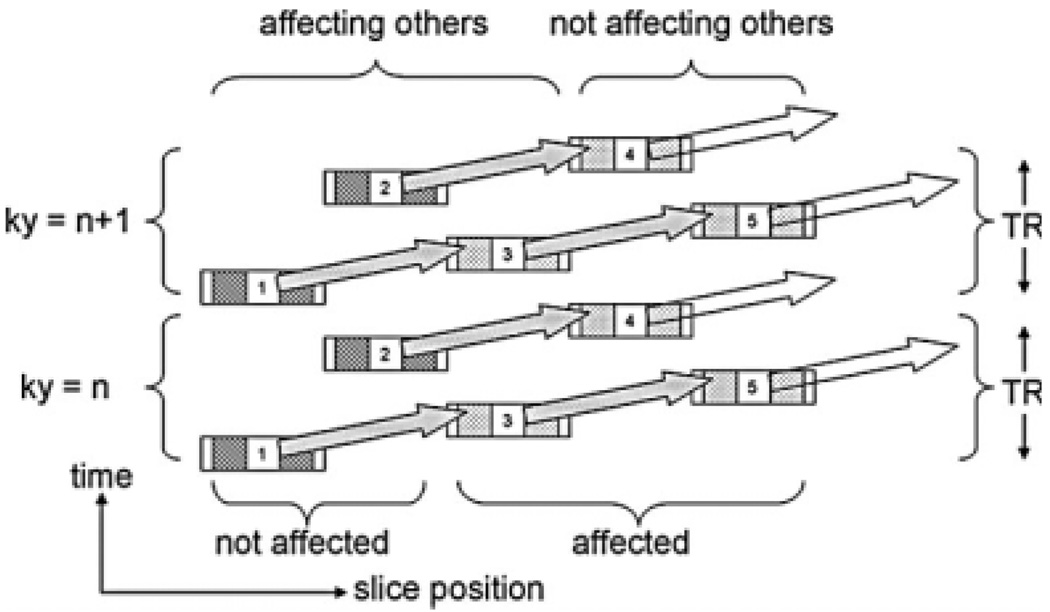
Sensitivity increases with the number of slices imaged because of the increased relaxation time between excitations of a given slice. However, during that extra time, an observed pulse directed at water in one slice may excite the CEST agent in another slice. This happens to certain slices but not to others, potentially making slices inequivalent. Figure 4 illustrates how this effect could arise. A similar mechanism produces unintended magnetization transfer contrast in multislice imaging (20,21). With magnetization transfer contrast, however, every slice affects the contrast in every other slice, not just a specific slice. However, the results presented in Fig. 3 appear free of this inequality, as hoped, presumably because the saturation pulses are longer than observation pulses. Thus, CEST effects in different slices can be compared to one another conveniently and quantitatively.
FIG. 4.
Imaging five slices with an agent chemical shift that is about twice the frequency difference between adjacent slices. Slices 1, 2, and 3 may produce a CEST effect on slices 3, 4, and 5. Slices 3, 4, and 5, but not slices 1 and 2, receive incidental CEST from observation pulses.
In summary, we concur with others that splitting long saturation pulses into a multitude of shorter ones is advantageous. We obtain the expected increase in signal-to-noise ratio when we interleave more slices in a scan. We did not see spurious CEST effects in some slices due to observation pulses directed at other slices.
Acknowledgments
Grant sponsor: National Institutes of Health; Grant numbers: EB-04582, CA-115531.
REFERENCES
- 1.Ward KM, Aletras AH, Balaban RS. A new class of contrast agents for MRI based on proton chemical exchange dependent saturation transfer (CEST) J Magn Reson. 2000;143:79–87. doi: 10.1006/jmre.1999.1956. [DOI] [PubMed] [Google Scholar]
- 2.Ward KM, Balaban RS. Determination of pH using water protons and chemical exchange dependent saturation transfer (CEST) Magn Reson Med. 2000;44:799–802. doi: 10.1002/1522-2594(200011)44:5<799::aid-mrm18>3.0.co;2-s. [DOI] [PubMed] [Google Scholar]
- 3.Zhang S, Merritt M, Woessner DE, Lenkinski RE, Sherry AD. PARACEST agents: modulating MRI contrast via water proton exchange. Acc Chem Res. 2003;36:783–790. doi: 10.1021/ar020228m. [DOI] [PubMed] [Google Scholar]
- 4.Zhang S, Winter P, Wu K, Sherry AD. A novel europium(III)-based MRI contrast agent. J Am Chem Soc. 2001;123:1517–1518. doi: 10.1021/ja005820q. [DOI] [PubMed] [Google Scholar]
- 5.Terreno E, Castelli DD, Milone L, Rollet S, Stancanello J, Violante E, Aime S. First ex-vivo MRI co-localization of two LIPOCEST agents. Contrast Media Mol Imaging. 2008;3:38–43. doi: 10.1002/cmmi.225. [DOI] [PubMed] [Google Scholar]
- 6.Yoo B, Pagel MD. An overview of responsive MRI contrast agents for molecular imaging. Front Biosci. 2008;13:1733–1752. doi: 10.2741/2796. [DOI] [PubMed] [Google Scholar]
- 7.Zhang S, Malloy CR, Sherry AD. MRI thermometry based on PARACEST agents. J Am Chem Soc. 2005;127:17572–17573. doi: 10.1021/ja053799t. [DOI] [PMC free article] [PubMed] [Google Scholar]
- 8.Yoo B, Raam MS, Rosenblum RM, Pagel MD. Enzyme-responsive PARACEST MRI contrast agents: a new biomedical imaging approach for studies of the proteasome. Contrast Media Mol Imaging. 2007;2:189–198. doi: 10.1002/cmmi.145. [DOI] [PubMed] [Google Scholar]
- 9.Gillies RJ, Raghunand N, Garcia-Martin ML, Gatenby RA. pH imaging. A review of pH measurement methods and applications in cancers. IEEE Eng Med Biol Mag. 2004;23:57–64. doi: 10.1109/memb.2004.1360409. [DOI] [PubMed] [Google Scholar]
- 10.Ren J, Trokowski R, Zhang S, Malloy CR, Sherry AD. Imaging the tissue distribution of glucose in livers using a PARACEST sensor. Magn Reson Med. 2008;60:1047–1055. doi: 10.1002/mrm.21722. [DOI] [PMC free article] [PubMed] [Google Scholar]
- 11.Zhang S, Trokowski R, Sherry AD. A paramagnetic CEST agent for imaging glucose by MRI. J Am Chem Soc. 2003;125:15288–15289. doi: 10.1021/ja038345f. [DOI] [PubMed] [Google Scholar]
- 12.Aime S, Delli Castelli D, Fedeli F, Terreno E. A paramagnetic MRI-CEST agent responsive to lactate concentration. J Am Chem Soc. 2002;124:9364–9365. doi: 10.1021/ja0264044. [DOI] [PubMed] [Google Scholar]
- 13.Trokowski R, Ren J, Kalman FK, Sherry AD. Selective sensing of zinc ions with a PARACEST contrast agent. Angew Chem Int Ed Engl. 2005;44:6920–6923. doi: 10.1002/anie.200502173. [DOI] [PubMed] [Google Scholar]
- 14.Woessner DE, Zhang S, Merritt ME, Sherry AD. Numerical solution of the Bloch equations provides insights into the optimum design of PARACEST agents for MRI. Magn Reson Med. 2005;53:790–799. doi: 10.1002/mrm.20408. [DOI] [PubMed] [Google Scholar]
- 15.Liu G, Ali MM, Yoo B, Griswold MA, Tkach JA, Pagel MD. PARACEST MRI with improved temporal resolution. Magn Reson Med. 2009;61:399–408. doi: 10.1002/mrm.21863. [DOI] [PMC free article] [PubMed] [Google Scholar]
- 16.Sun PZ, Murata Y, Lu J, Wang X, Lo EH, Sorensen AG. Relaxation-compensated fast multislice amide proton transfer (APT) imaging of acute ischemic stroke. Magn Reson Med. 2008;59:1175–1182. doi: 10.1002/mrm.21591. [DOI] [PubMed] [Google Scholar]
- 17.Harisinghani MG, Dixon WT, Saksena MA, Brachtel E, Blezek DJ, Dhawale PJ, Torabi M, Hahn PF. MR lymphangiography: imaging strategies to optimize the imaging of lymph nodes with ferumoxtran-10. Radiographics. 2004;24:867–878. doi: 10.1148/rg.243035190. [DOI] [PubMed] [Google Scholar]
- 18.Zhang S, Wu K, Biewer MC, Sherry AD. 1H and 17O NMR detection of a lanthanide-bound water molecule at ambient temperatures in pure water as solvent. Inorg Chem. 2001;40:4284–4290. doi: 10.1021/ic0003877. [DOI] [PubMed] [Google Scholar]
- 19.Frahm J, Haase A, Matthaei D. Rapid NMR imaging of dynamic processes using the FLASH technique. Magn Reson Med. 1986;3:321–327. doi: 10.1002/mrm.1910030217. [DOI] [PubMed] [Google Scholar]
- 20.Dixon WT, Engels H, Castillo M, Sardashti M. Incidental magnetization transfer contrast in standard multislice imaging. Magn Reson Imaging. 1990;8:417–422. doi: 10.1016/0730-725x(90)90050-c. [DOI] [PubMed] [Google Scholar]
- 21.Melki PS, Mulkern RV. Magnetization transfer effects in multislice RARE sequences. Magn Reson Med. 1992;24:189–195. doi: 10.1002/mrm.1910240122. [DOI] [PubMed] [Google Scholar]


