

Abstract
Quantitative cortical micro-architectural endpoints are important for understanding structure-function relations in the context of fracture risk and therapeutic efficacy. This technique study details new image-processing methods to automatically segment and directly quantify cortical density, geometry, and micro-architecture from HR-pQCT images of the distal radius and tibia.
An automated segmentation technique was developed to identify the periosteal and endosteal margins of the distal radius and tibia, and detect intra-cortical pore space morphologically consistent with Haversian canals. The reproducibility of direct quantitative cortical bone indices based on this method was assessed in a pooled dataset of 56 subjects with two repeat acquisitions for each site. The in vivo precision error was characterized using root mean square coefficient of variation (RMSCV%) from which, the least significant change (LSC) was calculated. Bland-Altman plots were used to characterize bias in the precision estimates.
The reproducibility of cortical density and cross-sectional area measures was high (RMSCV <1% and <1.5%, respectively) with good agreement between young and elder medians. The LSC for cortical porosity (Ct.Po) was somewhat smaller in the radius (0.58%) compared with the distal tibia (0.84%) and significantly different between young and elder medians in the distal tibia (LSC: 0.75% vs. 0.92%; p<0.001). The LSC for pore diameter and distribution (Po.Dm and Po.Dm.SD) ranged between 15 and 23μm. Bland-Altman analysis revealed moderate bias for integral measures of area and volume, but not density nor microarchitecture.
This study indicates HR-pQCT measures of cortical bone density and architecture can be measured in vivo with high reproducibility and limited bias across a biologically relevant range of values. The results of this study provide informative data for the design of future clinical studies of bone quality.
Keywords: HR-pQCT, cortical bone, porosity, segmentation, osteoporosis, micro-computed tomography, microct, reproducibility
Introduction
High-resolution peripheral quantitative computed tomography (HR-pQCT) is a promising non-invasive method for in vivo 3D characterization of human bone [1, 2]. With an isotropic nominal resolution of 82 μm, this technology permits quantification of the geometric, microarchitectural, densitometric, and mechanical properties of human cortical and trabecular bone in the appendicular skeleton (distal radius and distal tibia) [3–6]. Whereas clinical HR-pQCT studies have primarily focused on trabecular micro-architecture [7–9], the significance of cortical bone at these sites has recently received increased attention [10–13]. In fact, cortical bone bears the bulk of axial loads in the distal radius and tibia [14], and the distribution of load has been found to be an important factor in the prediction of bone strength and fracture [15, 16]. Both gross geometric and micro-architectural properties of cortical bone are known to contribute to bone strength [17]. These properties are modified through distinct physiologic processes (endosteal/periosteal remodeling vs. osteonal remodeling) and, therefore, represent unique targets for pharmacologic intervention. Recently evidence of significant macroscopic intra-cortical porosity in early post-menopausal osteopenic women has been reported [8]. In addition, two recent studies have found that cortical bone micro-architecture in the distal radius and tibia change dramatically with aging and, in particular, with the onset of menopause [10, 11].
The standard HR-pQCT analysis routines provided by the manufacturer measure gross geometric and densitometric properties of cortical bone based on a simple segmentation process [1]. This procedure uses a constrained Gaussian smoothing operator to blur out thin trabeculae, followed by the application of a fixed-attenuation threshold to identify thick cortical structures, and subsequent slice-wise removal of non-connected residual trabecular islands. The resulting binary image is used to calculate cortical cross sectional area (Ct.Ar) and volumetric bone mineral density (Ct.BMD). An annular model estimate of cortical thickness (Ct.Th) is calculated as the ratio of Ct.Ar to periosteal perimeter. This approach has several limitations. Most notably, it performs poorly for subjects with moderately thin or porous cortices [8, 18]. There is significant biological variability in cortical thickness – with osteopenic and osteoporotic individuals often exhibiting regional cortical widths approaching trabecular dimensions. Furthermore, this method may bias longitudinal changes when matrix density is altered (e.g. via pharmacologic intervention) [19]. Finally, the coarse segmentation precludes quantification of cortical micro-architecture, including intra-cortical porosity.
Recently, Buie et al. proposed a more sophisticated method to automatically segment the cortical compartment [18]. This approach was subsequently refined and extended to quantify cortical porosity in two different cross-sectional studies [10, 11]. However, to date, the extended cortical bone micro-architecture measures based on these developments have not been clearly defined. Furthermore, whereas the accuracy has been characterized in an ex vivo cadaver study [11], the reproducibility has not yet been determined. In this technique study, a detailed presentation of the image processing algorithms applied to automatically segment the cortical compartment and intra-cortical pore volume is provided. In addition, quantitative measures of cortical thickness, geometry, density, and porosity are developed. In a patient study, statistical measures of the reproducibility and least significant change (LSC) for these indices were determined by repeat acquisitions in both young healthy volunteers of both sexes, and an elder, pre-dominantly post-menopausal cohort.
Materials and Methods
Segmentation Algorithm
The software for the extended cortical bone measures described below was collaboratively developed and implemented within the scanner manufacturer’s Image Processing Language (IPL v5.08b, Scanco Medical AG) and incorporated via extension into the manufacturer’s visualization and analysis software (μCT Evaluation v6.0, Scanco Medical AG, Brüttisellen, Switzerland). The automated image processing chain is comprised of three primary stages, and described in detail here so it could be implemented within other platforms. In the first stage, the cortical bone compartment is segmented by an auto-contouring process, which generates a periosteal contour that delineates mineralized bone and extra-osseal soft tissue, and an endosteal contour that delineates the endocortical boundary from the cancellous compartment. In the second stage, resolved Haversian canals within the cortical compartment are identified and distinguished from artefactual void on the endosteal and periosteal surface (i.e., due to surface roughness) as well as trans-cortical foramen or erosions. In the final stage, the segmented cortical bone and porosity images are combined to generate a refined cortical compartment region. Each stage is described in detail in the following sections, and graphically in Figures 1–3.
Figure 1.

Diagram of the image processing algorithm for the cortical compartment segmentation. In the first step, the periosteal surface identified (1A). Next the endosteal boundary is detected which defines the trabecular compartment (2B). In the final step the periosteal and endosteal regions are digitally subtracted to define the apparent cortical compartment (3C), which is used to mask the bone structure to yield the mineralized cortical bone segmentation (3D).
Figure 3.

Diagram of the image processing procedure to refine the cortical region of interest using the combination of the results from the first two stages. The result of this stage (I) is used to calculate Ct.Th and Ct.Po using direct measurement techniques.
Cortical compartment segmentation (Figure 1)
Extraction of the fully mineralized bone structure from the grayscale image data uses the same approach as the standard trabecular structure analysis: a Laplace-Hamming filter, which effectively smoothes the image and enhances edges, is applied to the original grayscale data and a fixed global threshold (40% of the maximum possible grayscale value) is applied to discretize the bone and background phases [20]. To identify the periosteal surface, 3D morphological dilation (15 voxels, equivalent to 2.46 mm) is performed on the binary image to close all cortical perforations. Residual void in the marrow space is then removed using a slicewise, 2D connectivity criterion to select the single largest mutually connected object (i.e. the background). In the final step, morphological erosion (15 voxels) is performed to return the boundary to the periosteal surface. The endosteal margin is identified by first inverting the original binary bone structure image. The inverse structure image is then masked with the periosteal volume of interest (VOI) to leave only the marrow voxels. A 2D connectivity criterion to select the single largest mutually connected object is again used to identify the background, thereby partially removing internal trabeculae. Thin, disconnected elements are removed by calculating a 3D thickness map of the medullary marrow space and applying a minimal thickness threshold (2 voxels). This step is done to prevent small cortical pores from being included in the following dilation step, where they would otherwise be identified as part of the marrow space. Next, 3D morphological dilation (15 voxels) is performed to close the endosteal perimeter and a 2D slicewise connectivity criterion is applied to remove any remaining trabecular voids. Morphological erosion (15 voxels) is then used to return the boundary to the endosteal surface. Finally, the binary difference between the volume circumscribed by the periosteal and endosteal contours is computed to yield the cortical compartment VOI.
Cortical porosity segmentation (Figure 2)
Figure 2.

Diagram of the image processing algorithm for the intra-cortical porosity segmentation. Pores are first extracted using a 2D connectivity filter to find pores that are fully surrounded by bone (1E). A second pore estimate (2F) is obtained by region growing the initial porosity along the axis of the bone, which will extract any connected pores that did not meet the criteria of being fully surrounded by bone. The binary cortex image is then filled with all found pores, and a final pass is made using 2D connectivity to extract remaining pores. All extracted pores are combined into a final image (3H) for assessment of Po.Dm and Po.Dm.SD.
The cortical compartment VOI generated in the previous stage is used to mask a binary image of the mineralized cortical bone phase. In the masked image, background voxels include longitudinal osteonal pore space, transverse cortical foramen and erosions, as well as endosteal and periosteal void that are contained within the cortical VOI. An initial estimate of the intra-cortical pore space is defined as all void voxels in the cortical compartment that are surrounded by bone. A 2D connectivity criterion applied to the background is used to specifically select these high-confidence pore voxels. The remaining background voxels in the cortical VOI were considered low-confidence pore voxels. A hysteresis region growing process, constrained to the z-direction, to correspond with the primary osteonal orientation, is applied to extract low-confidence pore voxels longitudinally connected to high-confidence pore voxels (i.e., seeds). This serves to incorporate intra-cortical pore voxels that are transversely connected to the extra-osseal or medullary compartments in the axial plane and, therefore, are not captured in the initial pore space estimate. A second 2D connectivity criterion was applied to a concatenated bone and pore space image to capture any residual intra-cortical void. These voxels corresponded to intra-cortical surface irregularities or concavities that are not filled in the region growing process. The final estimate of the intra-cortical pore space is the digital combination of pore estimates from each previous step. Finally, objects with a volume smaller than 5 mutually connected voxels are discarded as they likely represent noise or other spurious, artefactual features rather than a true Haversion canal.
Cortical mask refinement (Figure 3)
In the final stage, the fully mineralized bone structure in the cortical compartment and the result of the intra-cortical porosity segmentation (stage 2) are digitally combined to generate a refined cortical mask that includes all mineralized bone and intra-cortical pores in the cortical compartment VOI and, therefore, precisely defines the periosteal and endosteal boundaries.
Quantitative Cortical Bone Analysis
Based on the image segmentation techniques described above, a number of quantitative measures of cortical bone density, geometry, and micro-architecture can be performed. A list of these parameters and descriptions are provided in Table 1. Apparent cortical bone mineral density (Ct.BMD) is calculated as the mean mineralization value for all voxels in the cortical compartment VOI (Figure 1C). Similarly cortical tissue mineral density (Ct.TMD) is calculated as the mean mineralization value for only voxels belonging to the mineralized phase following a surface erosion of 2 voxels to exclude contribution of partial volume effects (Figure 1D). Therefore Ct.BMD is the apparent density of the cortex – including all pore space – whereas Ct.TMD is the density of the bone material. Cross-sectional areas for the total (Tt.Ar, Figure 1A), cortical (Ct.Ar, Figure 1C), and trabecular (Tb.Ar, Figure 1B) compartments are calculated on a slice-by-slice basis and averaged over all slices. A direct 3D calculation [21] of cortical thickness (Ct.Th) is performed on the composite segmentations of the mineralized cortex and porosity (Figure 3I), thereby disregarding intra-cortical pore surfaces in the local distance calculations. This index represents a direct, 3D measure of endosteal-periosteal distance. Intra-cortical pore volume (Ct.Po.V) is calculated as the integral volume of all voxels identified as intra-cortical pore space (Figure 2H) while intra-cortical porosity (Ct.Po) is defined as a relative volumetric index of Ct.Po.V normalized by the sum of the mineralized and intra-cortical pore volume. Finally the mean cortical pore diameter (Ct.Po.Dm) and the distribution of cortical pore diameters (Ct.Po.Dm.SD) are calculated from the intra-cortical pore image (Figure 2H) by direct 3D methods analogous to those applied to high-resolution micro-tomography using maximal spheres [21].
Table 1.
Morphologic and densitometric parameter descriptions
| Parameter | Units | Description |
|---|---|---|
| Ct.TV | mm3 | Cortical total volume; the volume of all voxels (i.e. bone and pore) contained within the cortical volume of interest |
| Ct.BV | mm3 | Cortical bone volume; the volume of all bone voxels within the cortical volume of interest |
| Ct.BMD | mg HA/cm3 | Cortical bone mineral density; mean mineralization of the cortical volume of interest |
| Ct.TMD | mg HA/cm3 | Cortical tissue mineral density; mean mineralization of the segmented cortical bone voxels after surface partial volume suppression |
| Ct.Ar | mm2 | Cortical area; the average cross-sectional area of the cortical compartment between the periosteal and endosteal contours |
| Tb.Ar | mm2 | Trabecular area; the average cross-sectional area of the trabecular compartment circumscribed by the endosteal contour |
| Tt.Ar | mm2 | Total area; the average cross-sectional area of the whole bone circumscribed by the periosteal contour |
| Ct.Th | mm | Apparent cortical thickness; mean 3D distance from periosteal boundary to endosteal boundary, disregarding intra-cortical pores |
| Ct.Po.V | mm3 | Cortical pore volume; direct voxel-based measure of the volume of the intra-cortical pore space |
| Ct.Po | % | Cortical porosity; relative voxel-based measure of the volume of the intra-cortical pore space normalized by the sum of the pore and cortical bone volume |
| Ct.Po.Dm | μm | Cortical pore diameter; mean 3D diameter of the intra-cortical pore space |
| Ct.Po.Dm.SD | μm | Cortical pore diameter distribution; standard deviation of the 3D diameters of the intra-cortical pore space |
Patient Reproducibility Study
To evaluate the precision of the image processing techniques and quantitative measures described in the previous sections, existing reproducibility datasets from the University of California, San Francisco (UCSF) and the University of Calgary (Calgary) were retrospectively analyzed [8, 22]. In general, the Calgary cohort consisted of young, healthy men and women, whereas the UCSF cohort primarily consisted of post-menopausal women. Due to IRB-related protocol specifications, the UCSF dataset partially consisted of individual radius or tibia scan pairs from age-matched populations (i.e. not all subjects had reproducibility measurements at both the radius and tibia). A brief descriptive summary of the population is provided in Table 2. The study protocol was approved by each center’s local institutional review board for human research, and all subjects gave written, informed consent prior to participation.
Table 2.
Descriptive summary of the reproducibility subject population
| Parameter | Units | Pooled | Young | Elder |
|---|---|---|---|---|
| Number | [n] | 54 | 27 | 27 |
| Male/Female | [n/n] | 14/40 | 14/13 | 0/27 |
| Age | [years] | 43±20 | 26±3 | 61±10 |
HR-pQCT Imaging
All subjects were imaged in a clinical HR-pQCT system (XtremeCT, Scanco Medical AG) at the distal radius and/or tibia using the manufacturer’s standard in vivo protocol described in previous patient studies (15–17). Each subject was imaged twice with complete repositioning between acquisitions. For the UCSF cohort, repeat measurements were performed on the same day. For the Calgary cohort, repeat measurements were obtained in separate exams, approximately one week apart. The subject’s forearm or lower leg was immobilized in a carbon fiber cast that was fixed within the gantry of the scanner. A single dorsal-palmar projection image of the distal radius or tibia was acquired to define the tomographic scan region. The region started 9.5 mm and 22.5 mm proximal to the mid-jointline, for the radius and tibia respectively, and extended proximally 9.02 mm (110 slices). For tomography, 750 projections were acquired over 180 degrees with a 100 ms integration time at each angular position. The 12.6 cm field of view (FOV) was reconstructed across a 1536 × 1536 matrix using a modified Feldkamp algorithm, yielding 82 μm voxels [23]. The linear attenuation values in the reconstructed image were calibrated to hydroxyapatite concentration via an analogous protocol previously described for desktop micro-tomography [24]. Total scan time was 2.8 minutes with an effective dose of approximately 4.2 μSv at each skeletal site.
Image Analysis
The automatically generated contours were qualitatively inspected for quality assurance. When the contour visually deviated from the apparent periosteal or endosteal margin, minor semi-manual adjustments were performed to the affected region alone. The analysis of each dataset was constrained to a common VOI between the first and repeat acquisition. This common region was identified using software provided by the manufacturer. The method computes total cross-sectional area (Tt.Ar) on a slice-by-slice basis for each measurement, and then determines an optimal offset between paired scans using cross-correlation of Tt.Ar. As a result, the VOI was generally less than the full 110 slices acquired (average = 103 slices). All cortical bone analyses described above were applied to the common VOI determined in this fashion.
Statistics
Because the pooled data from both participating scanner sites consisted of two distinct populations age-wise, the data was stratified into two age subgroups, below and above the median age, to investigate age-dependent differences in the precision error. The median cutoff was 40 years for both radius and tibia cohorts. Mean and standard deviations were calculated for all cortical bone parameters. The precision error was calculated as the root mean square coefficient of variation (RMSCV%) of all paired exams and the least significant detectable change related to this error was calculated as follows [25]:
| (1) |
Age-dependent differences in precision were determined using a Student’s t-test (significance level p < 0.05). Bland-Altman analysis was used to qualitatively investigate bias in the precision error.
Results
Representative images of the distal radius and tibia of a young subject are presented in Figure 4 demonstrating the cortical compartment and intra-cortical porosity segmentation at different positions along the length of the scan region. Of the 216 scans processed using the automated segmentation algorithm described, 23 scans were found to have inadequately detected the endosteal boundary. Of these scans, 9 were young subjects with dense trabecular bone adjacent to the cortex, while 14 were elder subjects with focal endosteal trabecularization. In these cases, minor manual corrections were applied to the endosteal contour before quantitative analysis was performed. Figure 5 illustrates two cases where the endosteal boundary detection was not deemed acceptable and the corresponding corrected boundary.
Figure 4.

Representative 2D slices of a radius (A) and tibia (B) illustrating the cortical compartment (white), intra-cortical porosity (red), and trabecular compartment (gray) at the distal (left) and proximal (middle) extent of the scan region. 3D visualization of the segmented cortical bone (white, transparent) and intra-cortical porosity (red) is shown on the right.
Figure 5.
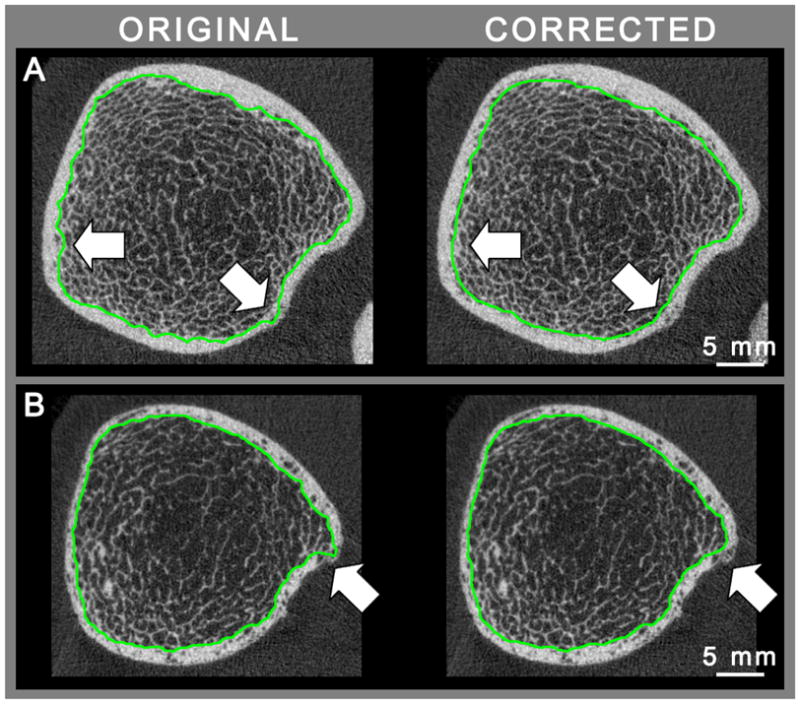
Representative images from young (A) and elderly (B) subjects illustrating inadequate localization of the endosteal contour (green) on the left, and the operator corrected contour on the right.
The mean and standard deviation for all cortical bone parameters are presented in Table 3. The least significant change (LSC) and the precision error (RMSCV%) determined by repeated measures are presented in Table 4. In general density and cross-sectional area measures were highly reproducible, with RMSCV < 1.0%. The exception was Ct.Ar measured at the distal radius, which was 1.5%. The LSC for Ct.Th was 50 and 60 μm for the distal tibia and radius respectively, while the relative precision was somewhat lower in the distal tibia (1.5%) compared to the distal radius (2.9%). Whereas the relative precision error for Ct.Po was substantially higher at the distal radius (13.0–13.5% RMSCV%) compared with the distal tibia (6.2–7.2% RMSCV%), the LSC in the distal radius tended to be lower (0.58% vs. 0.84%).
Table 3.
Summary of quantitative cortical bone measures (mean±SD) for pooled, young, and elder medians
| Parameter | Units | Pooled | Young | Elder |
|---|---|---|---|---|
| Radius | ||||
| Ct.BMD | [mg HA/cm3] | 820±59 | 843±44 | 797±63 |
| Ct.TMD | [mg HA/cm3] | 965±35 | 966±34 | 963±36 |
| Ct.Ar | [mm2] | 59±16 | 69±15 | 48±9 |
| Tb.Ar | [mm2] | 234±76 | 265±88 | 204±47 |
| Tt.Ar | [mm2] | 293±86 | 334±96 | 252±50 |
| Ct.Th | [mm] | 0.85±0.17 | 0.93±0.16 | 0.77±0.15 |
| Ct.Po.V | [mm3] | 9.02±6.03 | 8.90±6.53 | 9.14±5.55 |
| Ct.Po | [%] | 2.01±1.31 | 1.54±0.88 | 2.48±1.49 |
| Ct.Po.Dm | [μm] | 163±20 | 152±13 | 174±21 |
| Ct.Po.Dm.SD | [μm] | 67±17 | 60±12 | 74±18 |
| Tibia | ||||
| Ct.BMD | [mg HA/cm3] | 838±79 | 886±37 | 789±82 |
| Ct.TMD | [mg HA/cm3] | 973±49 | 998±24 | 946±54 |
| Ct.Ar | [mm2] | 125±29 | 144±26 | 106±15 |
| Tb.Ar | [mm2] | 594±158 | 643±167 | 543±132 |
| Tt.Ar | [mm2] | 719±168 | 787±174 | 649±131 |
| Ct.Th | [mm] | 1.25±0.26 | 1.37±0.26 | 1.13±0.19 |
| Ct.Po.V | [mm3] | 49.3±19.3 | 43.9±18.3 | 54.8±19.0 |
| Ct.Po | [%] | 5.07±2.52 | 3.56±1.14 | 6.64±2.62 |
| Ct.Po.Dm | [μm] | 186±20 | 184±20 | 189±19 |
| Ct.Po.Dm.SD | [μm] | 85±16 | 86±19 | 85±12 |
Table 4.
Least Significant Change and (RMSCV%) of quantitative cortical bone measures*
| Parameter | Units | Pooled | Young | Elder |
|---|---|---|---|---|
| Radius | ||||
| Ct.BMD | [mg HA/cm3] | 17 (0.7%) | 17 (0.7%) | 17 (0.8%) |
| Ct.TMD | [mg HA/cm3] | 10 (0.4%) | 10 (0.4%) | 10 (0.4%) |
| Ct.Ar | [mm2] | 2.3 (1.4%) | 2.6 (1.4%) | 1.9 (1.5%) |
| Tb.Ar | [mm2] | 2.6 (0.4%) | 3.0 (0.4%) | 2.0 (0.4%) |
| Tt.Ar | [mm2] | 1.0 (0.1%) | 1.1 (0.1%) | 0.8 (0.1%) |
| Ct.Th | [mm] | 0.06 (2.9%) | 0.03 (1.3%) | 0.08 (3.9%) |
| Ct.Po.V | [mm3] | 2.79 (13.5%) | 3.28 (14.8%) | 2.19 (12.0%) |
| Ct.Po | [%] | 0.58 (13.0%) | 0.58 (14.3%) | 0.57 (11.7%) |
| Ct.Po.Dm | [μm] | 22 (4.7%) | 20 (4.7%) | 23 (4.7%) |
| Ct.Po.Dm.SD | [μm] | 20 (10.1%) | 22 (11.1%) | 18 (9.1%) |
| Tibia | ||||
| Ct.BMD | [mg HA/cm3] | 13 (0.6%) | 11 (0.5%) | 14 (0.6%) |
| Ct.TMD | [mg HA/cm3] | 8 (0.3%) | 7 (0.3%) | 9 (0.3%) |
| Ct.Ar | [mm2] | 5.0 (1.4%) | 5.0 (1.1%) | 5.0 (1.7%) |
| Tb.Ar | [mm2] | 5.0 (0.3%) | 4.9 (0.3%) | 5.0 (0.4%) |
| Tt.Ar | [mm2] | 1.0 (0.1%) | 0.9 (0.0%) | 1.1 (0.1%) |
| Ct.Th | [mm] | 0.05 (1.5%) | 0.05 (1.5%) | 0.05 (1.5%) |
| Ct.Po.V | [mm3] | 10.8 (7.2%) | 11.3 (8.7%) | 10.4 (5.3%)b |
| Ct.Po | [%] | 0.84 (6.2%) | 0.75 (7.9%) | 0.92 (3.9%)c |
| Ct.Po.Dm | [μm] | 20 (3.8%) | 19 (3.6%) | 22 (4.0%) |
| Ct.Po.Dm.SD | [μm] | 16 (6.7%) | 15 (6.9%) | 17 (6.6%) |
Bold indicates statistically significant differences between young and elder cohorts with:
p < 0.05,
p < 0.01,
p < 0.001,
p < 0.0001
In general, the reproducibility of all cortical bone measures evaluated in this study did not differ significantly with respect to age. Sub-cohort analysis of the young and elder medians did not show differences in RMSCV%, with the exception of Ct.Po.V and Ct.Po in the distal tibia (p < 0.001). Nevertheless, the absolute LSC of cortical micro-architecture measures were similar between age groups (Ct.Po: 0.75% for young vs. 0.92% for elder). Cortical thickness tended to have a higher LSC for elder subjects (80 μm) compared to younger subjects (30 μm), however this did not reach statistical significance.
Bland-Altman plots were used to graphically investigate precision error bias. Graphs are presented in Figure 6 for cortical density and geometry parameters and in Figure 7 for cortical micro-architecture parameters. Young and elder groups were pooled, where appropriate, for clarity. Integral parameters Ct.Ar, Tb.Ar, and Ct.Po.V exhibited moderate to substantial dependence in the absolute error as evidenced by dispersion in their Bland-Altman plots. Total area and all averaged density and micro-architectural parameters were qualitatively not found to exhibit such bias.
Figure 6.

Bland-Altman plots for the density, thickness and cross-sectional area parameters. The radius is shown in circles and the tibia in squares. Young and elder groups were not significantly different, except for cortical and trabecular area, where there was a slight positive bias for the repeated measurement in the radius of the elder individuals. Errors for all other parameters were normally distributed.
Figure 7.

Bland-Altman plots for porosity measurements. The radius is shown in circles and the tibia in squares. All parameters showed normal error distributions.
Discussion
In this technique study we described a novel image processing approach to automatically quantify cortical bone density, geometry, and micro-architecture, and characterized the in vivo reproducibility of these measures in 54 subjects by repeat acquisitions at the distal radius and tibia. The principle outcome of this study was the establishment of a set of analysis methods that are robust across a broad range of structure types and ages. The fully automated software can be easily incorporated into existing study protocols. Furthermore, the precision results provide important reference data to inform the design of clinical imaging studies of cortical bone quality.
Reproducibility was generally highest for cortical bone density measures and was comparable to the level of in vivo precision reported previously for the manufacturer’s default cortical analysis [7–9, 22]. Critically, the reproducibility of the total cross-sectional area (Tt.Ar) and endosteal cross-sectional area (Tb.Ar) was 0.1% and 0.4%, respectively at both sites. Additionally, the differences in precision of areal measures between the young and elder medians were minimal. Because the areal measures are driven by the automated periosteal and endosteal contouring procedure described in Figure 1, this finding indicates that the compartment segmentation technique is very robust. Whereas the relative precision of cortical porosity measures was higher than the density or geometry parameters (6–13%), the absolute LSC was less than 1% of the total cortical compartment volume. The absolute LSC for mean cortical pore diameter (20μm) and cortical thickness (50–60 μm) were both smaller than the image voxel size (82μm).
It is important to note that relative (i.e. normalized) measures of reproducibility, such as RMSCV%, must be taken in the appropriate context. While the RMSCV% for Ct.Po reported here was greater than 10% in the radius, the RMSCV% for its unit complement (i.e. 1-Ct.Po, which is equivalent to Ct.BV/TV) is only 0.2%. Because longitudinal changes in these complementary parameters have the same absolute magnitude, relative changes in Ct.Po are substantially higher. In fact age-wise relative differences in Ct.Po have been found here and elsewhere to be large in relative magnitude (e.g. greater than 88% in the radius for pre- vs. post-menopausal women) [10, 11]. Therefore, the absolute LSC values observed in this study indicate an excellent ability to detect changes in the cortex.
In general, the least significant change values for all measures were relatively small compared with cross-sectional and longitudinal differences of biological and clinical relevance. For example, using pQCT Zanchetta et al. observed teriparatide-induced increases in cortical and total cross-sectional area at the distal radius of 4.6 and 12.7 mm2, respectively, following 18 months of treatment; approximately 2- and 12-fold larger than the least significant change found in this study for comparable indices (Ct.Ar and Tt.Ar) [26]. Several cross-sectional fracture case/control HR-pQCT studies in post-menopausal women have found differences in cortical thickness at the radius ranging from 100–300 μm [12, 13, 27], which is greater than the least significant change for Ct.Th (less than 50 μm) reported herein for a similar population (elder median). In a recent study of serial iliac crest bone biopsies, Borah et al. reported a median Ct.Po decrease of up to −1.1% and an increase of up to +1.2% following 5 years of treatment with risedronate or placebo, respectively [28]; changes that are approximately 1.5–2.0 times the LSC determined for the radius and tibia in this study.
Unsurprisingly, integral area and volume measures (Ct.Ar, Tb.Ar, Ct.Po.V) showed magnitude dependent bias in precision via Bland-Altman analysis. This would be expected for measures that are simply based on counting voxels in a VOI. On the other hand, the averaged density, geometric, and micro-architectural properties were qualitatively free of bias. This observation underscores the robustness of the techniques through which they were calculated and their utility for characterizing cortical bone quality in populations with significant biologic variability.
The analysis approach described herein offers several compelling advantages. First it was implemented to be fully automated and require minimal user interaction. In our in vivo reproducibility dataset the software produced unsatisfactory contouring results in a minimal number of scans (23 of 216) which subsequently necessitated minor operator adjustments. This was exclusively limited to detection of the endosteal boundary. In general, this was often due to a dense trabecular network adjacent to the cortex being included in the cortical compartment for young subjects (Figure 5A). Morphologically, these features were difficult to distinguish from cortical porosity and were erroneously included in the cortical compartment. In contrast, significant endosteal trabecularization resulted in cortical pores that were difficult to distinguish from marrow and were erroneously excluded from the cortical compartment (Figure 5B). These features were more common in elder subjects that required contour corrections. Nevertheless, it should be emphasized that operator intervention was only required for a small number of the acquired scans, and only a fraction of the contours required correction. Furthermore, no such quality assurance is routinely applied in the default analysis protocol despite the known limitations [8, 18, 19]; however it is likely that the same standard applied to the default segmentation would indicate more frequent manual corrections.
A second advantage is that the cortical density, geometry, and micro-architectural properties were determined using direct volumetric and morphometric approaches rather than based on tissue density or model assumptions. Specifically, unlike the standard analysis for HR-pQCT data, the density parameters are calculated in a way that accounts for partial volume effects. Additionally, the areal and volumetric measurements were calculated using direct voxel counting in the fine-structure segmented image [20], rather than based on a coarse cortical segmentation that regularly fails to detect thin cortical segments and is not density-calibrated [18, 19], or tissue density assumptions that may be influence by beam-hardening or x-ray scatter effects [29]. Finally, in this analysis, cortical thickness was calculated as the mean 3D distance between periosteal and endosteal surfaces. Intra-cortical porosity leads to significant underestimation of Ct.Th using direct measurement methods by reducing the size of the maximum sphere that fits within the cortex [19]. The error in Ct.Th measurements caused by porosity is difficult to predict because it would depend on the amount of porosity and how well the individual pores are resolved. Because intra-cortical pores were identified by the image-processing chain, these features could be avoided in the direct distance measurements.
While not a limitation of the analysis technique itself, it should be noted that cortical thickness at the distal-end of the standard scan location for the radius can be very small, particularly in osteoporotic individuals (200–300μm). While the detection of thin cortical bone regions using this method is superior to the standard segmentation, the volume of resolvable cortical porosity in the distal-most slices may be limited for some populations. This likely explains the relatively small magnitude and lower precision of porosity measures in the distal radius compared to the distal tibia. Application of this technique to more proximal locations in the distal metaphysis of the radius may provide greater reliability and biologic relevance.
Cortical bone’s central role in providing mechanical rigidity, even at anatomic locations predominantly comprised of trabecular bone, makes it a critical aspect of bone quality to be considered in the context of the etiology of bone metabolic disorders and the therapeutic interventions designed to address them. New high-resolution imaging techniques provide the ability to investigate cortical bone density, geometry, and micro-architecture non-invasively. The results presented here have established the robustness of image processing and analysis methods to automatically characterize these features from HR-pQCT images of the distal radius and tibia. The application of these techniques to emerging cross-sectional and longitudinal HR-pQCT datasets will provide an important contribution to the understanding of cortical bone’s role in a variety of conditions that affect fracture risk.
Acknowledgments
Funding: NIH/NCRR UCSF-CTSI Grant No. UL1 RR024131-01 (AJB)
NIH R01 AG17762 (SM)
Canadian Institutes of Health Research (SKB)
Alberta Heritage Foundation for Medical Research (SKB)
This publication was supported by NIH/NCRR UCSF-CTSI Grant Number UL1 RR024131-01 (AJB), NIH RO1 AG17762 (SM), and the Canadian Institutes of Health Research and the Alberta Heritage Foundation for Medical Research (SKB).
Footnotes
Publisher's Disclaimer: This is a PDF file of an unedited manuscript that has been accepted for publication. As a service to our customers we are providing this early version of the manuscript. The manuscript will undergo copyediting, typesetting, and review of the resulting proof before it is published in its final citable form. Please note that during the production process errors may be discovered which could affect the content, and all legal disclaimers that apply to the journal pertain.
Contributor Information
Andrew J. Burghardt, Email: andrew.burghardt@radiology.ucsf.edu.
Helen R. Buie, Email: hbuie@ucalgary.ca.
Andres Laib, Email: alaib@scanco.ch.
Sharmila Majumdar, Email: sharmila.majumdar@radiology.ucsf.edu.
Steven K. Boyd, Email: skboyd@ucalgary.ca.
References
- 1.Laib A, Hauselmann HJ, Ruegsegger P. In vivo high resolution 3D-QCT of the human forearm. Technol Health Care. 1998;6:329–37. [PubMed] [Google Scholar]
- 2.Muller R, Hildebrand T, Hauselmann HJ, Ruegsegger P. In vivo reproducibility of three-dimensional structural properties of noninvasive bone biopsies using 3D-pQCT. J Bone Miner Res. 1996;11:1745–50. doi: 10.1002/jbmr.5650111118. [DOI] [PubMed] [Google Scholar]
- 3.MacNeil JA, Boyd SK. Accuracy of high-resolution peripheral quantitative computed tomography for measurement of bone quality. Med Eng Phys. 2007;29:1096–105. doi: 10.1016/j.medengphy.2006.11.002. [DOI] [PubMed] [Google Scholar]
- 4.Burghardt AJ, Kazakia GJ, Majumdar S. A local adaptive threshold strategy for high resolution peripheral quantitative computed tomography of trabecular bone. Ann Biomed Eng. 2007;35:1678–86. doi: 10.1007/s10439-007-9344-4. [DOI] [PubMed] [Google Scholar]
- 5.Macneil JA, Boyd SK. Bone strength at the distal radius can be estimated from high-resolution peripheral quantitative computed tomography and the finite element method. Bone. 2008;42:1203–13. doi: 10.1016/j.bone.2008.01.017. [DOI] [PubMed] [Google Scholar]
- 6.Liu XS, Zhang XH, Sekhon KK, Adam MF, McMahon DJ, Bilezikian JP, Shane E, Guo XE. High-Resolution Peripheral Quantitative Computed Tomography Can Assess Microstructural and Mechanical Properties of Human Distal Tibial Bone. J Bone Miner Res. 2009 doi: 10.1359/jbmr.090822. [DOI] [PMC free article] [PubMed] [Google Scholar]
- 7.Boutroy S, Bouxsein ML, Munoz F, Delmas PD. In vivo assessment of trabecular bone microarchitecture by high-resolution peripheral quantitative computed tomography. J Clin Endocrinol Metab. 2005;90:6508–15. doi: 10.1210/jc.2005-1258. [DOI] [PubMed] [Google Scholar]
- 8.Kazakia GJ, Hyun B, Burghardt AJ, Krug R, Newitt DC, de Papp AE, Link TM, Majumdar S. In vivo determination of bone structure in postmenopausal women: a comparison of HR-pQCT and high-field MR imaging. J Bone Miner Res. 2008;23:463–74. doi: 10.1359/jbmr.071116. [DOI] [PubMed] [Google Scholar]
- 9.Khosla S, Riggs BL, Atkinson EJ, Oberg AL, McDaniel LJ, Holets M, Peterson JM, Melton LJ., 3rd Effects of sex and age on bone microstructure at the ultradistal radius: a population-based noninvasive in vivo assessment. J Bone Miner Res. 2006;21:124–31. doi: 10.1359/JBMR.050916. [DOI] [PMC free article] [PubMed] [Google Scholar]
- 10.Burghardt AJ, Kazakia GJ, Ramachandran S, Link TM, Majumdar S. Age and Gender Related Differences in the Geometric Properties and Biomechanical Significance of Intra-Cortical Porosity in the Distal Radius and Tibia. J Bone Miner Res. 2009 doi: 10.1359/jbmr.091104. [DOI] [PMC free article] [PubMed] [Google Scholar]
- 11.Nishiyama KK, Macdonald HM, Buie HR, Hanley DA, Boyd SK. Postmenopausal Women With Osteopenia Have Higher Cortical Porosity and Thinner Cortices at the Distal Radius and Tibia Than Women With Normal aBMD: An In Vivo HR-pQCT Study. J Bone Miner Res. 2009 doi: 10.1359/jbmr.091020. [DOI] [PubMed] [Google Scholar]
- 12.Sornay-Rendu E, Cabrera-Bravo JL, Boutroy S, Munoz F, Delmas PD. Severity of vertebral fractures is associated with alterations of cortical architecture in postmenopausal women. J Bone Miner Res. 2009;24:737–43. doi: 10.1359/jbmr.081223. [DOI] [PubMed] [Google Scholar]
- 13.Vico L, Zouch M, Amirouche A, Frere D, Laroche N, Koller B, Laib A, Thomas T, Alexandre C. High-resolution pQCT analysis at the distal radius and tibia discriminates patients with recent wrist and femoral neck fractures. J Bone Miner Res. 2008;23:1741–50. doi: 10.1359/jbmr.080704. [DOI] [PubMed] [Google Scholar]
- 14.MacNeil JA, Boyd SK. Load distribution and the predictive power of morphological indices in the distal radius and tibia by high resolution peripheral quantitative computed tomography. Bone. 2007;41:129–37. doi: 10.1016/j.bone.2007.02.029. [DOI] [PubMed] [Google Scholar]
- 15.Boutroy S, Van Rietbergen B, Sornay-Rendu E, Munoz F, Bouxsein ML, Delmas PD. Finite element analysis based on in vivo HR-pQCT images of the distal radius is associated with wrist fracture in postmenopausal women. J Bone Miner Res. 2008;23:392–9. doi: 10.1359/jbmr.071108. [DOI] [PubMed] [Google Scholar]
- 16.Melton LJ, 3rd, Riggs BL, van Lenthe GH, Achenbach SJ, Muller R, Bouxsein ML, Amin S, Atkinson EJ, Khosla S. Contribution of in vivo structural measurements and load/strength ratios to the determination of forearm fracture risk in postmenopausal women. J Bone Miner Res. 2007;22:1442–8. doi: 10.1359/jbmr.070514. [DOI] [PubMed] [Google Scholar]
- 17.Yeni YN, Brown CU, Wang Z, Norman TL. The influence of bone morphology on fracture toughness of the human femur and tibia. Bone. 1997;21:453–9. doi: 10.1016/s8756-3282(97)00173-7. [DOI] [PubMed] [Google Scholar]
- 18.Buie HR, Campbell GM, Klinck RJ, MacNeil JA, Boyd SK. Automatic segmentation of cortical and trabecular compartments based on a dual threshold technique for in vivo micro-CT bone analysis. Bone. 2007;41:505–15. doi: 10.1016/j.bone.2007.07.007. [DOI] [PubMed] [Google Scholar]
- 19.Davis KA, Burghardt AJ, Link TM, Majumdar S. The effects of geometric and threshold definitions on cortical bone metrics assessed by in vivo high-resolution peripheral quantitative computed tomography. Calcif Tissue Int. 2007;81:364–71. doi: 10.1007/s00223-007-9076-3. [DOI] [PubMed] [Google Scholar]
- 20.Laib A, Ruegsegger P. Comparison of structure extraction methods for in vivo trabecular bone measurements. Comput Med Imaging Graph. 1999;23:69–74. doi: 10.1016/s0895-6111(98)00071-8. [DOI] [PubMed] [Google Scholar]
- 21.Hildebrand T, Ruegsegger P. A new method for the model-independent assessment of thickness in three-dimensional images. J Microsc. 1997;185:67–75. [Google Scholar]
- 22.MacNeil JA, Boyd SK. Improved reproducibility of high-resolution peripheral quantitative computed tomography for measurement of bone quality. Med Eng Phys. 2008;30:792–9. doi: 10.1016/j.medengphy.2007.11.003. [DOI] [PubMed] [Google Scholar]
- 23.Feldkamp LA, Davis LC, Kress JW. Practical cone-beam algorithm. J Opt Soc Am A. 1984;1:612–619. [Google Scholar]
- 24.Burghardt AJ, Kazakia GJ, Laib A, Majumdar S. Quantitative assessment of bone tissue mineralization with polychromatic micro-computed tomography. Calcif Tissue Int. 2008;83:129–38. doi: 10.1007/s00223-008-9158-x. [DOI] [PMC free article] [PubMed] [Google Scholar]
- 25.Shepherd JA, Lu Y. A generalized least significant change for individuals measured on different DXA systems. J Clin Densitom. 2007;10:249–58. doi: 10.1016/j.jocd.2007.05.002. [DOI] [PubMed] [Google Scholar]
- 26.Zanchetta JR, Bogado CE, Ferretti JL, Wang O, Wilson MG, Sato M, Gaich GA, Dalsky GP, Myers SL. Effects of teriparatide [recombinant human parathyroid hormone (1–34)] on cortical bone in postmenopausal women with osteoporosis. J Bone Miner Res. 2003;18:539–43. doi: 10.1359/jbmr.2003.18.3.539. [DOI] [PubMed] [Google Scholar]
- 27.Melton LJ, 3rd, Christen D, Riggs BL, Achenbach SJ, Muller R, van Lenthe GH, Amin S, Atkinson EJ, Khosla S. Assessing forearm fracture risk in postmenopausal women. Osteoporos Int. 2009 doi: 10.1007/s00198-009-1047-2. [DOI] [PMC free article] [PubMed] [Google Scholar]
- 28.Borah B, Dufresne T, Nurre J, Phipps R, Chmielewski P, Wagner L, Lundy M, Bouxsein M, Zebaze R, Seeman E. Risedronate Reduces Intracortical Porosity in Women with Osteoporosis. J Bone Miner Res. 2009 doi: 10.1359/jbmr.090711. [DOI] [PubMed] [Google Scholar]
- 29.Sekhon K, Kazakia GJ, Burghardt AJ, Hermannsson B, Majumdar S. Accuracy of volumetric bone mineral density measurement in high-resolution peripheral quantitative computed tomography. Bone. 2009;45:473–9. doi: 10.1016/j.bone.2009.05.023. [DOI] [PMC free article] [PubMed] [Google Scholar]