Abstract
The vascular endothelial growth factor receptor, Flt1 is a transmembrane receptor co-expressed with an alternate transcript encoding a secreted form, sFlt1, that functions as a competitive inhibitor of Flt1. Despite shared transcription start sites and upstream regulatory elements, sFlt1 is in far greater excess of Flt1 in the human placenta. Phorbol myristic acid and dimethyloxalylglycine differentially stimulate sFlt1 compared to Flt1 expression in vascular endothelial cells and in cytotrophoblasts. An FLT1 minigene construct containing exon 13, 14 and the intervening region, recapitulates mRNA processing when transfected into COS-7, with chimeric intronic sFlt1 transcripts arising by intronic polyadenylation and other Flt1/sFlt1 transcripts by alternate splicing. Inclusion of exon 15 but not 14 had a modest stimulatory effect on the abundance of sFlt1. The intronic region containing the distal poly(A) signal sequences, when transferred to a heterologous minigene construct, inhibited splicing but only when cloned in sense orientation, consistent with the presence of a directional cis-element. Serial deletional and targeted mutational analysis of cis-elements within intron 13 identified intronic poly(A) signal sequences and adjacent cis-elements as the principal determinants of the relative ratio of intronic sFlt1 and spliced Flt1. We conclude that intronic signals reciprocally regulate splicing and polyadenylation and control sFlt1 expression.
INTRODUCTION
Fms-like tyrosine kinase-1 (Flt1) is one of three principal receptors for vascular endothelial growth factor (VEGFR) regulating angiogenesis and vasculogenesis (1–3). A soluble form of the receptor (sFlt1) binds VEGF with an affinity equal to Flt1 and thus is a natural VEGF antagonist and potent anti-angiogenic factor whose physiological and pathological roles are just beginning to be understood. For example, the normal corneal avascularity from dugong to human appears to be due to selective sFlt1 expression in the cornea (4). Conditional disruption of sFlt1 in mice leads to vascularized corneas and administration of sFlt1 re-establishes corneal avascularity in Pax6 +/- mice who have sFlt1 deficiency and vascularized corneas. Spatially regulated secretion of sFlt1 in areas adjacent to an emerging blood vessel sprout leaves a VEGF-rich path that directs sprouts away from the parent vessel and permits the creation of an elegant vascular network early in angiogenesis (5). Placental overproduction of sFlt1 may contribute to the syndrome of preeclampsia with proteinuria and hypertension since recombinant sFlt1 induces proteinuria in pregnant and non-pregnant rodents (6–8).
Flt1 and sFlt1 mRNAs arise from the gene, FLT1 and the mRNAs have a common transcription start site. Flt1 contains 30 spliced exons and sFlt1 shares the first 13 or 14 exons and utilizes alternative poly(A) signal sequences to create alternate transcripts with a shorter open reading frame (9–13). Full-length Flt1 is 180–200 kDa in size and contains an extracellular ligand binding domain, a membrane spanning segment, and a C-terminal intracellular tail that contains the tyrosine kinase domains. The alternate transcripts of sFlt1 encode glycosylated protein variants that are 85–135 kDa in size, lack the membrane-spanning and tyrosine kinase domains and are secreted proteins (12–14).
In some tissues, such as in the normal cornea and placenta, and in a pathophysiological state like preeclampsia, the increase in sFlt1 is not always matched by a corresponding increase in Flt1 expression (4,15–17). Since Flt1 and sFlt1 share the same transcription start site with common upstream regulatory cis-elements, the selective overexpression of sFlt1 mRNA is likely mediated by post-transcriptional regulation. sFlt1 arises by one of two principal mechanisms: intronic polyadenylation or alternate splicing. In the first, the sFlt1 transcript arises when splicing of exon 13 to exon 14 does not occur and instead the transcript reads through into intron 13 and utilizes one of three polyadenylation signal sequences to form transcripts, sFlt1-i13s and sFlt1-i13l, that do not include exons 14–30 (11). In the second, the sFlt1 transcript splices normally from exons 13–14 and then splices to one of two alternate exons, exon 15a or 15b, where it terminates to create sFlt1_v2 (sFlt1-e15a) or sFlt1_v3 or reads through into intron 14 to create sFlt1_v4 (13,14). Little is known about factors that regulate upstream polyadenylation to yield sFlt1-i13, or those that regulate splicing of exon 13 to exon 14 and beyond to yield Flt1. In alternatively spliced and/or polyadenylated transcripts, competition between splicing signals and polyadenylation signals may determine the net balance between splicing and cleavage/polyadenylation at a given site (18). An increase in the expression of sFlt1-i13 could thus result from robust cis-elements and trans-acting factors that favor polyadenylation within intron 13 or from relatively weak elements that regulate splicing further downstream. We hypothesized that cis-elements within intron 13 may preferentially direct processing of the transcribed FLT1 gene to sFlt1. In this article, we identify regulatory sequences within intron 13 that reciprocally regulate intronic polyadenylation and splicing.
MATERIALS AND METHODS
Cell culture
Primary cultures of human umbilical vein endothelial cells (HUVEC), uterine microvascular endothelial cells (UtMVEC) (Cambrex Corporation, East Rutherford, NJ, USA) and human microvascular endothelial cells (HMEC-1) were cultured in Endothelial Growth Medium-2 (Cambrex Corporation) with 2% fetal bovine serum (FBS). Primary cytotrophoblasts (CTB) were isolated from term placenta as previously described (11,19). These CTBs were cultured in 6-well plates in Ham’s F10/Waymouth (1:1 vol/vol) media (HWM) containing 10% FBS. COS-7 cells were cultured in Dulbecco’s modified Eagle medium (DMEM) and JEG-3 cells in minimum essential medium (MEM), both containing 10% FBS. The HTR-8/SVNeo cell line was a gift from Charles Graham and was grown in DMEM/F12 (1:1) with 10% serum. In some cases, vascular endothelial cells were treated with 30 nM phorbol myristic acid (PMA) (Enzo Life Sciences, Plymouth Meeting, PA, USA) for 4 h and JEG-3 cells were treated with dimethyloxalyl glycine (DMOG) (Frontier Scientific, Logan, UT, USA) for 48 h. In other instances, CTBs and JEG-3 cells were placed in humidified hypoxia chambers (Billups-Rothenburg, Del Mar, CA, USA) and subjected to a 2% or 8% O2 mixture at 37°C for 48 h.
Minigene plasmid construction
To measure splicing and intronic polyadenylation, a 6010 nt genomic fragment of the Flt1 gene that includes exon 13, intron 13 and exon 14, as well as ∼500 bp of intronic sequence flanking exon 13 and 14 was amplified from human placental DNA using primers hFlt1intronF1 and hFlt1intronR1 (Table 1). This minigene cassette was then cloned into the multiple cloning site of the splicing vector pL53In between exons 2 and 3 of the rat insulin gene to create pL53In_Flt1/13 + 14. To map processing elements, various deletions of pL53In_Flt1/13 + 14 were created by restriction enzyme digestion within intron 13. The putative proximal intronic sFlt1 polyA signal sequence ATTAAA was mutated to ATTAGA by Quikchange™ site-directed mutagenesis (Stratagene, La Jolla, CA, USA) with primers prox_polyA_mutF and prox_polyA_mutR (Table 1). The distal intronic sFlt1 polyA signal sequences A2 and A4 were mutated as previously described (11). To test intronic Flt1 sequence with heterologous exons, a 1221 nt SpeI–NheI fragment of intron 13 was cloned into the multiple cloning site of pL53In. Other minigene constructs were created by introducing, in various combinations, individual exons from 13 to 15 with adjacent splicing signals into pL53In. The plasmids were introduced into COS-7 cells by electroporation at 950 µF and 3200 V with a Gene Pulser II (Bio-Rad; Hercules, CA, USA) and into JEG-3 cells by transfection with Lipofectamine 2000. The cells were then plated in standard culture media and RNA was isolated 48 h later.
Table 1.
Primers used for PCR amplification
| hFlt1intronF1 | CTCGAGTCACCCCCACCAAAAAGTACA |
| hFlt1intronR1 | GAGCTCGCCGTCATGGTGAACTGAATC |
| prox_polyA_mutF | CAAAGTAATGTAAAACATTAGTCGACTCATTAAAAAGTAACAG |
| prox_polyA_mutR | CTGTTACTTTTTAATGAGTCGACTAATGTTTTACATTACTTTG |
| ins_exon2_F | CGATCCGCTTCCTGCCCC |
| ins_exon3_R | CGGGCCACCTCCAGTGCC |
| sFlt1_R | TCTCCTCCGAGCCTGAAAGTT |
PolyA reporter assay
A 286 bp PstI–SmaI fragment that included the putative proximal polyA signal sequences at the 5′-end of intron 13 was isolated by restriction digestion from the previously amplified 6010 bp Flt1 genomic fragment and ligated into the multiple cloning site of the polyadenylation signal reporter vector, pCβS, to create pCβS/sFlt1prox. The putative proximal intronic sFlt1 polyA signal sequence ATTAAA was mutated to ATTAGA by Quikchange™ site-directed mutagenesis with primers prox_polyA_mutF and prox_polyA_mutR. The bovine growth hormone polyA signal sequence in pCβS clones were removed by XhoI digestion and then the plasmids were introduced into HTR-8/SVNeo by electroporation at 600 µF and 200 V with a Gene Pulser II (Bio-Rad) and plated in standard culture media and RNA was isolated as previously described (11).
RNA preparation and ribonuclease protection assays
Total RNA from cell cultures was prepared with the Absolutely RNA® miniprep kit (Stratagene, La Jolla, CA, USA) or with the RNeasy Mini Kit (Qiagen, Valencia, CA, USA). To simultaneously measure sFlt1 and Flt1 mRNA levels by ribonuclease protection assays (RPA), a 364 bp Flt1 cDNA, containing contiguous portions of exon 13 and exon 14, was used as a template for synthesis of an antisense cRNA probe as previously described (11). This cRNA probe detects a 364 nt product that includes all transcripts that splice exon 13 to exon 14 and a 269 nt sFlt1 product that includes all transcripts that read through into intron 13 and was also used to identify processed transcripts from minigene constructs containing exons 13 and 14 of FLT1. To map mRNA cleavage from the polyadenylation signal reporter vector, pCβs-sFlt1prox, the construct was linearized and used to synthesize cRNA probes as described (11). To measure splicing of exon 2 to exon 3 of the rat insulin gene, an 842 nt product containing exon 2, exon 3 and intervening sequence was amplified from the splicing vector pL53In using primers ins_exon2_F and ins_exon3_R (Table 1) and cloned into pCRXL-topo and then a 575 bp AvrII–XbaI–XbaI fragment was trimmed from the inserted sequence to create pCRXL_ins_exon2. This was linearized and used for synthesis of an antisense cRNA probe. This cRNA probe will protect a 176 nt exon 2 product if splicing occurs and a 272 nt product if the transcript is unspliced and reads into the intervening sequence. In all cases RPA was performed as previously described (20).
RT–PCR and qRT–PCR
Flt1 and sFlt1 mRNA were amplified from CTB by real-time PCR as previously described (14). RNAs from transfected COS-7 and JEG-3 cells were subject to reverse transcription with AffinityScript® QPCR cDNA synthesis kit (Stratagene) under the following conditions: 5 min incubation at 25°C for primer annealing, 42°C for 45 min for cDNA synthesis and 5 min termination at 95°C. Chimeric transcripts that included insulin exon 2 and insulin exon 3 sequences were amplified with forward (ins_exon2_F) and reverse primers (ins_exon3_R) corresponding to sequence in exon 2 and exon 3 of pL53In (Table 1). Transcripts from minigene constructs that terminated within intron 13 were identified with the same forward primer and the reverse primer, sFlt1_R (Table 1). Real-time PCR reactions for these processed minigenes were performed with Brilliant SYBR® Green® QPCR master mix (Stratagene) with the following cycling conditions: 1 cycle for 10 min at 95°C followed by 30–45 cycles (15–25 cycles for 18S rRNA) of 30 s denaturation at 95°C, 1 min annealing at 55–60°C and 1 min extension at 72°C. The number of cycles, annealing temperature and extension time were varied as appropriate for the abundance of transcripts, the Tm of primers and the size of amplicons as previously described (11). All reactions were performed in a Mx3000p Multiplex Quantitative PCR system (Stratagene) and dissociation curves were generated for all samples.
RESULTS
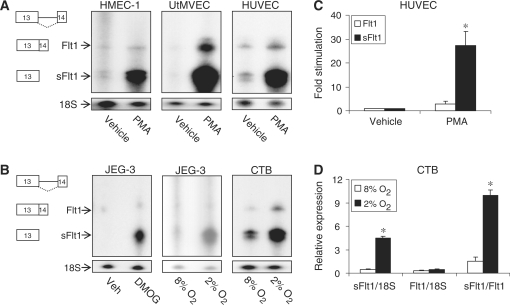
Flt1 and sFlt1 are membrane-bound and circulating forms of a VEGF receptor necessary for normal angiogenesis that are expressed in both vascular endothelial cells and in cytotrophoblasts. sFlt1 binds VEGF and placental growth factor (PlGF) with an affinity equal to Flt1; consequently, this soluble receptor can inhibit VEGF both locally where it is produced and in distant vascular beds (6,7). Since sFlt1 has autocrine, paracrine and endocrine effects, calibrating the local and systemic actions of VEGF/PlGF necessitates exquisite control of sFlt1 expression. There are several alternate transcripts for sFlt1 and three of these are generated by utilization of polyadenylation signal sequences within intron 13 to create a composite 3′-terminal exon (11,14). To begin to study the regulation of Flt1 and sFlt1 expression we examined the effect of protein kinase C (PKC) activation in HUVEC. We used a riboprobe that identifies all forms of sFlt1 that terminate within intron 13 and differentiates them from all other transcripts that splice from exon 13 to exon 14 including Flt1 (for schematic of sFlt1 transcripts, see Supplementary Figure S1). PKC activation increased spliced Flt1 and intronic sFlt1 expression, with the increase in intronic sFlt1 expression significantly greater than the spliced Flt1 (Figure 1A and B). We saw a similar increase with PKC activation in HMEC-1 and UtMVEC, two other vascular endothelial cells. As all sFlt1 and Flt1 mRNAs are expressed from the gene FLT1 and share the same transcription start site with common upstream regulatory elements, this differential increase suggested that intronic sFlt1 expression is post-transcriptionally regulated by PKC. PMA did not stimulate luciferase expression in transfected HUVEC cells expressing the reporter gene under the control of the proximal Flt1 promoter (data not shown), also consistent with a post-transcriptional effect. We tested the effect of hypoxia in cultured primary CTB and demonstrated that although both spliced Flt1 and intronic sFlt1 were increased; the rise in sFlt1 was disproportionately greater than Flt1 (Figure 1C and D). We saw a similar effect on intronic sFlt1 with hypoxia and with DMOG, a hypoxia-mimic, in JEG-3 cells, again consistent with post-transcriptional regulation of the intronic form of sFlt1.
Figure 1.
Differential regulation of sFlt1 and Flt1 transcripts in vascular endothelial cells and trophoblasts determined by RPA and qRT–PCR. An Flt1 cDNA used as template to construct a cRNA probe detects both intronic sFlt1 and spliced Flt1 simultaneously. An 18S rRNA probe is used as a loading control for RPA. (A) RPA demonstrating that PMA treatment differentially increases intronic sFlt1 mRNA in HMEC-1, UtMVEC and HUVEC. (B) Aggregate data from several experiments demonstrating that PMA stimulates sFlt1 expression to a greater extent than Flt1 in HUVEC. n = 4 ± SEM, *P < 0.01 compared to Flt1. (C) RPA demonstrates that DMOG or hypoxia (2% O2) stimulates intronic sFlt1 expression to a greater extent than Flt1 in JEG-3 cells and CTB. (D) qRT–PCR confirms that hypoxia (2% O2) stimulates sFlt1 expression to a greater extent than Flt1 in CTB. n = 3 ± SEM, *P < 0.001 compared to corresponding 8% O2 value.
Furthermore, we found that two other transcripts, sFlt1_v3 and sFlt1_v4, that terminate after exon 14 were expressed in very low abundance in CTB and HUVEC compared to both sFlt1 and Flt1 (Supplementary Figure S2). We then focused our efforts on the regulation of the intron 13 form of sFlt1. Given the differential increase in the intron 13 form of sFlt1, we reasoned that cis-elements within intron 13 may regulate the synthesis of intronic sFlt1 mRNA by intronic polyadenylation or the synthesis of Flt1 by splicing of exon 13 to exon 14 or both in a reciprocal manner. We have previously confirmed the presence of two polyA signal sequences that are 124 bp apart, towards the 3′-end of intron 13, which generate ∼7 Kb sFlt1 transcripts (sFlt1-i13l) with an unusually long 3′-UTR (11). The other intronic sFlt1 transcript (sFl1-i13s) appears to have a 3′-UTR of just 30 nt; a putative signal sequence found just upstream of the polyadenylation site of sFlt1-i13s is presumed to direct the cleavage and polyadenylation of this transcript (11).
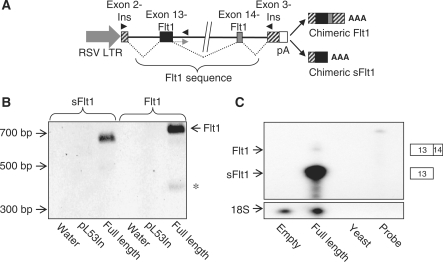
To begin to examine the mechanisms that regulate splicing and intronic polyadenylation of FLT1, we constructed an sFlt1/Flt1 minigene in an exon-trap vector containing authentic 5′ and 3′ exons such that it will permit transcription initiation, splicing and polyadenylation when transfected into cells in culture. The plasmid, pL53In has the exon trap cassette driven by an RSV promoter with the leader sequences coming from the placental alkaline phosphatase gene and exon 2 of the rat preproinsulin II gene. The 3′-end of this transcriptional unit has exon 3 of the rat preproinsulin II gene that includes a poly(A) signal sequence (Figure 2A). A genomic fragment of the FLT1 gene that includes exon 13, intron 13 and exon 14 in its entirety was cloned into pL53In to create pL53In_Flt1/13 + 14. We reasoned that all of the relevant cis-elements required for the readthrough from exon 13 into intron 13 (to create intronic sFlt1) and for splicing of exon 13 to exon 14 (to create Flt1) would be contained within this gene fragment. In the assembled construct, the cleavage and polyadenylation of chimeric ‘Flt1’ would be directed by poly(A) signal sequences downstream (in exon 3 of the insulin gene), while the cleavage and polyadenylation of chimeric intronic sFlt1 would be directed by poly(A) signals within intron 13 of FLT1. To validate this construct as a model to study the regulation of exon 13 to exon 14 splicing and the regulation of intronic polyadenylation, we transfected the expression vector, pL53In/Flt1 into COS-7 cells and then identified the transcribed and processed transcripts by RT–PCR. The spliced chimeric ‘Flt1’ transcript was amplified with a 5′-primer within exon 2 of insulin and a 3′-primer within exon 3 of insulin and the spliced chimeric sFlt1 transcript was identified with the same forward primer and a reverse primer within intron 13 corresponding to transcribed sequence of sFlt1. We were able to amplify products of the predicted 695 bp and 661 bp which were then sequenced to confirm that these products corresponded to the appropriately processed chimeric Flt1 and sFlt1, respectively (Figure 2B). We then transfected the minigene construct into COS-7 cells and measured the relative abundance of both processed transcripts simultaneously with an RPA probe that differentiates intronic ‘sFlt1’ from spliced ‘Flt1’. We find that virtually all of the processed RNA corresponded to intronic sFlt1 with little splicing of exon 13 to exon 14 (Figure 2C). The data indicate that this minigene construct can be used to identify cis-elements that regulate readthrough into intron 13 and those that regulate splicing of exon 13 to exon 14.
Figure 2.
An Flt1/sFlt1 minigene construct is processed primarily to sFlt1. (A) Schematic of pL53In vector with the minigene cassette containing exon 13, 14 and flanking intronic sequence of FLT1 (6010 bp) cloned between to create pL53In_Flt1/13 + 14 and is shown above. Primers used for PCR in (B) are shown as solid arrowheads. Relevant chimeric products transcribed from this minigene are also shown. (B) RT–PCR analysis from transfected COS-7 cells confirms that the insulin/Flt1 hybrid gene is appropriately processed to yield two chimeric transcripts. Asterisk is a minor transcript where exon 13 is spliced out. (C) RPA demonstrating relative abundance of transfected processed intronic sFlt1 and processed spliced ‘Flt1’. Digested RNA samples are run alongside yeast RNA (negative control) and (undigested) probe. No signal for human sFlt1 or Flt1 is detected in cells transfected with empty plasmid. When the pL53In_Flt1/13 + 14 construct (full length) is transfected, the predominant processed product corresponds to intronic sFlt1 with very little Flt1 formed.
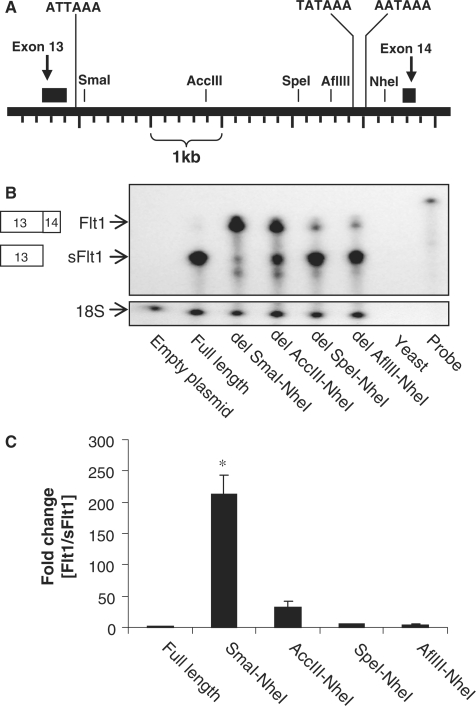
We then created a series of deletion constructs to identify cis-elements within intron 13 that regulate processing of Flt1. In contrast to the full-length construct, deletion of a ∼4300 bp SmaI–NheI intronic fragment switched processing almost completely to spliced ‘Flt1’, clearly demonstrating that cis-elements within intron 13 regulate both polyadenylation and splicing (Figure 3A–C). The shift from intronic polyadenylation to splicing was not from loss of all polyadenylation signal sequences since the proximal sFlt1 polyA signal sequence is still present in the largest deletion construct. We demonstrate that as the deleted region gets progressively smaller in a 5′–3′ direction, there is progressively less splicing to Flt1 (Figure 3B and C). This suggests that there are cooperative or additive interactions between upstream cis-elements and the distal polyA sites that promote processing to intronic sFlt1 and that the loss of the distal polyA sites was still sufficient to stimulate modest splicing of exon 13 to exon 14.
Figure 3.
Mapping cis-elements within intron 13 that regulate the relative abundance of intronic sFlt1 and Flt1. (A) Schematic representation of human FLT1 gene in the region of exons 13 and 14. Exon 13 splices to exon 14 to form Flt1; alternatively, intronic polyadenylation sites are used to create a composite 3′ terminal exon for sFlt1. The position of the putative proximal poly(A) signal sequence, the known distal poly(A) signal sequences and the restriction sites used to map cis-elements are shown. (B) RPA demonstrating relative abundance of intronic sFlt1 and spliced Flt1 in COS-7 cells transfected with a series of Flt1 minigene constructs. The full-length construct leads primarily to intronic sFlt1, and the largest deletions leads primarily to spliced Flt1. Progressive 5′–3′ deletions lead to a fall in processed Flt1. (C) Pooled quantitated data from several experiments with the Flt1 to sFlt1 ratio in each condition expressed as fold increase compared to the ratio in the full-length construct. n = 3, mean ± SEM, *P < 0.01, ANOVA (by ranks).
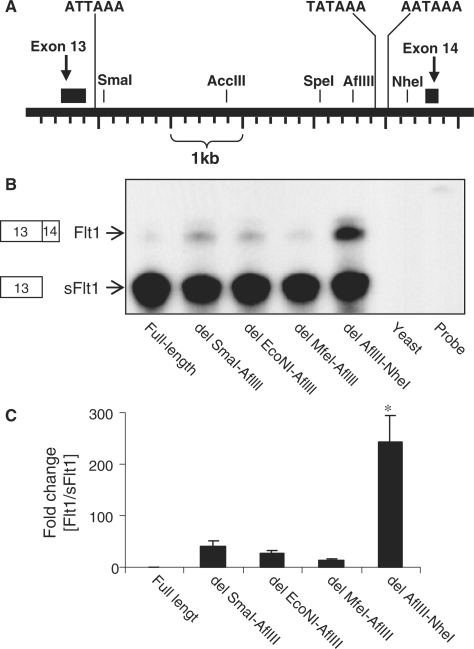
To determine if the upstream elements could function to switch splicing independently of the distal polyA sites between AfllIII and NheI, we created another series of deletions which did not include the AflIII–NheI region. We demonstrate that the effect of deletions between SmaI and AflIII are small and insignificant compared to the effect of the removal of a AflIII–NheI fragment at the 3′-end of intron 13 confirming that the primary determinant of intronic processing to sFlt1 in this series of constructs is the cis-element containing the distal polyA sites (Figure 4A–C).
Figure 4.
The AflIII–NheI region of FLT1 intron 13 is required to significantly reduce splicing of exon 13 to exon 14. (A) Schematic representation of human FLT1 gene in the region of exons 13 and 14. The position of the putative proximal poly(A) signal sequence, the known distal poly(A) signal sequences and the restriction sites used to map cis-elements is shown. (B) RPA demonstrating relative abundance of intronic sFlt1 and spliced Flt1 in COS-7 cells transfected with a series of Flt1 minigene constructs. The full-length construct leads primarily to intronic sFlt1, and deletions that do not remove the distal polyA sites do not substantially increase the abundance of spliced Flt1. Deletion of the region between AflIII and NheI, has a significant effect on processing to spliced Flt1. (C) Pooled quantitated data from several experiments with the Flt1 to sFlt1 ratio in each condition expressed as fold increase compared to the ratio in the full-length construct. n = 4, mean ± SEM, P < 0.001, ANOVA, *P < 0.05 compared to each of the other samples.
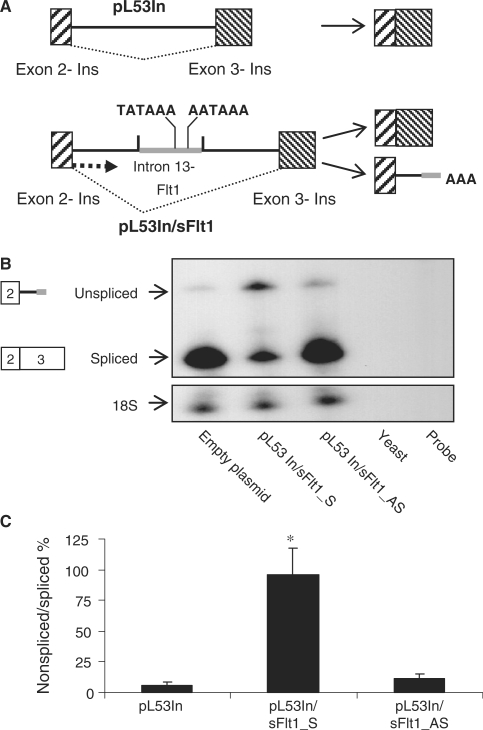
To confirm that the regulatory elements at the 3′-end of intron 13, which included the distal polyadenylation signal sequences, were sufficient to inhibit splicing and promote intronic polyadenylation, we transferred a ∼1200 nt distal fragment in sense and antisense orientation into pL53In between insulin exons 2 and exon 3. In the parent minigene plasmid, the principal processed RNA arises from splicing of exon 2 to exon 3. The splicing of exon 2 to exon 3 is significantly shifted to intronic polyadenylation giving rise to an unspliced transcript but only when the intron 13 fragment is cloned in sense orientation (Figure 5A–C). This is consistent with the known presence, within this construct, of the distal polyA signal sequences, which is expected to be a directional cis-element. When the intron 13 pA site is introduced, the unspliced transcript does not increase as much as the spliced transcript is decreased probably reflecting the relative instability of the unspliced transcript compared to the spliced transcript, although this was not formally tested.
Figure 5.
A distal intron 13 region reduces splicing of heterologous exons. (A) Schematic representation of pL53In with and without the inserted sequence from the distal end of FLT1 intron 13. The schematic representation shows two possible processed products—one from splicing of exon 2 to exon 3 and one unspliced product that uses intronic polyadenylation signal sequences to create a composite 3′-terminal exon terminated within intron 13 by cleavage and polyadenylation. (B) RPA demonstrating relative abundance of the unspliced and spliced products from the pL53In minigene. Insertion of the FLT1 intron 13 distal region in sense orientation (pL53In/sFlt1_S) but not in antisense orientation (pL53In/sFlt1_AS) reduces splicing and simultaneously increases the unspliced product. (C) Pooled quantitated data from several experiments with the unspliced product expressed as a ratio of the spliced product. n = 3, mean ± SEM, P < 0.005 ANOVA, *P < 0.05 compared to other samples.
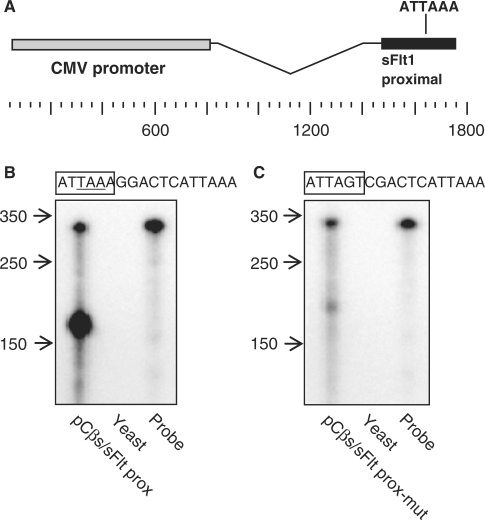
The results thus far suggested that the region containing the distal polyA signal sequences had a profound effect on polyadenylation of sFlt1. We had also identified, by sequence analysis, a putative proximal polyA signal sequence just upstream of the polyadenylation site of the 2.6 Kb sFlt1 transcript (11). To study the regulation of this short transcript, we first performed a polyadenylation assay to confirm the identity of the proximal poly(A) signal sequence. We cloned a genomic DNA fragment from FLT1 that included the putative proximal mRNA cleavage site into pCβS and introduced this construct into HTR-8/SVNeo, a trophoblast cell line (Figure 6A). Cleavage of the resulting chimeric transcript is directed by a polyA signal sequence within the cloned FLT1 fragment and was identified by an RPA using an antisense cRNA probe derived from the sFlt1 construct. RNA from cells transfected with the proximal sFlt1 construct sequence showed a strong signal at ∼170 nt, which is ∼20 nt downstream of the putative proximal sFlt1 poly(A) signal sequence, where we would predict RNA cleavage and polyadenylation would occur (Figure 6B). When the putative signal sequence ATTAAA was mutated, cleavage of the chimeric transcript was abolished confirming the identity of the proximal intronic sFlt1 polyA signal sequence (Figure 6C). This signal sequence is quite interesting and unusual as it contains the stop codon for intronic sFlt1, thus defining both the COO terminus of intronic sFlt1 and the 3′-end of this transcript.
Figure 6.
Identification of sFlt1 mRNA proximal intronic cleavage site with the reporter vector pCβS. (A) Schematic representation of the pCβS vector with sFlt1 proximal fragment inserted downstream of the CMV promoter to create pCβs/sFlt1 prox. (B and C) pCβS/sFlt1 prox or pCβs/sFlt1proxmut was transfected into HTR-8/SVNeo cells and then isolated mRNA was probed by RPA with a cRNA derived from the corresponding plasmid. A strong band in (B) lane 1 at ∼170 represents cleavage directed by the putative proximal intronic sFlt1 poly(A) signal sequence. Mutation of the proximal signal leads to loss of the primary cleavage at ∼170 in (C) lane 1. A weak band at ∼190 seen in lane 1 (C), probably represents cleavage directed by a cryptic poly(A) signal sequence. The signal sequence is boxed in sequence above (B and C). Digested RNA samples were run alongside yeast RNA (negative control) and (undigested) probe.
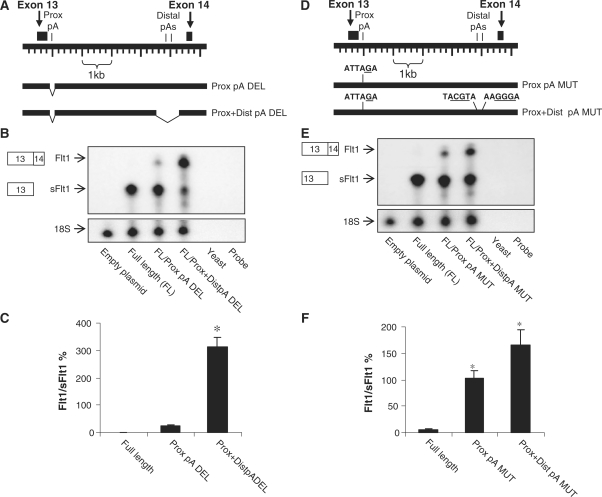
Having confirmed the proximal and distal polyA signal sequences, we then deleted the region containing the proximal polyA signal sequence alone (pA signal and downstream 131 nt) and in combination with the distal region (pA signals and adjacent 762 nt) to determine the effect on splicing of exon 13 to exon 14. We show that deletion of the proximal polyA signal sequence with adjacent elements had a small but significant effect to increase splicing of exon 13 to exon 14 (Figure 7A–C). When both proximal and distal signals and the adjacent regions are removed there is now a near complete shift in mRNA processing to splicing of exon 13 to exon 14. These data indicate that, at least under the conditions tested, the primary transcripts of FLT1 are preferentially processed to intronic sFlt1 because of positive regulatory elements within intron 13 that are clustered around the poly(A) signal sequences.
Figure 7.
Regions containing intronic poly(A) signal sequences regulate relative abundance of Flt1. (A and D) Schematic representation of human FLT1 gene in the region of exons 13 and 14. The relative position of the deletions (A) or mutations (D) are shown. (B and E) RPA demonstrating relative abundance of processed sFlt1 and processed Flt1 in cells transfected with Flt1 minigene constructs. The full-length construct leads primarily to processed sFlt1, and deletions (B) or mutations (E) of the proximal poly(A) alone or together with distal poly(A) increases the abundance of processed Flt1. (C) Pooled quantitated data with Flt1 expressed as a ratio of sFlt1 demonstrates that deletion of both the proximal and distal pA region robustly stimulates splicing. n = 3, mean ± SEM, P < 0.005, ANOVA by ranks, *P < 0.05 compared to full length. (F) Pooled quantitated data with Flt1 expressed as a ratio of sFlt1 demonstrates that selective mutation of the proximal pA alone or with distal pA stimulates splicing. n = 3, mean ± SEM, P < 0.005, ANOVA, *P < 0.05 compared to full length.
To specifically evaluate the role of sFltl polyA signal sequences in regulating exon 13 to exon 14 splicing, we introduced nucleotide substitutions into the proximal and distal poly(A) signal sequences while leaving adjacent elements intact within the full-length pL53In/Flt1 construct. Our data shows that selective mutation of the proximal polyA signal sequence increases exon 13 to exon 14 splicing and that mutation of both proximal and distal polyA signal sequences together further increases splicing (Figure 7D–F). These data indicate that the presence of intronic polyA signal sequences inhibits splicing and favors intronic sFlt1 processing. However, despite mutation of all known intronic polyA signal sequences, there is sufficient sFlt1 processing which suggests that there may be cryptic polyA signal sequences that still direct RNA processing to intronic sFlt1. These cryptic polyA signal sequences must be near the three known pA signal sequences as deletion of both proximal and distal pA signal sequences and sequence adjacent is sufficient to direct RNA processing to splicing (Figure 7B and C). We have no reason to believe that these cryptic splice sites operate normally or are biologically relevant as we did not find any other endogenous pA site usage within intron 13 by 3′ RACE and by RPA nor did we did find evidence of other pA site usage in EST databases (11).
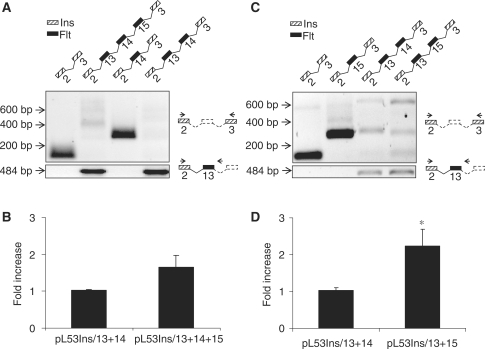
Our data thus far demonstrates that cis-elements within intron 13 inhibit splicing of exon 13 to exon 14 and thus the synthesis of full-length Flt1 as well as other sFlt1 transcripts. To determine if downstream exons influence intronic polyadenylation and processing to sFlt1, we created minigene constructs with combinations of exons 13, 14 and 15 along with intervening sequence and measured processed transcripts by qRT–PCR in JEG-3 and COS-7 cells. Following transfection, the spliced transcript was amplified by primers in the flanking exons 2 and 3 of insulin while the chimeric transcript that reads into intron 13 without splicing downstream was amplified by a forward primer within insulin exon 2 and a reverse primer within Flt1 intron 13. We demonstrate that inclusion of exon 13 with adjacent intron 13 inhibits splicing downstream, seen as a poorly amplified PCR product (Figure 8A, lanes 2 and 4, upper panel). Similar data is obtained even if exon 15 is substituted for exon 14 where upstream intron 13 sequences inhibit splicing (Figure 8C, lanes 3 and 4, upper panel). Although minigene constructs that include exon 13 and intron 13 inhibit splicing downstream, these constructs can fully support the alternate processing of sFlt1 as confirmed by the amplification of an intronic sFlt1 product wherever exon 13 and adjacent intron is present (Figure 8A and C, lower panel). Exons 14 and 15 are intrinsically capable of supporting splicing in these minigene constructs as a single robust spliced product that includes exon 14 or exon 15 is seen when these were tested them without intron 13 (Figure 8A and C). Furthermore, we demonstrate that the inclusion of exon 15 has a modest stimulatory effect on the abundance of processed sFlt1 (Figure 8B and D). Qualitatively similar data was obtained in COS-7 cells (data not shown). We conclude that the strength of the intronic poly(A) signal sequence and adjacent cis elements and that of trans-acting factors that direct mRNA cleavage and polyadenylation are the primary determinants of the relative ratio of intronic sFlt1 to Flt1.
Figure 8.
Effect of downstream exons on processing to sFlt1. A series of minigene constructs containing exons 13, 14 and 15 with intervening sequence in various combinations were transfected into JEG-3 cells and Flt1 splicing, and sFlt1 processing were analyzed by qRT–PCR. (A and C) Products of PCR reactions analyzed by gel electrophoresis. Schematic representation above each lane demonstrates sequences within minigene construct and schematic to the right indicates the position of primers used. When exon 13 and intron 13 sequences are present, splicing downstream is inhibited with multiple products of low abundance seen (upper portion of A and C). Transfected minigenes are however efficiently processed to sFlt1 (lower portion of A and C) when exon 13 and intron 13 are present. (B and D) Effect of exon 15 on sFlt1 processing compared to exon 14. Exon 15 significantly increases processing to sFlt1.
DISCUSSION
Angiogenesis and vasculogenesis require the carefully coordinated, spatially directed, elaboration of pro- and anti-angiogenic factors in a tissue and organ-specific fashion. The angiogenic growth factors signal via their cognate receptors expressed on the surface of target cells. One of these growth factor receptors, Flt1, is co-expressed with a soluble receptor, sFlt1, which binds VEGF and PlGF with equal affinity and can effectively regulate the free or active ligand in the extracellular milieu. When expressed in excess of the full-length cell surface receptor, sFlt1 can neutralize the effect of VEGF both locally and in distant sites such as the glomerulus. We have previously demonstrated that sFlt1 is produced in greater excess compared to Flt1 in cytotrophoblasts and in the placenta under basal conditions (11,14). We and others have identified multiple sFlt1 transcripts, including three transcripts that utilize intronic polyadenylation signal sequences in intron 13 to create a composite 3′-terminal exon and others that splice normally from exon 13 to exon 14 and then use a polyA signal within intron 14 or within alternate terminal exons 15a and 15b (11,13). We now demonstrate that activation of PKC in vascular endothelial cells and induction by hypoxia in trophoblasts leads to a robust and disproportionate increase in the intron 13 form of sFlt1 compared to Flt1. This prompted us to examine the regulation of this intronic form of sFlt1.
We proceeded to define regulatory elements within the Flt1 gene that regulates the abundance of intronic sFlt1 compared to all other Flt1/sFlt1 transcripts. Cis-acting factors that may regulate the processing of intronic sFlt1 include the number and strength of poly(A) signal sequences for sFlt1 and/or the relative distance between the sFlt1 cleavage sites and the downstream exon 14. On the other hand, regulation of spliced Flt1 expression may be dictated by the strength of the 5′ and 3′ splice sites that permit splicing of exon 13 to exon 14 or exon 14 to exon 15 and/or the presence of an exonic splicing silencer (ESS) within exon 13 or a downstream exon. Cis-elements that may simultaneously and reciprocally regulate the abundance of intronic sFlt1 and spliced ‘Flt1’ include strong poly(A) signal sequences within intron 13. Using a combination of methods, we conclude that the primary determinants of the relative ratio of intronic sFlt1 to spliced ‘Flt1’ are the intronic poly(A) signal sequences and adjacent cis elements, although cis-elements in or adjacent to downstream exons may also contribute. A review of intron 13 sequence across species using the ECR browser and rVista (http://rvista.dcode.org) and megaBlast (http://www.ncbi.nlm.nih.gov/genome/seq/BlastGen/BlastGen.cgi?taxid = 9606) demonstrates that there is a high degree of conservation of cis-elements including proximal and distal polyA signal sequences from monodelphis to Homo sapiens (Table 2). Although intronic sFlt1 is also expressed in avians, the only sequenced sFlt1 transcript, in chickens, appears to have just the proximal signal sequence. The later appearance of the distal intronic polyA signal sequences with its subsequent fixation in the genome implies that the distal signals provided a strong survival advantage for the species.
Table 2.
Conservation of distal poly(A) signal sequences A2 and A4 and degree of identity with the Flt1 region tested in Figure 5 using the Blastn program against reference genomic sequence of various mammalian species
| Species | A4 | A2 | Identity (%) |
|---|---|---|---|
| Pan troglodytes | + | + | 99 |
| Macaca mulatta | + | + | 96 |
| Canis familiaris | + | + | 83 |
| Equus caballus | + | + | 85 |
| Bos taurus | + | + | 77 |
| Mus musculus | + | + | 51.4 |
| Monodelphis domestica | + | + | 50.5 |
The findings that we report here and our previous studies demonstrate that sFlt1 is expressed at far greater abundance in CTB compared to Flt1 (12). In the current study, we use a minigene construct where exon 13 and 14 and the intervening sequence were tested to identify cis-elements within intron 13 that reciprocally regulate the abundance of intronic sFlt1 and spliced Flt1. In the native gene, there are likely to be additional cis-regulatory elements and trans-acting factors that determine intronic polyadenylation versus splicing of exon 13 to exon 14 and beyond. While Flt1 is expressed in relatively lower abundance in CTB, at least one other transcript that requires splicing of exon 13 to exon 14, sFlt1-e15a, is expressed at high levels. A simple competition between intronic poly(A) signal sequences and splice donor or acceptor sites in exon 13 or 14 does not fully explain the relatively high abundance of both sFlt1-i13 and sFlt1-e15a. There may be, for example, specific repression of splice sites downstream of exon 15a that allows both intronic and spliced forms of sFlt1 to be expressed at high levels without correspondingly high levels of expression of Flt1. Minigene constructs that include more downstream exons and chromatin immunoprecipitation analysis of splice site occupancy may provide additional information on physiological regulation of Flt1 gene expression.
Large-scale computational analysis of the human genome has revealed that alternate polyadenylation events occur in over 50% of known human genes (21). The pattern of upstream polyadenylation that we describe here arises from polyadenylation signal sequences within intron 13 that convert an internal exon (exon 13) to a composite 3′-terminal exon (18,22). This composite terminal exon leading to the classic intronic sFlt1 transcript and the resulting protein isoform has been conserved from chicken to human. Generally, the features associated with composite terminal exons include large introns, strong polyA signal sequences and weak 5′ skipped splice sites with the median distance between the composite exon polyA site and the skipped splice site between 238 and 355 nt (23). Although the first polyA signal sequence is 101 nt from the 5′ skipped splice site, unusually, the more robust polyA signal sequence is found >4100 nt away from the 5′ skipped splice site. As expected, one of the distal polyA signal sequences is the strong classic sequence, (AATAAA) although the 5′ splice site is also strong (GAG|GTGAGC) with divergent nt only at −3 and +6 from the consensus MAG|GTRAGT. A recent analysis of the human transcriptome demonstrated that 80% of tandem polyA signal sequences show tissue-specific regulation and it is possible that there are tissue-specific differences in utilization of the proximal and distal intronic sFlt1 pA signal sequences; this may merit future study (24).
SUPPLEMENTARY DATA
Supplementary Data are available at NAR Online.
FUNDING
O’Brien Kidney Disease Center (DK52617); New Directions Grant from the American Society of Nephrology; VA Merit Review Award; the National Institutes of Health (HL71664). Funding for open access charge: National Institutes of Health.
Conflict of interest statement. None declared.
Supplementary Material
ACKNOWLEDGEMENTS
We thank Harald Konig for the plasmid pL53In, David Fritz for the plasmid pCßS, Charles Graham for the HTR-8/SVNeo cell line, Edwin Ades for the HMEC-1 cell line and Janet Andrews for help with cytotrophoblast isolation. We thank the University of Iowa DNA Core facility for services provided.
REFERENCES
- 1.Cross MJ, Dixelius J, Matsumoto T, Claesson-Welsh L. VEGF-receptor signal transduction. Trends Biochem. Sci. 2003;28:488–494. doi: 10.1016/S0968-0004(03)00193-2. [DOI] [PubMed] [Google Scholar]
- 2.Tammela T, Enholm B, Alitalo K, Paavonen K. The biology of vascular endothelial growth factors. Cardiovasc. Res. 2005;65:550–563. doi: 10.1016/j.cardiores.2004.12.002. [DOI] [PubMed] [Google Scholar]
- 3.Roskoski R., Jr VEGF receptor protein-tyrosine kinases: structure and regulation. Biochem. Biophys. Res. Commun. 2008;375:287–291. doi: 10.1016/j.bbrc.2008.07.121. [DOI] [PubMed] [Google Scholar]
- 4.Ambati BK, Nozaki M, Singh N, Takeda A, Jani PD, Suthar T, Albuquerque RJC, Richter E, Sakurai E, Newcomb MT, et al. Corneal avascularity is due to soluble VEGF receptor-1. Nature. 2006;443:993. doi: 10.1038/nature05249. [DOI] [PMC free article] [PubMed] [Google Scholar]
- 5.Chappell JC, Taylor SM, Ferrara N, Bautch VL. Local guidance of emerging vessel sprouts requires soluble Flt-1. Dev. Cell. 2009;17:377–386. doi: 10.1016/j.devcel.2009.07.011. [DOI] [PMC free article] [PubMed] [Google Scholar]
- 6.Maynard SE, Min JY, Merchan J, Lim KH, Li J, Mondal S, Libermann TA, Morgan JP, Sellke FW, Stillman IE, et al. Excess placental soluble fms-like tyrosine kinase 1 (sFlt1) may contribute to endothelial dysfunction, hypertension, and proteinuria in preeclampsia. J. Clin. Invest. 2003;111:649–658. doi: 10.1172/JCI17189. [DOI] [PMC free article] [PubMed] [Google Scholar]
- 7.Sugimoto H, Hamano Y, Charytan D, Cosgrove D, Kieran M, Sudhakar A, Kalluri R. Neutralization of circulating vascular endothelial growth factor (VEGF) by anti-VEGF antibodies and soluble VEGF receptor 1 (sFlt-1) induces proteinuria. J. Biol. Chem. 2003;278:12605–12608. doi: 10.1074/jbc.C300012200. [DOI] [PubMed] [Google Scholar]
- 8.Suzuki H, Ohkuchi A, Matsubara S, Takei Y, Murakami M, Shibuya M, Suzuki M, Sato Y. Effect of recombinant placental growth factor 2 on hypertension induced by full-length mouse soluble fms-like tyrosine kinase 1 adenoviral vector in pregnant mice. Hypertension. 2009;54:1129–1135. doi: 10.1161/HYPERTENSIONAHA.109.134668. [DOI] [PubMed] [Google Scholar]
- 9.Kendall RL, Thomas KA. Inhibition of vascular endothelial cell growth factor activity by an endogenously encoded soluble receptor. Proc. Natl Acad. Sci. USA. 1993;90:10705–10709. doi: 10.1073/pnas.90.22.10705. [DOI] [PMC free article] [PubMed] [Google Scholar]
- 10.Kondo K, Hiratsuka S, Subbalakshmi E, Matsushime H, Shibuya M. Genomic organization of the flt-1 gene encoding for vascular endothelial growth factor (VEGF) receptor-1 suggests an intimate evolutionary relationship between the 7-Ig and the 5-Ig tyrosine kinase receptors. Gene. 1998;208:297–305. doi: 10.1016/s0378-1119(98)00006-7. [DOI] [PubMed] [Google Scholar]
- 11.Thomas CP, Andrews JI, Liu KZ. Intronic polyadenylation signal sequences and alternate splicing generate human soluble Flt1 variants and regulate the abundance of soluble Flt1 in the placenta. FASEB J. 2007;21:3885–3895. doi: 10.1096/fj.07-8809com. [DOI] [PubMed] [Google Scholar]
- 12.Sela S, Itin A, Natanson-Yaron S, Greenfield C, Goldman-Wohl D, Yagel S, Keshet E. A novel human-specific soluble vascular endothelial growth factor receptor 1. Cell type-specific splicing and implications to vascular endothelial growth factor homeostasis and preeclampsia. Circ. Res. 2008 doi: 10.1161/CIRCRESAHA.108.171504. CIRCRESAHA. 108.171504. [DOI] [PubMed] [Google Scholar]
- 13.Heydarian M, McCaffrey T, Florea L, Yang Z, Ross MM, Zhou W, Maynard SE. Novel splice variants of sFlt1 are upregulated in preeclampsia. Placenta. 2009;30:250–255. doi: 10.1016/j.placenta.2008.12.010. [DOI] [PubMed] [Google Scholar]
- 14.Thomas CP, Andrews JI, Raikwar NS, Kelley EA, Herse F, Dechend R, Golos TG, Liu KZ. A recently evolved novel trophoblast-enriched sFlt1 variant is upregulated in hypoxia and in preeclampsia. J. Clin. Endocrinol. Metab. 2009;94:2524–2530. doi: 10.1210/jc.2009-0017. [DOI] [PMC free article] [PubMed] [Google Scholar]
- 15.Zhou Y, McMaster M, Woo K, Janatpour M, Perry J, Karpanen T, Alitalo K, Damsky C, Fisher SJ. Vascular endothelial growth factor ligands and receptors that regulate human cytotrophoblast survival are dysregulated in severe preeclampsia and hemolysis, elevated liver enzymes, and low platelets syndrome. Am. J. Pathol. 2002;160:1405–1423. doi: 10.1016/S0002-9440(10)62567-9. [DOI] [PMC free article] [PubMed] [Google Scholar]
- 16.Tsatsaris V, Goffin F, Munaut C, Brichant J-F, Pignon M-R, Noel A, Schaaps J-P, Cabrol D, Frankenne F, Foidart J-M. Overexpression of the soluble vascular endothelial growth factor receptor in preeclamptic patients: pathophysiological consequences. J. Clin. Endocrinol. Metab. 2003;88:5555–5563. doi: 10.1210/jc.2003-030528. [DOI] [PubMed] [Google Scholar]
- 17.Ahmad S, Ahmed A. Elevated placental soluble vascular endothelial growth factor receptor-1 inhibits angiogenesis in preeclampsia. Circ. Res. 2004;95:884–891. doi: 10.1161/01.RES.0000147365.86159.f5. [DOI] [PubMed] [Google Scholar]
- 18.Edwalds-Gilbert G, Veraldi K, Milcarek C. Alternative poly(A) site selection in complex transcription units: means to an end? Nucleic Acids Res. 1997;25:2547–2561. doi: 10.1093/nar/25.13.2547. [DOI] [PMC free article] [PubMed] [Google Scholar]
- 19.Nelson DM, Johnson RD, Smith SD, Anteby EY, Sadovsky Y. Hypoxia limits differentiation and up-regulates expression and activity of prostaglandin H synthase 2 in cultured trophoblast from term human placenta. Am. J. Obstet. Gynecol. 1999;180:896. doi: 10.1016/s0002-9378(99)70661-7. [DOI] [PubMed] [Google Scholar]
- 20.Sayegh R, Auerbach SD, Li X, Loftus R, Husted R, Stokes JB, Thomas CP. Glucocorticoid induction of epithelial sodium channel expression in lung and renal epithelia occurs via trans-activation of a hormone response element in the 5′ flanking region of the human epithelial sodium channel α subunit gene. J. Biol. Chem. 1999;274:12431–12437. doi: 10.1074/jbc.274.18.12431. [DOI] [PubMed] [Google Scholar]
- 21.Tian B, Hu J, Zhang H, Lutz CS. A large-scale analysis of mRNA polyadenylation of human and mouse genes. Nucleic Acids Res. 2005;33:201–212. doi: 10.1093/nar/gki158. [DOI] [PMC free article] [PubMed] [Google Scholar]
- 22.Zhang H, Lee J, Tian B. Biased alternative polyadenylation in human tissues. Genome Biol. 2005;6:R100. doi: 10.1186/gb-2005-6-12-r100. [DOI] [PMC free article] [PubMed] [Google Scholar]
- 23.Tian B, Pan Z, Lee JY. Widespread mRNA polyadenylation events in introns indicate dynamic interplay between polyadenylation and splicing. Genome Res. 2007;17:156–165. doi: 10.1101/gr.5532707. [DOI] [PMC free article] [PubMed] [Google Scholar]
- 24.Wang ET, Sandberg R, Luo S, Khrebtukova I, Zhang L, Mayr C, Kingsmore SF, Schroth GP, Burge CB. Alternative isoform regulation in human tissue transcriptomes. Nature. 2008;456:470–476. doi: 10.1038/nature07509. [DOI] [PMC free article] [PubMed] [Google Scholar]
Associated Data
This section collects any data citations, data availability statements, or supplementary materials included in this article.


