Abstract
Context
Although recent trends in obesity have been well documented, generational patterns of obesity from early childhood through adulthood across birth cohorts, which account for the recent epidemic of childhood obesity, have not been well described. Such trends may have implications for the prevalence of obesity-associated conditions among population subgroups, including type 2 diabetes.
Objective
Our objective was to evaluate trajectories of obesity over the life course for the US population, overall and by gender and race.
Design, Setting, and Participants
We conducted an age, period, and birth cohort analysis of obesity for US individuals who participated in the National Health and Nutrition Examination Surveys (1971-2006).
Main Outcome Measures
Obesity was defined as a body mass index ≥ 95th percentile for individuals aged 2-16 years or ≥ 30 kg/m2 among individuals older than 16 years. Age was represented by the age of the individual at each NHANES survey, period was defined by the year midpoint of each survey, and cohort was calculated by subtracting age from period.
Results
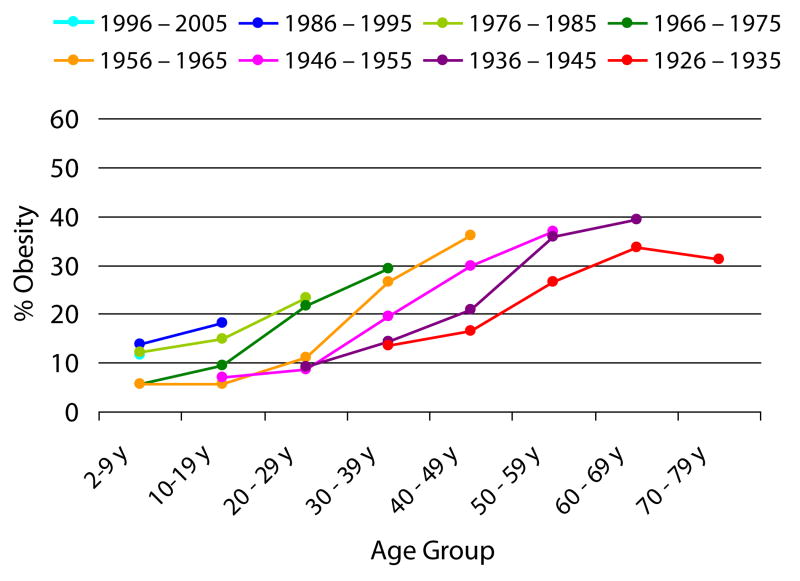
Recent birth cohorts are becoming obese in greater proportions for a given age, and are experiencing a greater duration of obesity over their lifetime. For example, whereas the 1966-75 and 1976-85 birth cohorts had reached an estimated obesity prevalence of at least 20% by 20-29 years of age, this level was only reached by 30-39 years for the 1946-55 and 1956-65 birth cohorts, by 40-49 years for the 1936-45 birth cohort, and by 50-59 years of age for the 1926-35 birth cohort. Trends are particularly pronounced for female compared with male, and black compared with white cohorts.
Conclusions
The increasing cumulative exposure to excess weight over the lifetime of recent birth cohorts will likely have profound implications for future rates of type 2 diabetes, and mortality within the US population.
Keywords: obesity, trends, birth cohort, childhood, life course
Background
Over the last 30 years, the prevalence of obesity has increased dramatically in the US,(1, 2) with a doubling of rates among US adults, and a tripling of rates among US children. It is well documented that obesity is associated with increased rates of cardiovascular disease,(3) type 2 diabetes,(4) and premature mortality,(5) and has also been linked with impairments in quality of life and a greater likelihood of disability.(6, 7) Experts have therefore suggested that there will be profound generational consequences of the obesity epidemic in the US.(8)
The acceleration of obesity trends among the US pediatric population is of particular concern, as studies have shown that body mass index (BMI) usually increases with age,(9) and obesity during childhood is associated with persistence of obesity into adulthood.(10) To date, current projected rates of type 2 diabetes burden,(11) or reductions in life expectancy(8) as a consequence of the obesity epidemic, have been studied using period estimates of obesity among adults only, which does not account for accelerating obesity trends within the youngest generations. Because younger generations may be experiencing progressive increases in obesity prevalence over their lifetime, this may have implications for an unprecedented acceleration of type 2 diabetes and overall mortality in the population. Therefore, a more comprehensive evaluation of patterns of obesity prevalence over the life course, from early childhood through late adulthood, would be beneficial for understanding the full impact of the US obesity epidemic on future estimates of obesity-related morbidity and mortality.
Our objective, therefore, was to evaluate trajectories of obesity over the life course for the US population. We hypothesized that recent birth cohorts of Americans are manifesting a higher obesity prevalence much earlier in the life course. Identification of these trends is critical for making accurate projections of future chronic disease risk and life expectancy in the US.
Methods
Data Source
For our analyses, we used the National Health and Nutrition Examination Surveys (NHANES),(12) which are serial cross-sectional surveys conducted on nationwide probability samples of the non-institutionalized civilian population during the following periods: 1971-1975, 1976-1980, 1988-1994, 1999-2000, 2001-2002, 2003-2004, 2005-2006. NHANES has a stratified multistage probability sampling design, oversampling certain subpopulations (i.e. adolescents and minority groups) to provide reliable statistical estimates, thus requiring sampling weights to be applied to the population estimates to allow generalizibility of results.
Study Definitions
Whereas obesity among children aged 2-19 years is currently defined by BMI percentile cutoffs based on the CDC 2000 Growth Charts (BMI ≥ 95th percentile),(13) obesity among adults is defined by absolute BMI cutoffs (BMI ≥ 30 kg/m2), resulting in a discontinuity in the categorizations during the transition from adolescence to adulthood. For example, a 19 year old girl with a BMI of 30 would be classified as not obese using the pediatric standards, as the 95th% BMI threshold is 31 kg/m2, but she would be classified as obese using the adult standards. Because most children have completed their linear growth by age 17, and the 95th percentile crosses the adult BMI threshold of 30 by age 17 for boys and girls on the CDC growth charts, we defined obesity in this study as a BMI ≥ 95th percentile for individuals aged 2-16 years or ≥ 30 kg/m2 for individuals 17 years or older.
Study Design and Sample
We conducted an age-period-birth cohort (APC) analysis of obesity prevalence over the life course for the US population. Although age-period-cohort analyses are typically conducted using longitudinal data, we are unaware of nationally representative longitudinal data in the US with measured heights and weights across a wide span of age groups and birth cohorts. Different individuals are sampled at each NHANES survey, therefore we created birth cohorts across surveys to represent actual birth cohorts. We limited our study population to individuals from birth cohorts 1926 and older who were 2-79 years of age. Individuals were grouped into 10 year age groups and 10 year birth cohorts. We note that only individuals up to 74 years of age were included in the NHANES surveys conducted in 1971-1975 and 1976-1980.
Age-Period-Cohort Definitions
With APC analyses, the outcome of interest, obesity prevalence, is evaluated according to three different dimensions of time. Age represents the age of individuals, period represents historical time, and birth cohort represents the year in which individuals were born. These three dimensions of time are distinct, but they are not independent because they are related by the equation: Birth cohort=Period-Age.
For this analysis, age was represented by the age of the individual at each NHANES survey. NHANES does not provide the date of examination for participants, therefore period was defined either by the midpoint (NHANES 1971-1975, 1976-1980, 1988-1994) or the first year for each of the 2 year surveys. Finally, birth cohort was calculated by subtracting age from period. Because some survey periods could span up to 6 years, we also assessed cohort trends where we defined period as either the first or last year of the surveys; these analyses revealed similar trends (data not shown).
Data Analysis
We calculated prevalence of obesity for the overall sample population at each of the surveys. Sampling weights for each survey period, provided with the NHANES data sets, were used to adjust prevalence estimates for the complex multi-cluster sample design and for oversampling and nonresponse. Taylor series linearization was used for variance estimation of obesity prevalence estimates (standard error estimates are shown in the appendix), consistent with the complex sampling design.(14)
As in traditional APC analyses, we evaluated obesity prevalence according to 2 of 3 dimensions of time. First we evaluated period trends by age, estimating obesity prevalence across surveys for specific age groups. We then evaluated period trends by cohort, estimating obesity prevalence across surveys for specific birth cohorts. Because BMI generally increases with age over the life course, it is difficult to fully evaluate cohort trends in obesity without adjustment for age. Therefore, we evaluated age trends by birth cohort, estimating obesity prevalence across age groups for specific birth cohorts over the life course overall, and for each gender and race separately. We also evaluated trends by gender and race subgroups; however we do not report these trends as the standard error estimates were high. An age trend by birth cohort analysis of BMI was also conducted for the overall population.
For the age trend by birth cohort analyses, individuals from specific age and cohort groups were sometimes represented within two different surveys. Because each NHANES survey has its own unique survey weights, estimates from each survey could not be merged. Therefore, we calculated a weighted proportion based on the obesity prevalence and number of individuals represented for each survey, using the appropriate sampling weights. For example, the weighted obesity prevalence for individuals born during 1966-1975 at age 10-19 years was 8.5% and 10.3% for NHANES 1976-1980 and 1988-1994, respectively, out of an estimated total of 9,885,875 and 13,600,000 individuals from their respective age and birth cohort groups. We then calculated the weighted proportion as follows: [(9,885,875*8.5%) + (13,600,000*10.3%)]/(9,885,875+13,600,000)= 9.5%. When estimates of obesity prevalence for specific subgroups had to be combined, independence was assumed for the standard error calculations.
Absolute increases in obesity prevalence were calculated for the age trend by birth cohort analyses. The percentage increase between decades of life was calculated by subtracting obesity prevalence of a specific decade of life from the previous decade of life.
Because the inherent intent of an age-period-birth cohort analysis is to identify and describe patterns and trends and not to test specific hypotheses, we did not perform statistical comparisons of specific cohorts or age groups. Furthermore with this study we were not attempting to estimate the relative effects of each of these three factors on obesity prevalence. Standard errors are included in tables as part of the appendix. Finally, we note that in the subanalysis of age by cohort trends for blacks, because the standard error estimate for blacks from cohort 1926-1935 in the 30-39 year age group was particularly high (Table 6, Appendix), this point was not included in the age by birth cohort graph for blacks.
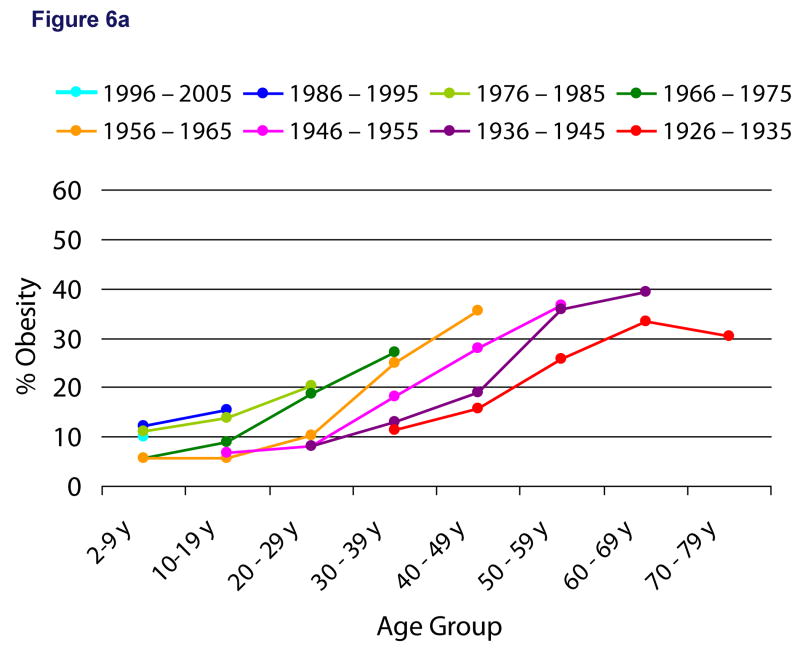
Table 6. Age trends in obesity prevalence by birth cohort for whites (1971-2006) (% (standard error)).
| 2-9 y | 10-19 y | 20 – 29 y | 30 - 39 y | 40 - 49 y | 50 - 59 y | 60 - 69 y | 70 - 79 y | |||||||||
|---|---|---|---|---|---|---|---|---|---|---|---|---|---|---|---|---|
| 1996 – 2005 | 10.0% | (1.1%) | ||||||||||||||
| 1986 – 1995 | 12.1% | (1.2%) | 15.6% | (1.2%) | ||||||||||||
| 1976 – 1985 | 11.1% | (1.5%) | 13.8% | (0.9%) | 20.4% | (1.8%) | ||||||||||
| 1966 – 1975 | 5.6% | (0.4%) | 9.0% | (1.1%) | 18.6% | (1.7%) | 27.1% | (1.8%) | ||||||||
| 1956 – 1965 | 5.8% | (1.2%) | 5.6% | (0.4%) | 10.2% | (1.3%) | 25.0% | (1.5%) | 35.6% | (1.4%) | ||||||
| 1946 – 1955 | 6.8% | (1.6%) | 8.2% | (0.6%) | 18.3% | (1.6%) | 28.0% | (1.9%) | 36.6% | (1.5%) | ||||||
| 1936 – 1945 | 8.1% | (1.5%) | 12.9% | (0.8%) | 18.9% | (1.4%) | 35.8% | (2.4%) | 39.5% | (1.6%) | ||||||
| 1926 – 1935 | 11.5% | (1.8%) | 15.7% | (1.0%) | 25.9% | (2.0%) | 33.5% | (1.4%) | 30.4% | (1.6%) | ||||||
Results
The demographic characteristics of the sample populations for each of the NHANES surveys are shown in table 1. This serial cross-sectional comparison over time highlights the previously well described relative aging of the US population and the proportional decrease in children and adolescents over the survey periods.
Table 1. Characteristics of sample. Weighted percentage (unweighted n).
| Survey | NHANES I (1971-1975) | NHANES II (1976-1980) | NHANES III (1988-1994) | NHANES (1999-2000) | NHANES (2001-2002) | NHANES (2003-2004) | NHANES (2005-2006) |
|---|---|---|---|---|---|---|---|
| N(unweighted) | 19975 | 19118 | 26074 | 7891 | 8403 | 8007 | 8249 |
| Age distribution | |||||||
| 2 - 9 years | 15.1%(3674) | 15.7%(4172) | 12.9%(6584) | 13.1%(1451) | 11.9%(1621) | 12.0%(1509) | 11.5%(1712) |
| 10 – 19 years | 21.2%(3367) | 20.8%(3159) | 15.1%(4227) | 15.5%(2625) | 15.7%(2674) | 15.4%(2496) | 15.4%(2511) |
| 20 – 29 years | 16.5%(3101) | 17.7%(2558) | 16.1%(3349) | 14.5%(630) | 14.7%(754) | 13.8%(733) | 13.8%(780) |
| 30 – 39 years | 12.0%(2319) | 13.2%(1837) | 17.9%(3261) | 17.2%(678) | 15.4%(731) | 15.0%(684) | 14.4%(720) |
| 40 – 49 years | 12.2%(1954) | 10.8%(1456) | 14.1%(2581) | 15.0%(704) | 17.4%(853) | 16.6%(743) | 16.6% (803) |
| 50 – 59 years | 11.7%(1499) | 10.8%(1495) | 9.4%(1864) | 10.7%(544) | 12.5%(641) | 13.0%(568) | 13.8% (624) |
| 60 – 69 years | 8.5%(2595) | 8.2%(3301) | 8.6%(2353) | 8.5%(748) | 7.5%(660) | 8.2%(711) | 8.6% (645) |
| 70 – 79 years | 2.8%*(1466) | 2.8%*(1140) | 5.9%(1855) | 5.5%(511) | 4.9%(469) | 6.0%(563) | 5.9% (454) |
| Gender | |||||||
| Females | 51.1%(11441) | 49.9%(9694) | 50.5%(13514) | 50.1%(3905) | 50.2%(4174) | 50.1%(3932) | 49.9%(4053) |
| Race/ethnicity | |||||||
| White | 87.6%(15786) | 85.6%(16156) | - | - | - | - | - |
| Black | 11.4%(3970) | 11.8%(2546) | - | - | - | - | - |
| Non-Hispanic white | - | - | 73.0%(8814) | 68.0%(2540) | 69.0%(3387) | 69.6%(3170) | 68.3%(3026) |
| Non-Hispanic black | - | - | 12.3%(8095) | 12.0%(1940) | 12.2%(2235) | 12.5%(2290) | 12.5%(2318) |
| Mexican American | - | - | 6.2%(8018) | 7.7%(2758) | 8.5%(2170) | 9.2%(2029) | 9.4%(2230) |
| Other | 1.0%(219) | 2.6%(416) | 8.5%(1147) | 12.3%(653) | 10.3%(611) | 8.7%(518) | 9.8%(675) |
70-74 years
Period trends in obesity prevalence by age
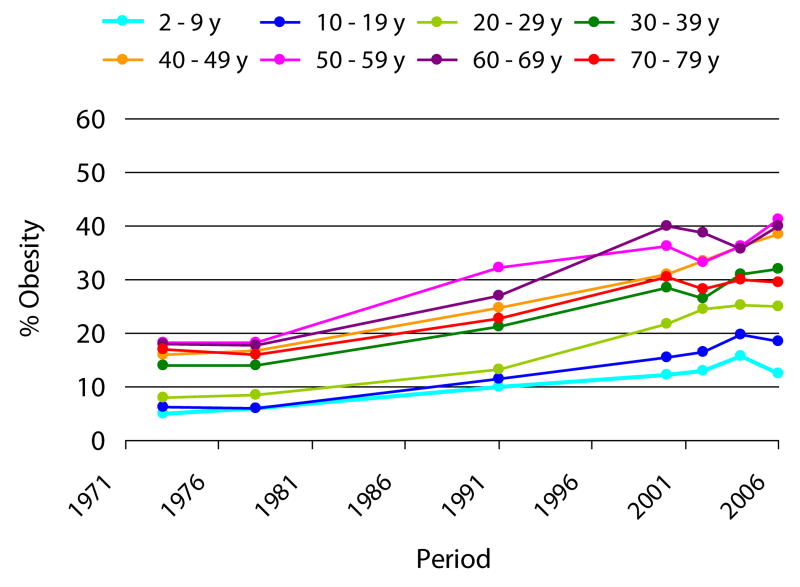
Period trends in obesity prevalence by age are shown in Figure 1. With the exception of the 70-79 year age group, absolute obesity prevalences were higher for older compared with younger individuals. There were increases in obesity prevalence across age groups between 1978 and 2000, reflecting the period effects of the obesity epidemic. However, after 2000, trends in obesity prevalence were less consistent across age groups.
Figure 1. Period trends in obesity prevalence by age group (1971-2006).
Period trends in obesity prevalence by birth cohort
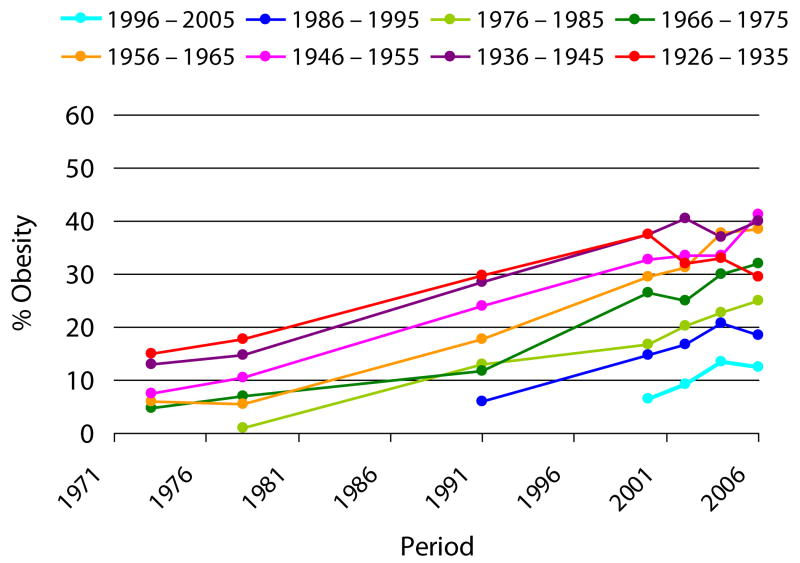
Period trends in obesity by birth cohort are shown in Figure 2. With the exception of the 1926 cohort, absolute obesity prevalences were higher for older compared with younger birth cohorts, reflecting the age effects of obesity, as the older cohorts consisted of adults, whereas the younger cohorts consisted of children. There were increases in obesity prevalence across birth cohorts between 1978 and 2000, again reflecting the period effects of the obesity epidemic. However, after 2000, trends in obesity prevalence across birth cohorts were less consistent.
Figure 2. Period trends in obesity prevalence by birth cohort (1971-2006).
Age trends in obesity prevalence by birth cohort
Age trends in obesity by birth cohort are shown in Figure 3. Recent birth cohorts are generally becoming obese in greater numbers at a given age, as indicated by the pattern of lines moving upwards, and are experiencing a greater duration of obesity over their lifetime, as indicated by the pattern of lines moving to the left. For example, whereas the 1966-75 and 1976-85 birth cohorts had already reached an estimated obesity prevalence of at least 20% by 20-29 years of age, this level was only reached by 30-39 years for the 1946-55 and 1956-65 birth cohorts, by 40-49 years for the 1936-45 birth cohort, and by 50-59 years of age for the 1926-35 birth cohort.
Figure 3. Age trends in obesity prevalence by birth cohort (1971-2006).
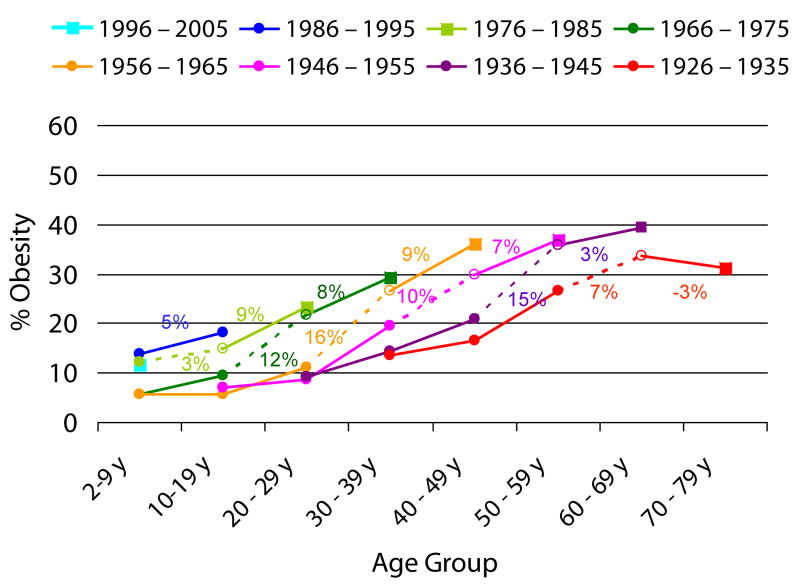
The absolute percentage increases in obesity prevalence leading to the previous and most recent decades of life are shown in Figure 4. The slopes of the penultimate (dotted) lines indicate large increases in obesity prevalence leading to the previous decade of life (open circles), reflecting the period effects of the obesity epidemic. In comparison, the percentage increases in obesity leading to the most recent decade of life (squares) were somewhat attenuated. For example, for the 1956-65 cohort, the absolute percentage increase in obesity leading to the previous decade of life was 16%, but was only 9% leading to the most recent decade of life. This trend was generally seen across all birth cohorts, with the exceptions of the 1976-85 cohort, for whom the absolute percentage increase in obesity leading to the most recent decade of life appeared to accelerate compared with the previous decade of life (9% vs 3%), and the 1926-35 cohort, for whom there was a decrease in obesity prevalence leading to the most recent decade of life.
Figure 4. Absolute increases in obesity prevalence by birth cohort (1971-2006).
Gender and Race Differences
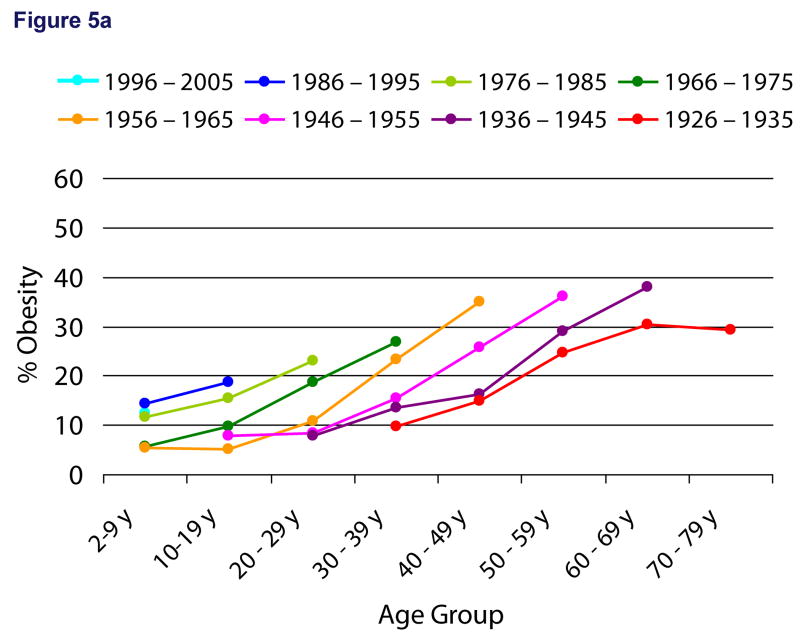
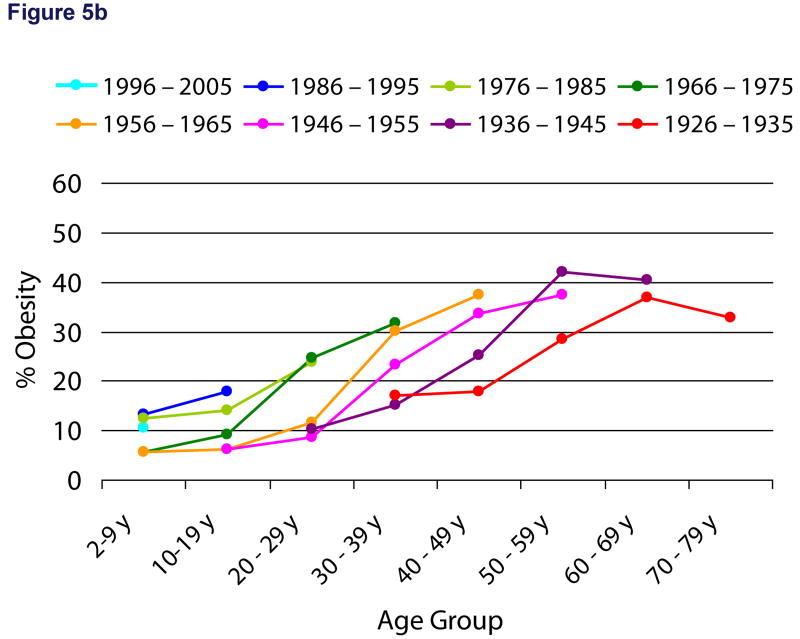
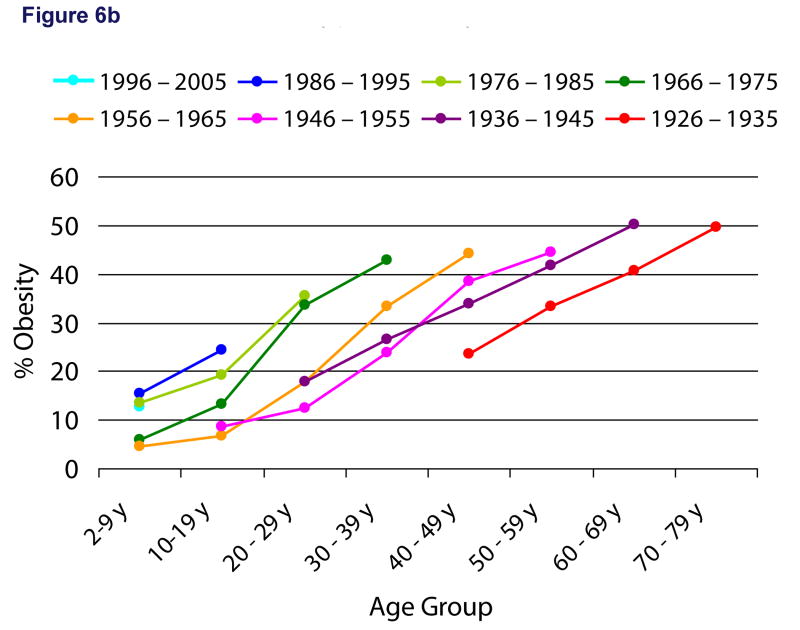
We found differences in age trends by birth cohort by gender (figures 5a and 5b) and race (figures 6a and 6b). Absolute obesity prevalences were higher for female cohorts compared with male cohorts, and for black cohorts compared with white cohorts. We also found gender and race differences with regard to the attenuation of obesity trends leading to the last decade of life. The slopes of the final lines leading to the last decade of life for each cohort were notably lower for females compared with males, and for whites compared with blacks. For example, the absolute percentage increase in obesity across cohorts was 4% for females vs. 7% for males, and 6% for whites vs. 10% for blacks.
Figure 5.
5a Age trends in obesity prevalence by birth cohort for males (1971-2006)
5b Age trends in obesity prevalence by birth cohort for females (1971-2006)
Figure 6.
6a Age trends in obesity prevalence by birth cohort for whites (1971-2006)
6b Age trends in obesity prevalence by birth cohort for blacks (1971-2006)
Age trends in BMI by birth cohort
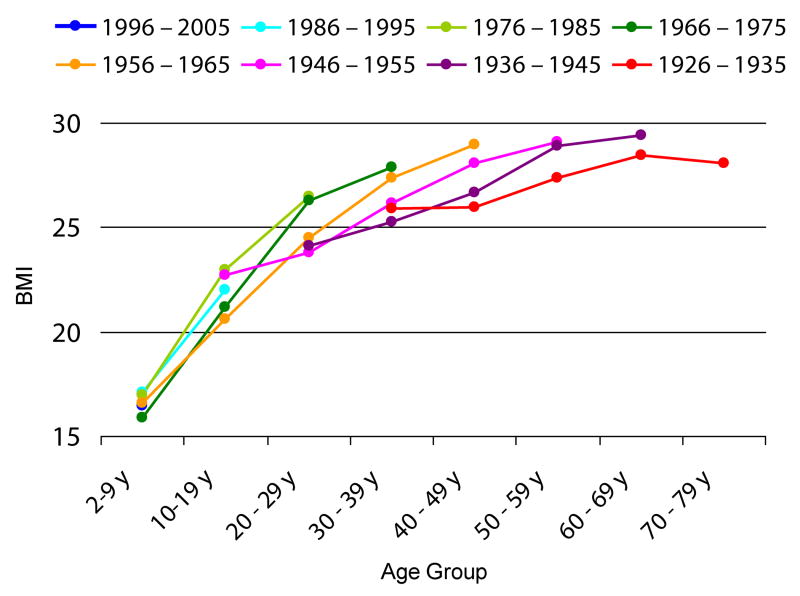
Age trends in BMI across birth cohorts are shown in Figure 7, demonstrating that similar patterns are generally seen for BMI as with obesity prevalence.
Figure 7. Age trends in BMI by birth cohort (1971-2006).
Discussion
Our period by age and period by birth cohort analyses reveal the extent to which the epidemic of obesity has reached across age groups and birth cohorts in the US, and our age group by birth cohort analysis illustrates the dramatic shift in patterns of obesity prevalence over the life course that have occurred related to increases in obesity among younger individuals in the population. Because recent cohorts of individuals are reaching a higher prevalence of obesity earlier in the life course, they are experiencing a greater cumulative exposure to excess weight over their lifetime, which will likely have profound implications for future rates of obesity-related chronic diseases and mortality within the US population.
In 2003, Narayan et al used a Markov chain model to project the estimated lifetime risk and mean age at diagnosis of type 2 diabetes in the US for individuals born in the year 1984-2000.(11) They estimated a lifetime risk of 32.8% and 38.5% of US males and females, with a mean age at diagnosis of type 2 diabetes ranging from 55.7-58.8 years depending on the age and gender group. Our results suggest that they underestimated future rates of type 2 diabetes, as they assumed constant age-specific rates of diabetes prevalence and incidence based on individuals from the 2000 National Health Interview Surveys, some of whom were from much older cohorts. For example, rates of diabetes among 50-59 year olds were based on individuals from the 1936 and 1926 cohorts, for whom obesity rates were substantially lower throughout the life course. The assumption by Narayan et al of constant rates therefore did not account for the increasing prevalence of obesity among younger individuals in the population.
Furthermore, the mean age of diagnosis of type 2 diabetes may be even younger than projected by Narayan et al, given that they did not account for the increasing duration of obesity over the life course occurring among younger cohorts. Independent of the severity of obesity, studies have shown that obesity duration is an important risk factor for type 2 diabetes,(15, 16) suggesting that a cumulative exposure to excess body weight may hasten the onset of type 2 diabetes among individuals. The increasing prevalence and duration of obesity occurring among the younger cohorts in the population may therefore lead to a shift in the epidemiology of type 2 diabetes within the population, with an earlier age of onset of type 2 diabetes during young or middle adulthood rather than later in adulthood. Such a shift will presumably have important consequences for future morbidity and mortality, independent of absolute increases in rates of type 2 diabetes, as an earlier age of onset of type 2 diabetes implies that individuals will have a longer duration of diabetes over their lifetime. This longer duration may accelerate rates of complications such as cardiovascular disease, retinopathy, and end stage renal disease within the population,(17, 18) with potential implications for estimates of future life expectancy in the US.
In 2005, Olshansky et al(8) made the provocative prediction that the epidemic of obesity would result in potential declines in US life expectancy in the 21st century. Using a life table approach, they calculated the reduction in death rates that would occur if all obese individuals in the US population had an optimal adult body weight (BMI=24), forecasting reductions in life expectancy of anywhere from one third to three fourths of a year. However, their assumptions about obesity prevalence were based on estimates from the period 1988-1994,(8) which represented just the midpoint of the obesity epidemic, and were based only on adults, the majority of whom were from much older birth cohorts (1885 to 1976). Therefore, their predictions likely represent an underestimate of reductions in life expectancy related to healthy versus obese BMI. The greater prevalence and duration of obesity seen among younger cohorts compared with older cohorts warrant further studies to better understand the future impact of these birth cohort trends on the age of onset and incidence of type 2 diabetes, other obesity-related chronic diseases, and overall life expectancy in the US population.
The Centers for Disease Control (CDC) recently reported no significant changes in obesity prevalence between 2003-2004 and 2005-2006 for both US children and adults,(19, 20) leading some to suggest that recent public health efforts may have been effective in “halting” further development of the epidemic. Their findings are consistent with our analyses at least for the older birth cohorts, given that we observed an attenuation of absolute percentage increases in obesity prevalence leading to the most recent decade of life compared with the previous decade of life. However, this attenuation was not seen for the more recent 1976-85 birth cohort; in fact there was an acceleration of obesity trends, between the transition from adolescence (10-19 years) to young adulthood (20-29 years). It has been hypothesized that adolescence is a critical period for development of obesity, which may be associated with greater risk for persistence of obesity and obesity-associated morbidity in adulthood.(21) Therefore, we speculate that long-term trends in obesity may be different for more recent cohorts.
However, even under the assumption that period trends in obesity are stabilizing across most birth cohorts, our life course approach places these trends in a different perspective. Even if the plateau in obesity prevalence persists beyond this 2-year period trend, because younger generations already are carrying a higher obesity prevalence as well as a longer duration of obesity for a given age compared with previous generations, this raises the question of whether “halting” or stabilizing the epidemic currently will be enough to change future rates of obesity-related morbidity and mortality among younger generations. Our findings suggest that initiatives must not only halt but actually reverse population trends in obesity in order to return risks of obesity-related complications to levels experienced by older generations.
The differences in age group by birth cohort obesity trends by race and gender have important implications for disparities in chronic disease over the life course. Improvements in obesity trends leading to the most recent decade of life were greater for white compared with black cohorts. Given that absolute obesity prevalences are already higher for black cohorts compared with white cohorts, such a trend may lead to further increases in the disproportionate burden of chronic disease among the black population in the US.(22)
Regarding gender differences, improvements in obesity trends leading to the most recent decade of life were greater for female compared with male cohorts. Therefore, although females have higher absolute obesity prevalence compared with males, US males may “catch-up” with their female same-age peers with regard to obesity prevalence. These recent race- and gender-specific trends will be critical for future projection of chronic disease rates and life expectancy.
Our study is novel, in that it evaluated age, period, and cohort trends in US obesity prevalence over the life course, from 2 through 79 years of age. We also looked at cohort trends in BMI, which were similar to the obesity trends, indicating that BMI distribution has shifted across the population, regardless of weight status. Wang et al recently performed a systematic review and meta-analysis of studies published on the obesity epidemic in the US, but only starting from 1990, and evaluated just period estimates of obesity prevalence, separately for children and adults.(23) Other studies have evaluated cohort trends in obesity, but have either exclusively focused on the elderly, with the 1956-1965 birth cohort as the youngest cohort of interest,(24) or predicted obesity rates for older adults.(25) Therefore, this is the first study to account for the potential effects of the childhood obesity epidemic on birth cohort differences in obesity over time. Other strengths include the use of nationally representative data, the availability of measured height and weight, and the ability to evaluate trends separately by gender and race.
Although we would like to evaluate birth cohort trends in obesity related complications, focusing in particular on the youngest US individuals, the current prevalence estimates of chronic disease in younger individuals are quite low; for example, the estimated prevalence of type 2 diabetes among US children and adolescents (0-19 years) is only 0.02%.(26) As a result, assessing these trends for younger individuals using NHANES would likely result in unreliable estimates. This is consistent with our hypothesis that the increasing duration and prevalence of obesity in the childhood population will not have implications for development of chronic obesity-related diseases until decades later in life, as these children age into adulthood.(27)
We acknowledge that there are limitations to our study. The trends we identified must be cautiously interpreted given that the birth cohorts that we created did not consist of the same individuals across all waves. For example, it is possible that obesity prevalence was underestimated among the older age groups (60-69 years and 70-79 years), given the known association between obesity and excess mortality.(5) Although age period cohort analyses are ideally conducted using longitudinal data, to our knowledge no such data exist over a similar time span for a representative sample of the US population.
Our assumptions about the year of the interview could lead to misclassification of individuals into birth cohorts. However, the purpose of our study was to identify overall population trends, and these trends were consistent in our sensitivity analyses (data not shown). We recognize that trends in obesity differ dramatically by gender and race; for example, prevalence estimates of obesity among black females are significantly higher compared with black males and white females.(23) Unfortunately, we were unable to evaluate age by birth cohort trends for gender- and race-specific groups, due to smaller sample sizes resulting in unstable estimates. We were unable to generate analyses for Mexican-Americans due to the fact that they were not oversampled until the later NHANES surveys; other ethnic groups (Asian-Americans and other Hispanic) could not be included since they are not oversampled. Although individuals were classified as either black or white for NHANES 1971-1975 and 1976-1980, they were classified as non-Hispanic white and non-Hispanic black for the remaining surveys.
Finally, BMI is an inexpensive method for assessing body fat in large epidemiologic studies, but BMI has its limitations as a measure. One study showed that for a comparable BMI, older persons have higher body fat compared with younger persons, and women have higher body fat compared with men; therefore we may have underestimated obesity among these groups.(28)
Conclusion
Recent birth cohorts within the US population are experiencing a greater duration and degree of obesity over their lifetime. From a public health perspective, these findings portend a continued acceleration of the burden of obesity-related chronic disease, decrements in quality of life, and potential decreases in life expectancy within the US population.
Table 1. Period trends in obesity prevalence by age group (1971-2006) (%(standard error)).
| NHANES I (1971-1975) | NHANES II (1976-1980) | NHANES III (1988-1994) | NHANES (1999-2000) | NHANES (2001-2002) | NHANES (2003-2004) | NHANES (2005-2006) | ||||||||
|---|---|---|---|---|---|---|---|---|---|---|---|---|---|---|
| 2 - 9 years | 5.0% | (0.4%) | 5.9% | (0.6%) | 10.0% | (0.8%) | 12.2% | (1.0%) | 13.1% | (1.5%) | 15.8% | (1.6%) | 12.5% | (1.2%) |
| 10 - 19 years | 6.3% | (0.5%) | 6.1% | (0.5%) | 11.5% | (0.8%) | 15.6% | (1.0%) | 16.4% | (1.2%) | 19.8% | (1.5%) | 18.5% | (1.7%) |
| 20 - 29 years | 8.1% | (0.7%) | 8.5% | (0.7%) | 13.3% | (0.9%) | 21.8% | (2.4%) | 24.5% | (2.0%) | 25.3% | (1.7%) | 25.1% | (2.8%) |
| 30 - 39 years | 13.9% | (1.0%) | 14.1% | (0.8%) | 21.2% | (1.1%) | 28.4% | (2.3%) | 26.5% | (2.0%) | 31.1% | (2.4%) | 32.0% | (2.4%) |
| 40 - 49 years | 15.9% | (1.1%) | 16.8% | (1.0%) | 24.8% | (1.3%) | 31.1% | (3.5%) | 33.6% | (1.7%) | 36.3% | (1.4%) | 38.5% | (2.3%) |
| 50 - 59 years | 18.2% | (1.2%) | 18.3% | (1.0%) | 32.3% | (1.6%) | 36.3% | (3.4%) | 33.2% | (2.2%) | 36.3% | (3.1%) | 41.3% | (2.5%) |
| 60 - 69 years | 17.9% | (1.3%) | 17.7% | (0.9%) | 27.1% | (1.2%) | 39.9% | (1.8%) | 38.8% | (2.0%) | 35.7% | (1.6%) | 40.0% | (2.5%) |
| 70 - 79 years | 17.1%* | (1.3%) | 16.1% | (1.3%) | 22.7% | (1.3%) | 30.5% | (3.6%) | 28.3% | (1.5%) | 30.0% | (2.3%) | 29.5% | (2.9%) |
70-74 years
Table 2. Period trends in obesity prevalence by birth cohort (1971-2006) (%(standard error)).
| NHANES I (1971-1975) | NHANES II (1976-1980) | NHANES III (1988-1994) | NHANES (1999-2000) | NHANES (2001-2002) | NHANES (2003-2004) | NHANES (2005-2006) | ||||||||
|---|---|---|---|---|---|---|---|---|---|---|---|---|---|---|
| 1996 – 2005 | 6.5% | (2.1%) | 9.2% | (1.8%) | 13.4% | (1.3%) | 12.5% | (1.2%) | ||||||
| 1986 – 1995 | 5.9% | (0.6%) | 14.7% | (1.1%) | 16.7% | (1.2%) | 20.7% | (1.9%) | 18.5% | (1.7%) | ||||
| 1976 – 1985 | 0.9% | (0.3%) | 13.1% | (0.9%) | 16.7% | (1.5%) | 20.3% | (1.6%) | 22.8% | (1.8%) | 25.1% | (2.8%) | ||
| 1966 – 1975 | 4.7% | (0.4%) | 7.1% | (0.6%) | 11.8% | (0.7%) | 26.5% | (2.6%) | 24.9% | (2.0%) | 30.0% | (2.4%) | 32.0% | (2.4%) |
| 1956 – 1965 | 6.1% | (0.5%) | 5.4% | (0.5%) | 17.8% | (0.8%) | 29.4% | (2.5%) | 31.3% | (1.8%) | 37.8% | (1.3%) | 38.5% | (2.3%) |
| 1946 – 1955 | 7.6% | (0.6%) | 10.5% | (0.7%) | 24.0% | (1.4%) | 32.7% | (3.9%) | 33.5% | (1.7%) | 33.6% | (3.1%) | 41.3% | (2.5%) |
| 1936 – 1945 | 12.9% | (0.8%) | 14.7% | (0.8%) | 28.5% | (1.6%) | 37.4% | (3.1%) | 40.6% | (3.1%) | 37.1% | (1.7%) | 40.0% | (2.5%) |
| 1926 – 1935 | 15.1% | (1.0%) | 17.7% | (1.1%) | 29.7% | (1.4%) | 37.5% | (2.3%) | 31.9% | (1.6%) | 33.1% | (2.3%) | 29.5% | (2.9%) |
Table 3. Age trends in obesity prevalence by birth cohort (1971-2006) (% (standard error)).
| 2-9 y | 10-19 y | 20 – 29 y | 30 - 39 y | 40 - 49 y | 50 - 59 y | 60 - 69 y | 70 - 79 y | |||||||||
|---|---|---|---|---|---|---|---|---|---|---|---|---|---|---|---|---|
| 1996 – 2005 | 11.6% | (0.7%) | ||||||||||||||
| 1986 – 1995 | 13.8% | (0.9%) | 18.3% | (0.8%) | ||||||||||||
| 1976 – 1985 | 12.2% | (1.2%) | 14.8% | (0.6%) | 23.3% | (1.4%) | ||||||||||
| 1966 – 1975 | 5.7% | (0.4%) | 9.5% | (0.8%) | 21.6% | (1.3%) | 29.3% | (1.4%) | ||||||||
| 1956 – 1965 | 5.6% | (1.1%) | 5.7% | (0.4%) | 11.2% | (1.0%) | 26.7% | (1.2%) | 36.1% | (1.2%) | ||||||
| 1946 – 1955 | 7.0% | (1.5%) | 8.6% | (0.5%) | 19.6% | (1.4%) | 29.9% | (1.6%) | 36.8% | (1.5%) | ||||||
| 1936 – 1945 | 9.1% | (1.5%) | 14.3% | (0.7%) | 20.8% | (1.2%) | 35.8% | (2.0%) | 39.3% | (1.3%) | ||||||
| 1926 – 1935 | 13.6% | (1.8%) | 16.5% | (0.9%) | 26.6% | (1.6%) | 33.7% | (1.1%) | 31.2% | (1.5%) | ||||||
Table 4. Age trends in obesity prevalence by birth cohort for males (1971-2006) (% (standard error)).
| 2-9 y | 10-19 y | 20 – 29 y | 30 - 39 y | 40 - 49 y | 50 - 59 y | 60 - 69 y | 70 - 79 y | |||||||||
|---|---|---|---|---|---|---|---|---|---|---|---|---|---|---|---|---|
| 1996 – 2005 | 12.5% | (1.0%) | ||||||||||||||
| 1986 – 1995 | 14.4% | (1.0%) | 18.6% | (1.1%) | ||||||||||||
| 1976 – 1985 | 11.8% | (1.6%) | 15.4% | (0.9%) | 23.0% | (1.9%) | ||||||||||
| 1966 – 1975 | 5.7% | (0.5%) | 9.9% | (1.3%) | 18.6% | (1.7%) | 27.0% | (1.8%) | ||||||||
| 1956 – 1965 | 5.5% | (1.9%) | 5.2% | (0.5%) | 10.8% | (1.4%) | 23.4% | (1.3%) | 34.9% | (1.8%) | ||||||
| 1946 – 1955 | 7.8% | (2.4%) | 8.4% | (0.8%) | 15.4% | (1.7%) | 25.7% | (2.1%) | 36.1% | (2.5%) | ||||||
| 1936 – 1945 | 8.0% | (2.5%) | 13.5% | (1.1%) | 16.3% | (1.6%) | 29.1% | (2.5%) | 37.9% | (1.9%) | ||||||
| 1926 – 1935 | 9.9% | (2.7%) | 14.8% | (1.3%) | 24.6% | (2.3%) | 30.3% | (2.3%) | 29.2% | (1.8%) | ||||||
Table 5. Age trends in obesity prevalence by birth cohort for females (1971-2006) (% (standard error)).
| 2-9 y | 10-19 y | 20 – 29 y | 30 - 39 y | 40 - 49 y | 50 - 59 y | 60 - 69 y | 70 - 79 y | |||||||||
|---|---|---|---|---|---|---|---|---|---|---|---|---|---|---|---|---|
| 1996 – 2005 | 10.6% | (0.9%) | ||||||||||||||
| 1986 – 1995 | 13.2% | (1.3%) | 17.9% | (1.0%) | ||||||||||||
| 1976 – 1985 | 12.6% | (1.6%) | 14.2% | (1.0%) | 23.8% | (1.6%) | ||||||||||
| 1966 – 1975 | 5.7% | (0.7%) | 9.1% | (1.1%) | 24.8% | (2.1%) | 31.7% | (2.1%) | ||||||||
| 1956 – 1965 | 5.8% | (1.3%) | 6.2% | (0.5%) | 11.6% | (1.4%) | 30.2% | (2.0%) | 37.4% | (1.8%) | ||||||
| 1946 – 1955 | 6.2% | (1.7%) | 8.7% | (0.7%) | 23.4% | (2.2%) | 33.6% | (2.4%) | 37.4% | (1.9%) | ||||||
| 1936 – 1945 | 10.4% | (1.9%) | 15.1% | (0.9%) | 25.3% | (2.1%) | 42.2% | (2.3%) | 40.4% | (2.0%) | ||||||
| 1926 – 1935 | 17.0% | (2.4%) | 18.0% | (1.2%) | 28.4% | (2.0%) | 36.8% | (2.1%) | 32.8% | (2.4%) | ||||||
Table 7. Age trends in obesity prevalence by birth cohort for blacks (1971-2006) (% (standard error)).
| 2-9 y | 10-19 y | 20 – 29 y | 30 - 39 y | 40 - 49 y | 50 - 59 y | 60 - 69 y | 70 - 79 y | |||||||||
|---|---|---|---|---|---|---|---|---|---|---|---|---|---|---|---|---|
| 1996 – 2005 | 12.8% | (0.9%) | ||||||||||||||
| 1986 – 1995 | 15.5% | (1.2%) | 24.4% | (1.1%) | ||||||||||||
| 1976 – 1985 | 13.6% | (1.2%) | 19.4% | (1.1%) | 35.5% | (2.2%) | ||||||||||
| 1966 – 1975 | 6.1% | (1.1%) | 13.2% | (1.9%) | 33.6% | (2.4%) | 43.0% | (2.5%) | ||||||||
| 1956 – 1965 | 4.7% | (2.3%) | 6.9% | (0.8%) | 17.8% | (1.7%) | 33.4% | (2.8%) | 44.3% | (1.9%) | ||||||
| 1946 – 1955 | 8.7% | (3.7%) | 12.5% | (1.9%) | 23.8% | (2.2%) | 38.6% | (2.6%) | 44.5% | (6.0%) | ||||||
| 1936 – 1945 | 17.9% | (6.0%) | 26.7% | (3.1%) | 33.9% | (3.1%) | 41.7% | (3.3%) | 50.3% | (2.9%) | ||||||
| 1926 – 1935 | 34.5% | (6.3%) | 23.6% | (2.8%) | 33.5% | (3.6%) | 40.8% | (2.9%) | 49.7% | (3.7%) | ||||||
Acknowledgments
Grant Funding: Dr. Lee was supported by NIDDK K08DK082386 and the Clinical Sciences Scholars Program at the University of Michigan. The funding sources had no role in the study design; collection, analysis, and interpretation of data; writing of the report; or the decision to submit the article for publication.
List of Abbreviations
- NHANES
National Health and Nutrition Examination Surveys
- BMI
Body mass index
Footnotes
Authors' Contributions: Joyce Lee (JL) accepts full responsibility for the work and/or the conduct of the study, had access to the data, and controlled the decision to publish. JL was involved with conception and design, acquisition of data, analysis and interpretation of data, drafting of the manuscript, critical revision of the manuscript for important intellectual content, statistical analysis, obtaining funding, and supervision. JG was involved with conception and design, acquisition of data, analysis and interpretation of data, drafting of the manuscript, critical revision of the manuscript for important intellectual content. SP and AG were involved with acquisition of data, analysis and interpretation of data, drafting of the manuscript, critical revision of the manuscript for important intellectual content, and statistical analysis. MD, CK, GF, WH, and SV were involved with analysis and interpretation of data, drafting of the manuscript, and critical revision of the manuscript for important intellectual content. All authors read and approved the final manuscript.
IRB approval: This study was considered exempt from the IRB.
References
- 1.Ogden CL, Carroll MD, Curtin LR, McDowell MA, Tabak CJ, Flegal KM. Prevalence of overweight and obesity in the United States, 1999-2004. Jama. 2006;295(13):1549–55. doi: 10.1001/jama.295.13.1549. [DOI] [PubMed] [Google Scholar]
- 2.Flegal KM, Carroll MD, Ogden CL, Johnson CL. Prevalence and trends in obesity among US adults, 1999-2000. Jama. 2002;288(14):1723–7. doi: 10.1001/jama.288.14.1723. [DOI] [PubMed] [Google Scholar]
- 3.Baker JL, Olsen LW, Sorensen TI. Childhood body-mass index and the risk of coronary heart disease in adulthood. N Engl J Med. 2007;357(23):2329–37. doi: 10.1056/NEJMoa072515. [DOI] [PMC free article] [PubMed] [Google Scholar]
- 4.Knowler WC, Pettitt DJ, Saad MF, Charles MA, Nelson RG, Howard BV, et al. Obesity in the Pima Indians: its magnitude and relationship with diabetes. Am J Clin Nutr. 1991;53(6 Suppl):1543S–51S. doi: 10.1093/ajcn/53.6.1543S. [DOI] [PubMed] [Google Scholar]
- 5.Flegal KM, Graubard BI, Williamson DF, Gail MH. Excess deaths associated with underweight, overweight, and obesity. Jama. 2005;293(15):1861–7. doi: 10.1001/jama.293.15.1861. [DOI] [PubMed] [Google Scholar]
- 6.Alley DE, Chang VW. The changing relationship of obesity and disability, 1988-2004. JAMA. 2007;298(17):2020–7. doi: 10.1001/jama.298.17.2020. [DOI] [PubMed] [Google Scholar]
- 7.Lakdawalla DN, Bhattacharya J, Goldman DP. Are the young becoming more disabled? Health Aff (Millwood) 2004;23(1):168–76. doi: 10.1377/hlthaff.23.1.168. [DOI] [PubMed] [Google Scholar]
- 8.Olshansky SJ, Passaro DJ, Hershow RC, Layden J, Carnes BA, Brody J, et al. A potential decline in life expectancy in the United States in the 21st century. N Engl J Med. 2005;352(11):1138–45. doi: 10.1056/NEJMsr043743. [DOI] [PubMed] [Google Scholar]
- 9.Rolland-Cachera MF, Cole TJ, Sempe M, Tichet J, Rossignol C, Charraud A. Body Mass Index variations: centiles from birth to 87 years. Eur J Clin Nutr. 1991;45(1):13–21. [PubMed] [Google Scholar]
- 10.Guo SS, Wu W, Chumlea WC, Roche AF. Predicting overweight and obesity in adulthood from body mass index values in childhood and adolescence. Am J Clin Nutr. 2002;76(3):653–8. doi: 10.1093/ajcn/76.3.653. [DOI] [PubMed] [Google Scholar]
- 11.Narayan KM, Boyle JP, Thompson TJ, Sorensen SW, Williamson DF. Lifetime risk for diabetes mellitus in the United States. Jama. 2003;290(14):1884–90. doi: 10.1001/jama.290.14.1884. [DOI] [PubMed] [Google Scholar]
- 12.National Center for Health Statistics. National Health and Nutrition Examination Survey. [Feb 7, 2007]. at Available at: http://www.cdc.gov/nchs/nhanes.htm.
- 13.Kuczmarski RJ, Ogden CL, Guo SS, Grummer-Strawn LM, Flegal KM, Mei Z, et al. 2000 CDC Growth Charts for the United States: methods and development. Vital Health Stat. 2002;11(246):1–190. [PubMed] [Google Scholar]
- 14.Rust KF, Rao JN. Variance estimation for complex surveys using replication techniques. Stat Methods Med Res. 1996;5(3):283–310. doi: 10.1177/096228029600500305. [DOI] [PubMed] [Google Scholar]
- 15.Everhart JE. Duration of obesity increases the incidence of NIDDM. Diabetes. 1992;41(2):235–40. doi: 10.2337/diab.41.2.235. [DOI] [PubMed] [Google Scholar]
- 16.Brancati FL, Wang NY, Mead LA, Liang KY, Klag MJ. Body Weight Patterns From 20 to 49 Years of Age and Subsequent Risk for Diabetes MellitusThe Johns Hopkins Precursors Study. Am Med Assoc. 1999 doi: 10.1001/archinte.159.9.957. [DOI] [PubMed] [Google Scholar]
- 17.Orchard TJ, Dorman JS, Maser RE, Becker DJ, Drash AL, Ellis D, et al. Prevalence of complications in IDDM by sex and duration. Pittsburgh Epidemiology of Diabetes Complications Study II. Diabetes. 1990;39(9):1116–24. doi: 10.2337/diab.39.9.1116. [DOI] [PubMed] [Google Scholar]
- 18.Pavkov ME, Bennett PH, Knowler WC, Krakoff J, Sievers ML, Nelson RG. Effect of youth-onset type 2 diabetes mellitus on incidence of end-stage renal disease and mortality in young and middle-aged Pima Indians. Jama. 2006;296(4):421–6. doi: 10.1001/jama.296.4.421. [DOI] [PubMed] [Google Scholar]
- 19.Ogden CL, Carroll MD, Flegal KM. High body mass index for age among US children and adolescents, 2003-2006. JAMA. 2008;299(20):2401–5. doi: 10.1001/jama.299.20.2401. [DOI] [PubMed] [Google Scholar]
- 20.Ogden CL, Carroll MD, McDowell MA, Flegal KM. Obesity among adults in the United States—no change since 2003–2004. In: Statistics NCfH, editor. NCHS data brief no 1. Hyattsville, MD: 2007. [PubMed] [Google Scholar]
- 21.Dietz W. Critical periods in childhood for the development of obesity. American Journal of Clinical Nutrition. 1994;59(5):955–9. doi: 10.1093/ajcn/59.5.955. [DOI] [PubMed] [Google Scholar]
- 22.Cowie CC, Rust KF, Byrd-Holt DD, Eberhardt MS, Flegal KM, Engelgau MM, et al. Prevalence of Diabetes and Impaired Fasting Glucose in Adults in the US Population. Diabetes Care. 2006;29(6):1263–8. doi: 10.2337/dc06-0062. [DOI] [PubMed] [Google Scholar]
- 23.Wang Y, Beydoun MA. The obesity epidemic in the United States--gender, age, socioeconomic, racial/ethnic, and geographic characteristics: a systematic review and meta-regression analysis. Epidemiol Rev. 2007;29:6–28. doi: 10.1093/epirev/mxm007. [DOI] [PubMed] [Google Scholar]
- 24.Leveille SG, Wee CC, Iezzoni LI. Trends in obesity and arthritis among baby boomers and their predecessors, 1971-2002. Am J Public Health. 2005;95(9):1607–13. doi: 10.2105/AJPH.2004.060418. [DOI] [PMC free article] [PubMed] [Google Scholar]
- 25.Wang YC, Colditz GA, Kuntz KM. Forecasting the obesity epidemic in the aging U.S. population. Obesity (Silver Spring) 2007;15(11):2855–65. doi: 10.1038/oby.2007.339. [DOI] [PubMed] [Google Scholar]
- 26.Liese AD, D'Agostino RB, Jr, Hamman RF, Kilgo PD, Lawrence JM, Liu LL, et al. The burden of diabetes mellitus among US youth: prevalence estimates from the SEARCH for Diabetes in Youth Study. Pediatrics. 2006;118(4):1510–8. doi: 10.1542/peds.2006-0690. [DOI] [PubMed] [Google Scholar]
- 27.Lee JM. Why young adults hold the key to assessing the obesity epidemic in children. Arch Pediatr Adolesc Med. 2008;162(7):682–7. doi: 10.1001/archpedi.162.7.682. [DOI] [PubMed] [Google Scholar]
- 28.Gallagher D, Visser M, Sepulveda D, Pierson RN, Harris T, Heymsfield SB. How Useful Is Body Mass Index for Comparison of Body Fatness across Age, Sex, and Ethnic Groups? American Journal of Epidemiology. 1996;143(3):228–39. doi: 10.1093/oxfordjournals.aje.a008733. [DOI] [PubMed] [Google Scholar]


