Abstract
Orally administrable alginate-poly-L-lysine-alginate (APA) microcapsules containing live yeast cells was investigated for use in renal failure. At all times, yeast cells remain inside the microcapsules, which are then excreted in the stool. During their gastrointestinal passage, small molecules, like urea, diffuse into the yeast microcapsules where they are hydrolyzed. Orally administrating these microcapsules to uremic rats was found to decrease urea concentrations from 7.29 ± 0.89 mmol/L to 6.12 ± 0.90 mmol/L over a treatment period of eight weeks. After stopping the treatment, the urea concentrations increased back to uremic levels of 7.64 ± 0.77 mmol/L. The analysis of creatinine concentrations averaged 39.19 ± 4.33 μmol/L, 50.83 ± 5.55 μmol/L, and 50.28 ± 7.10 μmol/L for the normal-control, uremic-control and uremic-treatment groups, respectively. While creatinine concentrations for both uremic-control and uremic-treatment groups did not differ among each other (P > .05), they were, however, significantly higher than those of the normal control group (P < .05). Uric acid concentrations averaged 80.08 ± 26.49 μmol/L, 99.92 ± 26.55 μmol/L, and 86.49 ± 28.42 μmol/L for the normal-control, uremic-control and uremic-treatment groups, respectively. There were no significant differences in both calcium and phosphate concentrations among all three groups (P > .05). The microbial populations of five tested types of bacteria were not substantially altered by the presence of the yeast APA encapsulated yeast (P > .05).
1. Introduction
In North America, renal failure is quite common, affecting approximately 5% of hospitalized patients and up to 30% of patients in intensive care units (ICUs) [1]. In 2003, 8.3 million Americans were reported to have mature chronic kidney disease with a significant number developing end stage renal disease (ESRD) [2]. Acute renal failure, or ARF, affects up to 200,000 people in the United States annually, or approximately 5% of all long-term hospitalized patients [3–5]. ARF and ESRD have high mortality characterized by an overall survival rate of approximately 50% or lower depending on the severity of the renal malfunction [6].
In most cases of renal failure, there is usually an increased retention of waste metabolites (mainly urea and creatinine) in the blood and body tissues due to a substantial decrease in urinary excretion [7–10]. As a result, blood urea nitrogen (BUN) and creatinine may increase from 18 mg/dL to 100–300 mg/dL and from 1 mg/dL to 10–25 mg/dL, respectively [11, 12]. Treating renal failure has been a persistent challenge for almost two decades. Dialysis is generally used to correct for these excess metabolites [10, 13]. However, all current renal replacement therapies (RRTs), including kidney transplantation, dialysis, and hemofiltration, display inherent disadvantages. They are characterized by serious long term complications that undermine the efficacy of these renal failure treatment modalities. Hence, new therapeutic methodologies have been investigated and developed in order to bridge the gap between efficacy and feasibility.
Among such novel potential treatments is the microencapsulation of live microorganisms capable of depleting toxic wastes and other unwanted metabolites. Previous research has demonstrated the feasibility and the potential of administrating microencapsulated micro-organisms as an alternative oral therapy. Examples include microencapsulating genetically engineered Escherichia coli DH5 cells over-expressing the Klebsiella aerogenes urease gene for urea removal in renal failure [14], Oxalobacter formigenes producing oxalate-degrading enzymes for removal of accumulated oxalate in urolithiasis [15, 16].
There have been three major attempts to design novel potential alternative approaches to remove nitrogenous wastes associated with renal failure. The first uses adsorbents, such as oxystarch, to directly bind urea [10–13, 17–20]. The second method consists of hydrolyzing urea via co-immobilized enzyme urease and removing it via adsorbents [10, 12, 13, 18–20]. However, using such adsorbents requires very large doses, which is medically not advisable [11, 17, 18, 21, 22]. The third method consists of microencapsulating multienzyme systems to convert urea and ammonia into essential amino acids [13, 18, 22–24]. The problem with the last method is its poor conversion rate [23, 24].
This article investigates the potential of orally administrating APA microcapsules containing live yeast cells in renal failure uremic rates model and its feasibility to reduce the nitrogenous waste concentration levels. Towards this goal, we have recently optimized the encapsulation procedure and its respective parameters to accommodate yeast cells.
2. Materials and Methods
2.1. Chemicals
Sodium alginate (low viscosity) and poly-L-lysine hydrobromide (PLL) (MW 27,400) were both purchased from Sigma-Aldrich.
2.2. Microorganism and Culture Conditions
Saccharomyces cerevisiae, strain reference number 9896, was purchased from ATCC [24]. This organism is capable of producing urease urea amidolyase, which in turn metabolizes urea [25]. Yeast mold broth (YMB) growth medium was used for primary cell cultivation. YMB is composed of 10 g/L of glucose, 3 g/L of malt extract, 5 g/L of peptone and 3 g/L yeast extract. The inoculated medium was incubated aerobically at 37°C for 48 hours.
2.3. Preparation of APA Microcapsules Containing Live Yeast Cells
Log phase cultures of Saccharomyces cerevisiae were harvested by centrifugation at 3500 rpm for 15 minutes at 4°C. Pellets were then mixed with 2% alginate solution in order to form a final mixture consisting of 8% (v/w) pellets and 1.75% alginate. Alginate microcapsules were prepared by generating droplets of sodium alginate solution (15 mg/mL) using an IER-20 encapsulator machine manufactured by Inotech. Corp. Extruded through a 300 μm nozzle by a syringe driven pump, these droplets were gelled for 30 minutes in a well-stirred calcium chloride solution (11 mg/mL). The same droplets were then coated with a 0.1% (w/v) solution of PLL for 10 minutes to form AP beads and washed again with physiological saline (PS) for 5 minutes. The final alginate coating was then applied by immersing the beads in a 0.1% (w/v) sodium alginate solution for 10 minutes followed by a final 5-minute PS wash. The resulting microcapsules, having an average diameter of 638 ± 17 μm, were then collected and stored in a 10/90 YMB/PS solution at 4°C. All solutions used in the preparation of these APA microcapsules were either filtered using 0.22 μm filter or autoclaved to ensure sterility. Moreover, the entire procedure was carried out in a biological hood.
2.4. Treatment Phases and Animal Monitoring
In this study, 36 (12 control normal and 24 uremic rats) male Wistar rats were purchased from Sprague Dawley Laboratory. All rats' aged between 60 and 80 days and weighted between 300 and 340 g. Both normal and uremic rats were tested upon arrival for determination of baseline urea levels (18–30 mg/dL or 3–5 mmol/L approximately for normal rats). On arrival, two rats were placed two per cage and fed rodent chow for 1 week in order to acclimatize them to the facility (sterile room with controlled temperature (22–24°C) and alternating light and dark cycles). Food and water were provided ad libitum. The animals were then be randomized in 3 groups: (1) normal control-treatment period (TP) consisting of 12 normal rats fed with alginate-ploy-L-lysine-alginate (APA) microcapsules containing live yeast cells, (2) uremic control-no-TP consisting of 12 uremic rats fed with empty APA microcapsules, and (3) uremic-TP consisting of 12 uremic rats fed with APA microcapsules containing live yeast cells.
During the experiment, the 3 groups of animals were monitored over time to evaluate changes in their urea, creatinine, phosphate, calcium, and uric acid levels. As mentioned before there was a 1 week pre-TP period to acclimatize the animals. The treatment period lasted for 8 weeks during which the rats were gavaged daily early in the afternoon and bled twice a week. The syringes were weighted in order to verify that the same amount of capsules were administered to each rat. There was a post-TP period of 2 weeks during which the animals were only bled respecting the same frequency. Animals were bled approximately 30–45 minutes post gavage.
2.5. Gavaging
3 mL syringes (purchased from Fisher Scientific) were used to gavage the animals. Each syringe contained 2.5 mL of APA microcapsules mixed with 0.5 mL of PS. The loading was conducted in a sterile biological hood using a beaker filled with the desired preparation. Before gavaging the animals, syringes were incubated for 2 hours at 37°C in order to activated the microorganisms. The microcapsules were then orally forced-fed to the experimental rats using curved 16G stainless steel gavage needle. For this, the animal was hand-restrained and no anesthesia was used.
2.6. Blood Collection
200 μL of saphenous blood was collected in SST microtainers (purchased from BD Biosciences) without sedating the animals. The samples were centrifuged and analyzed using a Hitachi 911 Clinical Chemistry Analyzer (Roche Diagnostics), which was loaded with the appropriate kits. Animal health indicators verification of clinical features (body weight, animal's integument, erythematic, hair coat condition, status of hydration and prorates, animal's equilibrium: unsteadiness on legs, coordination of legs and/or abnormal reflexes, muscular disturbances, cardiovascular problems, levels of energy and motion rate, animal's respiratory system) were monitored and assessed twice a week for all the entire trial period (11 weeks).
2.7. Effect of Oral Administration of Yeast APA Microcapsules on the Gut Microbial Flora
To investigate the effect of oral administration of APA encapsulated yeast on the gut microflora, parts of rats' large intestine were obtained after sacrifice. From each group, 5 rats were chosen randomly for this purpose. The organs were homogenized mechanically until a fluid phase was obtained. Following that, 1 mL of this slurry was collected in a 1.5 mL graduated Eppendorf tube. Six 10-fold serial dilutions were performed using autoclaved PS and 0.1 mL aliquots of final dilution were plated on 5 different agar plates. The plates were then incubated aerobically according to their corresponding conditions. Bacterial enumeration for specific fecal marker microorganisms, total aerobes, total anaerobes, Escherichia coli, Staphylococcus sp. and Lactobacillus sp. was performed in triplicate using an agar-plate-count assay. The platting media and incubation conditions used are all listed in Table 1.
Table 1.
Media and incubation conditions used for enumeration of representative microbes in the human large intestine.
| Microbial group | Medium | Incubation conditions and time | Colonies formed |
|---|---|---|---|
| Total aerobes | Brain heart infusion agar | Aerobic, 37C, 24 h | White |
| Total anaerobes | Brain heart infusion agar | Anaerobic, 37C, 72 h | White |
| Escherichia coli | Mc Conkey agar | Aerobic, 43C, 24 h | Red-purple |
| Staphylococcus sp. | Mannitol Salt agar | Aerobic, 37C, 48 h | White with yellow/purple zone |
| Lactobacillus sp. | Rogosa agar | Anaerobic, 37C, 72 h | White |
2.8. Statistical Analysis
The statistical Analysis System (SAS Enterprise Guide 4.1 (4.1.0.471) by SAS Institute Inc., Cary, NC, USA) was used to analyze the data. Data was expressed as means ± SEM. Group and time effects were statistically investigated by ANOVA mixed models. Data were considered significant at P < .05.
3. Results
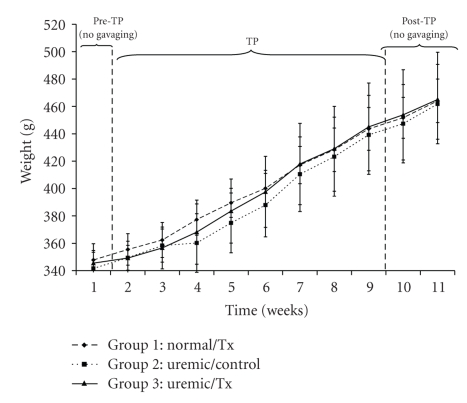
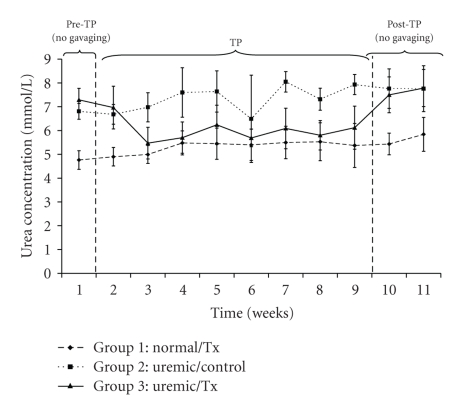
One of the important parameters indicating the efficiency of the treatment is the body weight, which was measured twice a week along the trial period. Figure 1 shows the average body weights of each studied group. The average body weight of the normal control group increased from 347.83 ± 11.86 g at t = 1 week to 464.03 ± 11.86 g at t = 11 weeks, respectively. Similarly, body weights for the uremic control and uremic treatment groups increased from 341.64 ± 11.86 g to 461.73 ± 29.01 g, and from 345.50 ± 9.28 g to 465.00 ± 34.56 g, respectively, between week 1 and 11 of the trial. There were significant time and group effects in rats' body weight (P < .05). The urea concentration, which is one of the essential indicators of the success of the proposed treatment, followed a different trend (Figure 2). Specifically, urea levels in the uremic treatment group during the pre-TP and post-TP phases were not statistically different from those for the uremic control group (P > .05). However, urea concentrations for the uremic treatment group in between weeks 2 and 9 were significantly different from those for the other two controls (P < .05). All along the 11 weeks of the trial, urea concentrations averaged 5.37 ± 0.67 mmol/L and 7.39 ± 0.99 mmol/L for the normal and uremic control groups, respectively. The average urea concentration for the uremic treatment group decreased from 7.29 ± 0.89 mmol/L to 6.97 ± 0.48 mmol/L after 1 week of treatment. During the treatment, the urea concentration for this same group averaged 6.01 ± 0.47 mmol/L before increasing again to 7.64 ± 0.77 mmol/L once the gavage had stopped.
Figure 1.
Rats' body weight before, during and after oral administration of APA microencapsulated yeast cells.
Figure 2.
Plasma urea concentration before, during and after oral administration of APA microencapsulated yeast cells.
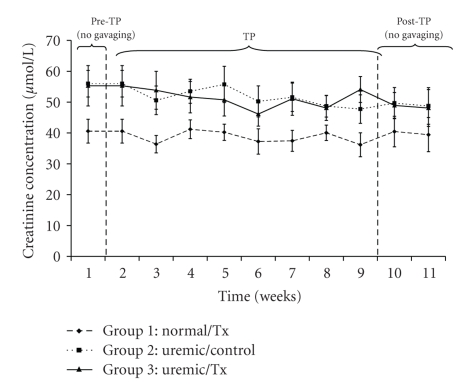
The analysis of creatinine concentrations averaged 39.19 ± 4.33 μmol/L, 50.83 ± 5.55 μmol/L, and 50.28 ± 7.10 μmol/L for the normal and uremic control as well as the uremic treatment group, respectively (Figure 3). While values for both uremic groups did not differ among each other (P > .05), they were, however, significantly higher than those of the normal control group (P < .05).
Figure 3.
Plasma creatinine concentration before, during and after oral administration of APA microencapsulated yeast cells.
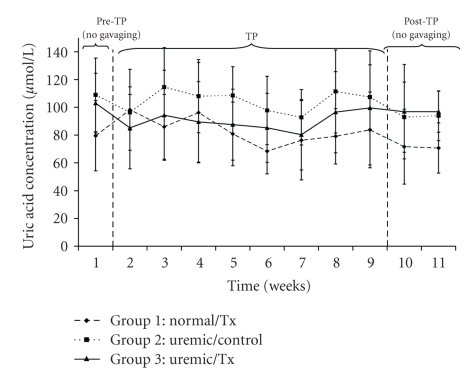
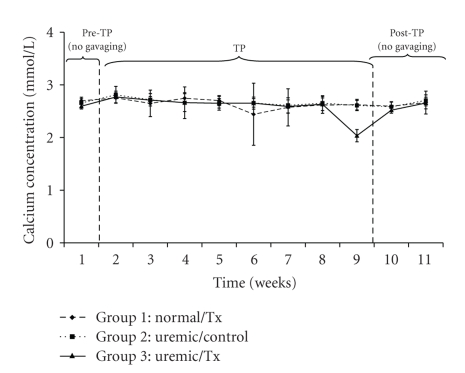
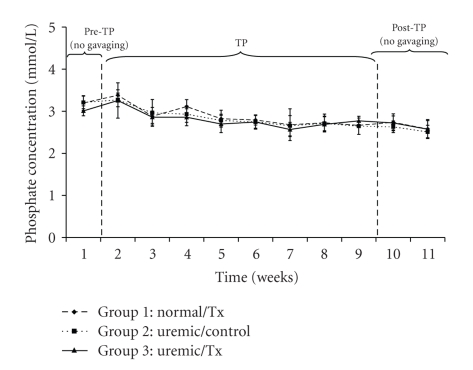
Uric acid concentrations averaged 80.08 ± 26.49 μmol/L, 99.92 ± 26.55 μmol/L, and 86.49 ± 28.42 μmol/L for the normal and uremic control as well as the uremic treatment group, respectively (Figure 4). Calcium concentrations averaged 2.65 ± 0.25 mmol/L, 2.66 ± 0.15 mmol/L, and 2.63 ± 0.22 mmol/L for the normal, uremic-control and uremic treatment groups, respectively (Figure 5). There were neither time nor group effects in the data for calcium concentrations (P > .05). Finally, phosphate concentrations, which averaged 2.84 ± 0.31 mmol/L, 2.78 ± 0.28 mmol/L, and 2.75 ± 0.33 mmol/L (Figure 6) for the normal, uremic-control and uremic treatment groups, respectively, did not display any time or group effects (P > .05).
Figure 4.
Plasma uric acid concentration before, during and after oral administration of APA microencapsulated yeast cells.
Figure 5.
Plasma calcium concentration before, during and after oral administration of APA microencapsulated yeast cells.
Figure 6.
Plasma phosphate concentration before, during and after oral administration of APA microencapsulated yeast cells.
An important prerequisite when orally administrating APA microcapsules containing live yeast cells is that these entities should not disturb the natural colonic gut flora. This importance is accentuated when prolonged and repeated oral intake of large quantities of microcapsules is required. Table 2 shows no marked differences in the population of the tested microbes for the uremic treatment group and those for both the normal and uremic control groups (P > .05).
Table 2.
Effect of APA microcapsules on selected microbes in the human large intestine.
| Microbes | Incubation time [hr] | Log CFU/ml medium | ||
|---|---|---|---|---|
| Normal-TP | Uremic-empty APA microcapsules | Uremic-TP | ||
| Total aerobes | 0 | 8.22 ± 0.12 | 8.22 ± 0.11 | 8.22 ± 0.09 |
| 6 | 8.27 ± 0.01 | 8.17 ± 0.16 | 8.26 ± 0.08 | |
| 12 | 8.24 ± 0.14 | 8.34 ± 0.04 | 8.31 ± 0.07 | |
| 24 | 8.29 ± 0.1 | 8.32 ± 0.02 | 8.28 ± 0.03 | |
| Total anaerobes | 0 | 8.37 ± 0.03 | 8.37 ± 0.01 | 8.37 ± 0.01 |
| 6 | 8.35 ± 0.09 | 8.39 ± 0.02 | 8.31 ± 0.1 | |
| 12 | 8.38 ± 0.11 | 8.41 ± 0.07 | 8.38 ± 0.12 | |
| 24 | 8.37 ± 0.14 | 8.4 ± 0.11 | 8.36 ± 0.16 | |
| Escherichia coli | 0 | 8.29 ± 0.13 | 8.29 ± 0.08 | 8.29 ± 0.11 |
| 6 | 8.24 ± 0.16 | 8.33 ± 0.05 | 8.29 ± 0.12 | |
| 12 | 8.27 ± 0.11 | 8.24 ± 0.17 | 8.32 ± 0.1 | |
| 24 | 8.31 ± 0.07 | 8.28 ± 0.12 | 8.27 ± 0.11 | |
| Staphylococcus sp. | 0 | 6.65 ± 0.14 | 6.65 ± 0.12 | 6.65 ± 0.1 |
| 6 | 6.74 ± 0.07 | 6.57 ± 0.16 | 6.72 ± 0.03 | |
| 12 | 6.59 ± 0.15 | 6.61 ± 0.06 | 6.69 ± 0.01 | |
| 24 | 6.64 ± 0.13 | 6.62 ± 0.12 | 6.58 ± 0.08 | |
| 48 | 6.71 ± 0.07 | 6.74 ± 0.12 | 6.6 ± 0.17 | |
| Lactobacillus sp. | 0 | 5.32 ± 0.01 | 5.32 ± 0.06 | 5.32 ± 0.03 |
| 6 | 5.4 ± 0.05 | 5.41 ± 0.01 | 5.36 ± 0.08 | |
| 12 | 5.45 ± 0.03 | 5.39 ± 0.05 | 5.33 ± 0.11 | |
| 24 | 5.39 ± 0.09 | 5.37 ± 0.12 | 5.37 ± 0.11 | |
| 48 | 5.36 ± 0.1 | 5.35 ± 0.08 | 5.41 ± 0.01 | |
| 72 | 5.38 ± 0.17 | 5.42 ± 0.12 | 5.45 ± 0.15 | |
4. Discussion
The rationale behind using an experimental uremic rat animal model stems from the striking similarities in the GI tract of rats and humans. In particular, this experimental uremic rat model has shown earlier high levels of plasma urea and other unwanted metabolites compared to normal rats, with a similar experimental endpoint. With 12 animals in each group, differences in mean uremic metabolites could be determined with a power larger than 80% and an alpha error of 5%. In other words, using 36 animals allows us to detect small differences, if any exist, and, thus, infer properly about the feasibility of the treatment.
The major objective of this animal study was to determine the efficacy of microencapsulated live saccharomyces cerevisiae cells as a treatment option for lowering toxic metabolites associated with renal failure. For the first time, we report the use of polymeric membrane artificial cells [26–29] containing live yeast cells in renal failure. Our studies show that live yeast cells can be microencapsulated and retained inside the artificial cells during passage down the GI tract. During passage through the intestine, urea molecules diffuse throughout the permeable membrane of the artificial cells. This is rendered possible due to the molecular-weight-cut-off (MWCO) of these artificial cells. In particular, the MWCO of the alginic membrane is estimated to be between 60–70 kDa [30], while the approximate molecular weight of urea and urease are 60 kDa and 483 kDa, respectively. Theoretically speaking, urease should always stay entrapped inside the cell. Once inside the cell, urea molecules get hydrolyzed due to yeast cells, which use urea as their carbon source. The same reasoning applies for the other metabolites.
In humans, normal urea concentration ranges approximately between 3–5 ± 0.5 mmol/L (or 18–30 mg/dL) in plasma. Anything above this range is considered uremic. The urea concentrations of the normal and uremic control groups are expected to be within and higher than the normal urea range of 3–5 ± 0.5 mmol/L (Figure 2). Noting that the urea concentrations of the uremic treatment group decreased at the start of the treatment and increased to uremic values after stopping the treatment suggests that the APA encapsulated yeast show efficacy and work as hypothesized. By analyzing the data, one can notice that urea in uremic treated rats decreased by approximately 18% from the pre-TP phase level. During the treatment 8-week treatment period, the urea concentrations for the uremic-TP group stagnated around 6.01 ± 0.47 mmol/L, which is around 1.1 times greater than the average urea concentration of the normal control group. Upon terminating the oral administration of the APA encapsulated yeast, the plasma urea level returned rapidly to the uremic values (Figure 2). This means that the artificial cells were all excreted in the stool and were not retained in the intestinal tract.
The concentrations of creatinine and uric acid (Figures 3 and 4) did not vary significantly within and among each uremic group but were significantly different from those of the control group. Specifically, the creatinine concentrations of uremic treated and not treated groups were 1.29 and 1.28 times greater than those of the normal group, respectively. Similarly, those of uric acid for the same uremic groups were 1.23 and 1.07 times greater than those of the normal group, respectively. These trends suggests that the orally administered APA encapsulated yeast did not have any effect on lowering neither creatinine nor uric acid, which are both correlated with decreased renal function [31, 32]. Similarly, the artificial cells did not influence calcium (P > .05) and phosphate (P > .05) plasma electrolytes because there was no variation in their concentrations neither with respect to time nor among groups (Figures 5 and 6).
Body weight, which is an indication of the overall health condition, increased throughout the trial period (Figure 1). This suggests that the animals maintained a constant growth. Furthermore, each rats' group displayed body weight values that are statistically different from the other two groups with respect to time. However, renal failure individuals have usually their body weight decreasing with time. If the TP is proven successful, we would have expected the body weight of the uremic control rats to decrease and that of the normal and uremic-TP groups to increase. Specifically, the body weight of the normal and uremic controls increased by 33.41 ± 2.1% and 35.15 ± 1.9%, respectively, at the end of the 11th week. Similarly, the uremic-TP had their body weight increased by 34.59 ± 0.9%. During the TP period, the increase in the body weight of the uremic-TP group is significantly larger than that of the uremic control group. This fact is not surprising and suggests that the treatment is somehow effective in alleviating some of the uremia effects. However, the only possible explanation to the rise in the body weight of the uremic control rats is that the decrease in this parameter due to uremia is outweighed by its increase due to growth.
It is known that a well-balanced gut microbiota plays a crucial role on the ensemble of the human health [33]; upsetting the intestinal flora may lead to complications and colonizations/infections [34]. The results from the in vivo viability study (Table 2) could suggest that the materials used to produce the microcapsules combined with the yeast itself did not evoke any appreciable adverse effects on the simulated human intestinal flora.
5. Conclusion
Normally, the kidneys are responsible for removing metabolic waste metabolites and maintaining water and electrolyte balance. In the case of renal failure, these tasks cannot be fulfilled by the damaged kidneys and patients need alternative treatment to survive. Dialysis and kidney transplantation are considered effective but expensive. Other alternatives such as the use of absorbents are challenged with the need of large doses of absorbents [10–13, 17–20]. This work presents a novel yeast-based approach to treat renal failure uremia. Oral administration of these microcapsules to uremic rats was found to decrease urea levels by 18 ± 0.31% over a period of eight weeks. After stopping the treatment, the urea concentration increased back to the uremic values. However, this formulation had no perceivable effects on the concentrations of creatinine, uric acid, phosphate, and calcium. The microbial populations of the five tested types of bacteria were not substantially altered by the presence of the APA encapsulated yeast. This suggets, in consequence, that there were no perceivable adverse effects of oral administration of these capsules on the microbial flora of the human GI tract.
Acknowledgments
The authors acknowledge Canadian Institute of Health Research (CIHR) MOP 64308 to S. Prakash, the post graduate scholarship from NSERC to A. Urbanska, the post graduate scholarship from CIHR to J. Bhathena and the post graduate scholarship from NSERC to C. Martoni. The authors would like to forward special thanks to Ms. Ayla Coussa, Ms. Genevieve Berube and Ms. Sonia Kajla for technical help.
References
- 1.Brady HR, Clarkson MR, Lieberthal W. Acute renal failure. In: Brenner BM, editor. Brenner & Rector’s the Kidney. Philadelphia, Pa, USA: W. B. Saunders; 2004. pp. 1215–1292. [Google Scholar]
- 2.Coresh J, Astor BC, Greene T, Eknoyan G, Levey AS. Prevalence of chronic kidney disease and decreased kidney function in the adult US population: Third National Health and Nutrition Examination Survey. American Journal of Kidney Diseases. 2003;41(1):1–12. doi: 10.1053/ajkd.2003.50007. [DOI] [PubMed] [Google Scholar]
- 3.Thadhani R, Pascual M, Bonventre JV. Acute renal failure. The New England Journal of Medicine. 1996;334(22):1448–1460. doi: 10.1056/NEJM199605303342207. [DOI] [PubMed] [Google Scholar]
- 4.Lieberthal W, Nigam SK. Acute renal failure. II. Experimental models of acute renal failure: imperfect but indispensable. American Journal of Physiology. 2000;278(1):F1–F12. doi: 10.1152/ajprenal.2000.278.1.F1. [DOI] [PubMed] [Google Scholar]
- 5.Nigam SK, Lieberthal W. Acute renal failure. III. The role of growth factors in the process of renal regeneration and repair. American Journal of Physiology. 2000;279(1):F3–F11. doi: 10.1152/ajprenal.2000.279.1.F3. [DOI] [PubMed] [Google Scholar]
- 6.Schrier RW, Wang W. Acute renal failure and sepsis. The New England Journal of Medicine. 2004;351(22):2347–2349. doi: 10.1056/NEJM200411253512224. [DOI] [PubMed] [Google Scholar]
- 7.Charles S, David M, Stacia M. Control of body fluid, electrolyte, and acid−base balance. In: Deborah A, editor. Human Physiology: Foundations and Frontiers. Sant Louis, Mo, USA: Times-Mirror College Publications; 1990. pp. 526–527. [Google Scholar]
- 8.Asaba H, et al. Plasma middle molecules in asymptomatic and sick uremic patients. In: Klinkmann H, et al., editors. Middle Molecules in Uremia and Other Diseases. Cleveland, Ohio, USA: International Society for Artificial Organs; 1980. pp. 137–141. [PubMed] [Google Scholar]
- 9.Cohen BD. Uremic toxins. In: Kulte R, Geoffrey B, Benjamin BC, editors. Uremia: An International Conference on Pathogenesis, Diagnosis and Therapy. Stuttgart, Germany: Thieme; 1972. pp. 1–11. [Google Scholar]
- 10.Kolff WJ. Artificial kidney and artificial heart: further considerations. International Journal of Artificial Organs. 1990;13(7):404–406. [PubMed] [Google Scholar]
- 11.Esposito R, Carmelo G, Polyhalides G. Sorbents and Their Clinical Applications. London, UK: Academic Press; 1980. [Google Scholar]
- 12.Drukker W, Parsons PM, Mahar JF. Replacement of Renal Functions by Dialysis. Boston, Mass, USA: Martinus Nijhoff; 1983. [Google Scholar]
- 13.Friedman EA. Future treatment of renal failure. In: Friedman EA, editor. Strategy in Renal Failure. New York, NY, USA: John Wiley & Sons; 1978. pp. 521–528. [Google Scholar]
- 14.Prakash S, Chang TMS. Microencapsulated genetically engineered E. coli DH5 cells for plasma urea and ammonia removal based on : 1. Column bioreactor and 2. Oral administration in uremic rats. Artificial Cells, Blood Substitutes, and Immobilization Biotechnology. 1996;24(3):201–218. doi: 10.3109/10731199609117436. [DOI] [PubMed] [Google Scholar]
- 15.Hoppe B, von Unruh G, Laube N, Hesse A, Sidhu H. Oxalate degrading bacteria: new treatment option for patients with primary and secondary hyperoxaluria? Urological Research. 2005;33(5):372–375. doi: 10.1007/s00240-005-0497-z. [DOI] [PubMed] [Google Scholar]
- 16.Jones ML, Chen H, Ouyang W, Metz T, Prakash S. Microencapsulated genetically engineered Lactobacillus plantarum 80 (pCBH1) for bile acid deconjugation and its implication in lowering cholesterol. Journal of Biomedicine and Biotechnology. 2004;2004(1):61–69. doi: 10.1155/S1110724304307011. [DOI] [PMC free article] [PubMed] [Google Scholar]
- 17.Kjellstrand C, Borges H, Pru C, Gardner D, Fink D. On the clinical use of microencapsulated zirconium phosphate-urease for the treatment of chronic uremia. Transactions of the American Society for Artificial Internal Organs. 1981;27:24–30. [PubMed] [Google Scholar]
- 18.Sparks RE, Mason NS, Meier PM, Samuels WE, Litt MH, Lindan O. Binders to remove uremic waste metabolites from the GI tract. Transactions of the American Society for Artificial Internal Organs. 1972;18:458–464. doi: 10.1097/00002480-197201000-00113. [DOI] [PubMed] [Google Scholar]
- 19.Sparks RE. Review of gastrointestinal perfusion in the treatment of uremia. Clinical Nephrology. 1979;11(2):81–85. [PubMed] [Google Scholar]
- 20.Walker JM, Jacobson RL, Stephen WJ, Rose D. The role of adsorbents in the wearable artificial kidney. In: Gilchrist T, editor. Artificial Organs. London, UK: Macmillan Press; 1977. pp. 137–149. [Google Scholar]
- 21.Agishi T, Yamashita N, Ota K. Clinical results of direct charcoal hemoperfusion for endogenous and exogenous intoxication. In: Sidemen S, Chang TMS, editors. Hemoperfusion, Part I. Washington, DC, USA: Hemisphere; 1980. pp. 255–263. [Google Scholar]
- 22.Gu KF, Chang TMS. Conversion of alpha-ketoglutarate into L-glutamic acid with urea as ammonia source using multienzyme system and NAD immobilized by microencapsulation with artificial cell in bioreactor. Biotechnology and Bioengineering. 1988;32:363–368. doi: 10.1002/bit.260320315. [DOI] [PubMed] [Google Scholar]
- 23.Gu KF, Chang TMS. Conversion of urea or ammonia into essential amino acids, L-leucine, L-valine and L-isoleucine using artificial cells containing an immobilized multienzyme system and dextran-NAD: yeast alcohol dehydrogenase for enzyme recycling. Journal of Applied Biochemistry and Biotechnology. 1991;12:227–236. [PubMed] [Google Scholar]
- 24.Cattaneo MV, Chang TMS. The potential of a microencapsulated urease-zeolite oral sorbent for the removal of urea in uremia. Transactions of American Society for Artificial Internal Organs. 1991;37(2):80–87. [PubMed] [Google Scholar]
- 25. http://jb.asm.org/cgi/content/full/186/9/2520.
- 26.Chang TMS. Semipermeable microcapsules. Science. 1964;146(3643):524–525. doi: 10.1126/science.146.3643.524. [DOI] [PubMed] [Google Scholar]
- 27.Chang TMS. Semipermeable aqueous microcapsules. Montreal, Canada: McGill University; 1965. Ph.D. thesis. [Google Scholar]
- 28.Chang TM, MacIntosh FC, Mason SG. Semipermeable aqueous microcapsules. I. Preparation and properties. Canadian Journal of Physiology and Pharmacology. 1966;44(1):115–128. doi: 10.1139/y66-013. [DOI] [PubMed] [Google Scholar]
- 29.Meriwether LS, Kramer HM. In vitro reactivity of oxystarch and oxycellulose. Kidney International, Supplement. 1976;(7):S259–265. [PubMed] [Google Scholar]
- 30.Prakash S, Chang TMS. Artificial cells and genetically engineered microencapsulated for E. coli cells, for urea and ammonia removal. Methods in Molecular Biology. 1996;23:343–357. doi: 10.1385/0-89603-481-X:343. [DOI] [PubMed] [Google Scholar]
- 31.Iseki K, Oshiro S, Tozawa M, Iseki C, Ikemiya Y, Takishita S. Significance of hyperuricemia on the early detection of renal failure in a cohort of screened subjects. Hypertension Research. 2001;24(6):691–697. doi: 10.1291/hypres.24.691. [DOI] [PubMed] [Google Scholar]
- 32.Wu X, Wakamiya M, Vaishnav S, et al. Hyperuricemia and urate nephropathy in urate oxidase-deficient mice. Proceedings of the National Academy of Sciences of the United States of America. 1994;91(2):742–746. doi: 10.1073/pnas.91.2.742. [DOI] [PMC free article] [PubMed] [Google Scholar]
- 33.Hirayama K, Rafter J. The role of lactic acid bacteria in colon cancer prevention: mechanistic considerations. Antonie van Leeuwenhoek. 1999;76(1–4):391–394. doi: 10.1007/978-94-017-2027-4_25. [DOI] [PubMed] [Google Scholar]
- 34.Guarner F. Enteric flora in health and disease. Digestion. 2006;73:5–12. doi: 10.1159/000089775. [DOI] [PubMed] [Google Scholar]


