

Abstract
Lycopene, the red pigment of tomatoes, is a carotenoid with potent antioxidant properties. Although lycopene might function as a prostate cancer chemoprevention agent, little is known about its effects at the cellular level. To define general changes induced by treatment of cells with lycopene, and to gain insights into the possible chemoprevention properties of lycopene, we investigated changes in protein expression after lycopene treatment in human LNCaP cells. The high throughput proteomics data were then visualized and analyzed by novel biological protein pathway modeling software. Differentially expressed proteins were identified, and the data were analyzed by protein pathway simulation software without need for specialized programming by importing pathway models from a number of sources or creating their own. One notable outcome was the identification of a group of upregulated proteins involved in detoxification of reactive oxygen species. This finding suggests that a possible mechanism of lycopene chemoprevention is the stimulation of detoxification enzymes associated with the antioxidant response element. Novel biological pathway modeling software enhances analysis of large proteomics data. When applied to the analysis of proteins differentially expressed in prostate cancer cells upon treatment with lycopene, the upregulation of detoxification enzymes was identified.
Keywords: detoxification enzymes, ICAT, LNCaP, lycopene, teranode
Introduction
Lycopene, the red pigment of the tomato, β-carotene, and lutein are the three most abundant carotenoids in the human diet. Out of more than 600 natural carotenoids, lycopene is the most efficient singlet oxygen quencher and therefore a potent antioxidant [1]. Although twice as efficient as β-carotene at quenching singlet oxygen, lycopene has no provitamin A activity, so that its potential pharmacological effects cannot be associated with vitamin A [2]. Since lycopene is a potent antioxidant, its anticancer activity might be the result of chemoprotection from oxidative stress, which results from an imbalance in the prooxidant/antioxidant ratio in favor of the oxidants [3]. Numerous epidemiological studies have been carried out to address the question of which component(s) of dietary fruits and vegetables is most responsible for the cancer prevention effects of these foods. Overall, these studies suggest that dietary intake of carotenoids is inversely correlated with the incidence of many forms of cancers, and lycopene in particular is indicated for the prevention of certain of these types of cancer. In 1995, Giovannucci and co-workers reported results of a single dietary assessment with follow-up of 51,529 male health professionals among whom 773 developed prostate cancer over a six-year period [4]. They found an association between higher intake of lycopene and tomato products and lower risk of prostate cancer. Clinton and co-workers measured lycopene in a variety of human tissues and found that lycopene is concentrated selectively in human prostate [5]. These statistically significant findings all suggest that lycopene shows promise as a prostate cancer chemopreventive agent. However, very little is understood about the biological mechanisms for accumulation of lycopene, its sub-cellular distribution, and its eventual metabolism [6].
Our preliminary studies have indicated that lycopene produces moderate inhibition of proliferation of androgen dependent prostate cancer cells [7] and is selectively concentrated in LNCaP cells compared to the androgen independent cell lines DU145 and PC-3. Androgens play a central role in the development and maintenance of the male genitalia, spermatogenesis, and secondary sexual characteristics [8], and disruption of androgen receptor signaling by surgical or pharmacological castration has been used as front-line treatment of prostate cancer since the 1940's, resulting in tumor regression in 75% of cases [9]. Although prostate cancer tumors usually regress upon androgen ablation, the tumor usually acquires androgen independence after a median duration of 12–15 months and progresses until a fatal outcome. Following escape from androgen ablation, androgen receptor (AR) and some androgen mediated gene expression (i.e. prostate specific antigen) are retained in a large proportion of androgen independent cancer recurrences which suggest that alterations of AR pathways are critical in prostate cancer disease progression.
Based on transcriptome data in rats treated with lycopene, Herzog et al. [10] have suggested that lycopene might function as a prostate cancer chemoprevention agent through an anti-androgen effect. We tested this hypothesis by investigating possible interactions of lycopene with androgen regulated pathways. Here, we report sub-cellular effects of lycopene on protein expression in LNCaP and androgen-depleted LNCaP cells, and androgen-related pathway interactions of lycopene to define possible mechanisms of lycopene prevention of prostate cancer. Advancement in experimental technologies has resulted in large-scale data production and need for software tools to process, analyze, and visualize high-throughput data. A special need remains for software that is able to integrate quantitative expression measurements in molecular networks and to annotate putative functions in a large biological system. To facilitate the analysis of large proteomics data sets acquired in this study, the high throughput proteomics data were analyzed and visualized by using novel biological protein pathway modeling software.
Materials and Methods
LNCaP cell culture and sub-cellular fractionation
Cell culture and liposomal lycopene delivery to cells growing in culture were described previously, except that the final concentrations of the liposome constituents in the cell culture medium were as follows: 100 µM monoolein, 33 µM oleic acid, 17 µM 1-α-phosphatidylcholine, 1.5 mM sodium taurocholate, and 0.2 µM lycopene [7]. Briefly, LNCaP cells were grown in RPMI 1640 medium modified to contain 2 mM L-glutamine, 1.5 g/L sodium bicarbonate solution, 10 mM HEPES, 1.0 mM sodium pyruvate, 4.5 g/L glucose, 1% antibiotic-antimycotic, and 10% FBS. Androgen-depleted LNCaP cells were grown under the same conditions as the LNCaP cells, except that the medium contained 5% fetal calf serum depleted of steroids by treatment with dextran-coated charcoal (0.1% dextran and 1% charcoal), as described previously [11]. Cells were counted and plated into 150 cm2 flasks. After 48 h, the culture medium was replaced with medium containing 0.2 µM lycopene solublized by liposomes (treatment) or liposomes alone (placebo control). After another 48 h incubation, the medium was removed, and the cells were harvested (107–108 cells) and centrifuged at 1,000 rpm for 5 min. Sub-cellular fractions of LNCaP cells were prepared according to a published protocol with minor modifications [12]. Briefly, pellets (control or treatment) were resuspended with ice-cold PBS, and the packed cell volume was determined. The cells were lysed in 2 packed cell volumes of hypotonic buffer containing 20 mM Tris pH 7.5, 5 mM MgCl2, 5 mM CaCl2, 1 mM dithiothreitol (DTT), 1 mM EDTA, and protease inhibitor cocktail, and then incubated on ice for 15–30 min. The cells were Dounce homogenized (20–30 strokes), and the crude nuclear pellet was collected by centrifugation at 3000 rpm for 15 min at 4°C. The supernatant containing the cytosolic and membrane proteins was ultracentrifuged at 100,000g for 3 h. The resulting microsomal pellet was solublized and stored at −80 °C until use, and the supernatant containing the cytosolic proteins was frozen at −80 °C until use. The crude nuclear pellet was resuspendedm on ice in 0.5 nuclear volumes of low salt buffer containing 20 mM Tris (pH 7.5), 5 mM MgCl2, 20 mM KCl, 1 mM DTT, 1 mM EDTA, and protease inhibitor cocktail. While the nuclei were on ice, 0.5 nuclear volumes of high salt buffer containing 20 mM Tris (pH 7.5), 5 mM MgCl2, 1.2 M KCl, 1 mM DTT, 1 mM EDTA, and protease inhibitor cocktail, was slowly added to solublize nuclear proteins. The suspension was centrifuged at 25,000g for 30 min at 4 °C to pellet nuclear debris. The supernatant (nuclear extract) was saved and stored at −80 °C until use.
Quantitative proteomic analysis
Aliquots of protein solutions (containing 500 µg protein each) from lycopene treated and control cell fractions were used for labeling using a Cleavable ICAT™ Reagent Kit (Applied Biosystems, Foster City, CA). Briefly, the protein mixture was denatured in the presence of 0.05% SDS, 5 mM EDTA, 200 mM Tris-HCl (pH 8.3), and 6 M urea, and then reduced in 5 mM TCEP-HCl for 30 min at room temperature. Isotopically heavy or light ICAT reagent was added to a final concentration of 1.75 mM, and the samples were incubated for 2 h at 37 °C. The labeling reaction was quenched by adding 12 mM DTT for 5 min at room temperature. Samples were combined, and the urea concentration was reduced to 1 M. The samples were digested with trypsin (sequencing grade modified, 1:50 w/w, Promega, Madison, WI) overnight at 37 °C. Each trypsinized sample was diluted with an equal volume of Buffer A (5 mM KH2PO4, 25% CH3CN), and the pH was adjusted to 3 with 10% H3PO4. Peptides were fractionated by using SCX cation-exchange cartridges (Applied Biosystems). Six fractions were collected and the labeled peptides were purified over monomeric avidin cartridges (Applied Biosystems). The peptides were eluted with 0.4% trifluoroacetic acid in 30% CH3CN, and dried under reduced pressure. The biotin tag was cleaved from the peptides in 95% reagent A and 5% reagent B (Applied Biosystems) before mass spectrometry. Each sample was analyzed by microcapillary HPLC-electrospray tandem mass spectrometry (µLC-ESI-MS/MS) using an LCQ-DECA mass spectrometer (Thermo Electron, San Jose, CA) and a Thermo LTQFT linear ion trap-Fourier Transform ion cyclotron resonance mass spectrometer [13]. A total of 12 ICAT samples were analyzed (Table 1).
Table 1.
List of ICAT experiment combinations. Each experiment was repeated once, and 12 total ICAT samples were analyzed. For an example, ICAT1 indicates the combination of heavy or light isotope labeled lycopene treated and placebo treated membrane proteins from the androgen-depleted LNCaP cells.
| Experiment* | Placebo | Lycopene | Androgen | Sub-cellular fraction |
|---|---|---|---|---|
| ICAT1 | + | + | − | membrane |
| ICAT2 | + | + | − | cytosol |
| ICAT3 | + | + | − | nucleus |
| ICAT4 | + | + | + | membrane |
| ICAT5 | + | + | + | cytosol |
| ICAT6 | + | + | + | nucleus |
repeated
High-throughput data analysis and visualization by Teranode® Design Suite
The data were analyzed by novel protein pathway modeling software developed in collaboration with Teranode Corporation (Seattle, WA). The Teranode® Design Suite (TDS, http://www.teranode.com/) enabled the visualization and analysis of experimental data in the context of a biological system without need for specialized programming by importing pathway models from a number of sources or creating their own. For this study, a repository of KEGG pathway models for Homo sapiens was constructed using KEGG API 6.0. The data were imported using a KEGG importer that is developed for KEGG API in the TDS. Proteomics data (protein name and the expression value, etc.) were integrated from Excel files to map the pathways and networks involved. The mapping between proteins and pathways was carried out by mapping the UniGene ID of the proteins from our data to the KEGG pathway models. A pathway graph is shown with molecules (nodes) and intermolecular interactions (edges) in between the nodes (Figure 1). The proteins and their expression values were mapped to nodes in the pathways. Different node colors indicate protein expression changes in lycopene treatment in which red is repressed and the green is induced through yellow as the midpoint. A number of different visual properties such as node color and shape as well as edge color and style represent different classes and stages of molecules and interactions. A search function to find pathway models in databases facilitated rapid screening of the entire KEGG database within a few seconds and visualization of a complex system in one integrated window. A property import function automatically generated mathematical models, integrated experimental data, and produced corresponding nodes and edges for comprehensive quantitative analysis in one streamlined application.
Figure 1.


Teranode® Design Suite biological protein pathway modeling process. (a) The proteomics data are used to search against entire pathway networks available via find tools. The search is complete with the list of pathways mapped by the input proteomics data; a selected example of insulin signaling pathway is shown. (b) The insulin signaling pathway is shown on the right with nodes and edges, and the identified proteins are colored in turquoise. Property values (i.e. protein expression values) are imported via the menu system; and (c) property annotations are listed by the nodes or displayed in a separate window. Expression changes are color scaled representing reduced to induced by red to green, respectively. (d) Enlarged area view of identified proteins in the insulin signaling pathway is shown.
Results and Discussion
Androgen-sufficient and androgen-depleted LNCaP cells treated with lycopene or placebo were fractionated into three compartments, membrane, nucleus, and cytosol. Lycopene and placebo treated samples were combined and a total of 12 ICAT experiments were carried out to compare differential expression between placebo-treated vs. lycopene-treated LNCaP cells from each cell compartment (Table 1). The samples were analyzed once by LCQ and once by LTQFT.
Differentially expressed proteins in sub-cellular locations induced by lycopene
Quantitative proteomic analysis was used to screen for changes in protein expression in nuclear, total membrane and cytosol fractions of LNCaP cells. Relative quantification between cells treated with lycopene or placebo was carried out using cysteine-specific isotope coded affinity tags (ICAT) [14]. Statistical modeling algorithms to compute probabilities associated with peptide (PeptideProphet™) and protein (ProteinProphet™) [15] sequence assignments that distinguish correct from incorrect database search results were used to validate the search results. These tools assign probabilities to all identifications and offer standardized interpretation of the results. While all statistical models are imperfect, ProteinProphet reasonably estimates confidence in protein identification and has been cited by 175 refereed publications (according to google scholar). Further, our internal experiments comparing ProteinProphet and reverse database searching show that ProteinProphet identifies 5% more proteins at a set false positive rate (unpublished data). In this study, proteins were tallied with a probability of at least 0.5, (meaning that, according to the statistical model, the sequence match given has 50% probability of being correct) and mass spectra were visually inspected. Differential expression was gauged by Automated Statistical Analysis on Protein Ratio (ASAPRatio) which calculated the relative abundances of proteins and the corresponding confidence intervals [16] or by XPRESS software which calculated the relative abundance of proteins by reconstructing the light and heavy elution profiles of the precursor ions and determining the elution areas of each peak [17].
This process resulted in the identification of differentially expressed proteins in each sub-cellular compartment of the LNCaP cells with false-positive rate of 3.1 – 4.7 % (Table 2). The data in Table 2 indicate that lycopene induced the largest number of changes in protein expression in the nucleus of LNCaP cells. This is consistent with our observation that lycopene accumulates selectively in the nucleus (50%) of LNCaP cells followed by the nuclear matrix (20%) (unpublished data). Although not conclusive, these data are consistent with the hypothesis that lycopene causes a selective increase in the transcription of nuclear proteins. In the case of androgen-depleted LNCaP cells, the greatest number of changes in protein levels occurred in the cell cytosol. These changes might be due to hormone deprivation instead of lycopene treatment, since there were only a few differentially expressed proteins shared by the nuclear fractions from LNCaP and androgen-depleted LNCaP cells.
Table 2.
The numbers of differentially expressed proteins by lycopene treatment in the presence or absence of androgen in the LNCaP cells. Different isotope labeled lycopene treated and placebo treated samples were combined, and then differential expression was measured by the ratio of two samples. The condition of LNCaP cells, each sub-cellular compartment (total membrane, cytosol, and nucleus), number of differentially identified proteins corresponding to each sub-fraction, and false positive rate are listed in the 1st, 2nd, 3rd, and 4th column.
| Lycopene and placebo LNCaP cells |
Sub-cellular compartments |
Number of proteins* | False positive rate** |
|---|---|---|---|
| Androgen-sufficient | membrane | 67 | 4.70 % |
| cytosol | 70 | 3.90 % | |
| nucleus | 104 | 3.40 % | |
| Androgen–depleted | membrane | 36 | 3.50 % |
| cytosol | 165 | 3.40 % | |
| nucleus | 159 | 3.10 % | |
Protein probability > 0.5 and pvalue<e−02 are reported.
ProteinProphet® predicted error rate
The differentially expressed proteins were used to test how well the cellular factions were separated. The proteins in each cellular compartment were compared to all others to search for those proteins shared by two or more cellular fractions. Figure 2 shows that only a small number of proteins were shared by two or more different cell compartments indicating that cell fractionation into the nuclear, cytosolic and membrane proteins was satisfactory. The complete list of differentially expressed proteins can be found in Supplementary file 1.
Figure 2.

The numbers of differentially expressed proteins identified in each sub-cellular compartment and proteins found in more than one compartment are indicated. M: membrane; C: cytosol; N: nucleus.
Interaction with androgen metabolism pathways
In order to test our hypothesis that lycopene might exert its effects through the AR and to determine the effects of lycopene on AR related pathways, expression changes in proteins that are involved in androgen metabolism were investigated. KEGG human androgen and estrogen metabolism pathways, and the steroid hormone metabolism pathway were searched against our proteomics data to identify proteins involved in androgen and hormone metabolism. The search identified peroxisomal multifunctional enzyme type 2 (MFE-2), a bifunctional enzyme that acts on the peroxisomal oxidation pathway for fatty acids and catalyzes the formation of 3-ketoacyl-CoA [18]. This enzyme is present in many tissues, with the highest concentrations in liver, heart, prostate, and testis [19]. This enzyme was over-expressed by 2× and 9× fold in the presence of lycopene in the nuclear and membrane compartment of the androgen-depleted LNCaP cells, respectively. MFE-2 was also found in other sub-cellular compartments of LNCaP cells with less significant differential expression.
However, the identification of only one androgen related protein in our proteomics data does not support the hypothesis that lycopene might affect androgen regulation or action in LNCaP cells. This result is also in contrast to a recently published microarray study reporting that lycopene reduces several androgen metabolizing enzymes in normal rat prostate tissues [10]. However, microarray and proteomics results are not always in agreement [20], and rat biology might exhibit different expression patterns from that of humans. In addition, while ICAT methodology with µLC-ESI-MS/MS analysis on the LCQ and the FTICR mass spectrometers is a powerful approach for profiling proteomes, there are certain limitations to this approach which includes the detection of primarily high abundance proteins.
Induction of detoxifying enzymes by lycopene
Oxidative stress can result in oxidative damage to lipids, proteins, and DNA within cells. The most important oxidants responsible for oxidative stress are free radicals and other reactive oxygen species (ROS), which can be formed as a result of exposure to toxic agents such as chemotherapeutic drugs, cigarette smoke or by inadequate dietary consumption of antioxidants [21]. Oxidative stress can contribute to aging, arteriosclerosis, rheumatoid arthritis, and cancer [21]. Therefore, one possible cancer chemoprevention mechanism of lycopene might be to protect cells from oxidative damage as a potent antioxidant.
In support of this chemoprevention mechanism of action, several detoxification proteins were found to increase in expression in LNCaP cells as a result of lycopene treatment including epoxide hydrolase 1 (EPHX1), superoxide dismutase-1 (SOD-1), catalase (CAT), and the metal binding protein transferrin (TF) (Table 3). EPHX1 was over expressed in nuclear fraction of lycopene treated androgen sufficient LNCaP cells. EPHX1 is a membrane-bound protein which catalyzes the hydrolysis of arene and aliphatic epoxides to less reactive dihydrodiols [22]. SOD1 was also over-expressed in the nucleus and the cytosolic fraction of LNCaP cells treated with lycopene. SOD1 is usually found in the cytoplasm and destroys radicals that are produced within the cells during normal physiological functions and in response to exposure to environmental factors such as exposure to xenobiotic compounds or their metabolites that induce redox cycling and oxidative stress [23]. Serotransferrin was also found to be overexpressed in nuclear fraction of lycopene treated LNCaP cells. Transferrins are iron binding transport proteins that are responsible for the transport of iron from sites of absorption and heme degradation to those of storage and utilization [24]. Transferrins can bind excess iron that might otherwise induce oxidative stress through Fenton-type reactions. Serum transferrin is a secreted protein and might also have a role in stimulating cell proliferation [25]. A similar protein expression pattern was observed in the androgen-depleted LNCaP cells. Expression of EPHX1 in the nucleus and CAT in the cytosolic fraction was increased significantly by lycopene treatment. CAT is known to be a peroxisomal protein, which serves to protect cells from the toxic effects of hydrogen peroxide [26].
Table 3.
Detoxifying proteins induced by lycopene in LNCaP and androgen-depleted LNCaP cells. Protein name, gene name, human International Protein Index (ipi) database number, ProteinProphet™ probability, location where protein was identified, and normalized expression ratio of lycopene treated over placebo control are listed.
| LNCaP | |||||
|---|---|---|---|---|---|
| Protein | Gene | ipi | Probability | Sub-cellular Location |
Express ratio mean (lyc/pb)* |
| Epoxide hydrolase 1 | EPHX1 | IPI00009896 | 1 | nucleus | 1.08 ± 0.06 |
| Superoxide dismutase 1 | SOD1 | IPI00218733 | 1 | nucleus | 1.53 ± 0.00 |
| Serotransferrin precursor | TF_ | IPI00022463 | 0.93 | nucleus | 1.14 ± 0.00 |
| Superoxide dismutase 1 | SOD1 | IPI00218733 | 1 | cytosol | 1.06 ± 0.10 |
| Androgen-depleted LNCaP | |||||
|---|---|---|---|---|---|
| Protein | Gene | ipi | Probability | Sub-cellular Location |
Express ratio mean (lyc/pb)* |
| Epoxide hydrolase 1 | EPHX1 | IPI00009896 | 0.98 | nucleus | 4.46 ± 0.00 |
| Catalase | CAT | IPI00465436 | 1 | cytosol | 6.41 ± 0.78 |
| Superoxide dismutase 1 | SOD1 | IPI00218733 | 1 | cytosol | 1.08 ± 0.17 |
Protein probability>0.5 and pvalue<e−01 are reported.
There have been increasing numbers of reports suggesting that the role of androgen in prostate cancer maybe related to oxidative stress as androgen increases the level of ROS in LNCaP cells [27]. Our data show moderate induction of detoxification proteins by lycopene in androgen-sufficient LNCaP cells and significant elevation of EPHX1 and CAT in androgen-depleted LNCaP cells. In the androgen-sufficient LNCaP cells, the level of detoxification proteins may have been already elevated by androgen and thus only moderate changes were induced by lycopene where as higher levels of such proteins were induced by lycopene in the absence of the androgen. Although definite conclusions cannot be stated due to relatively small number of identified detoxification proteins, our data suggest that a possible chemoprevention mechanism of lycopene is to stimulate synthesis of detoxification enzymes in prostate cells to defend them against free radicals and superoxide formation. Transcription of these proteins is coordinately regulated through the antioxidant response element (ARE) involving more than two dozen genes. The ARE pathway activates a group of defensive genes in response to oxidative stress [28–31]. A reconstructed antioxidant regulation pathway of detoxifying proteins is illustrated in Figure 3.
Figure 3.
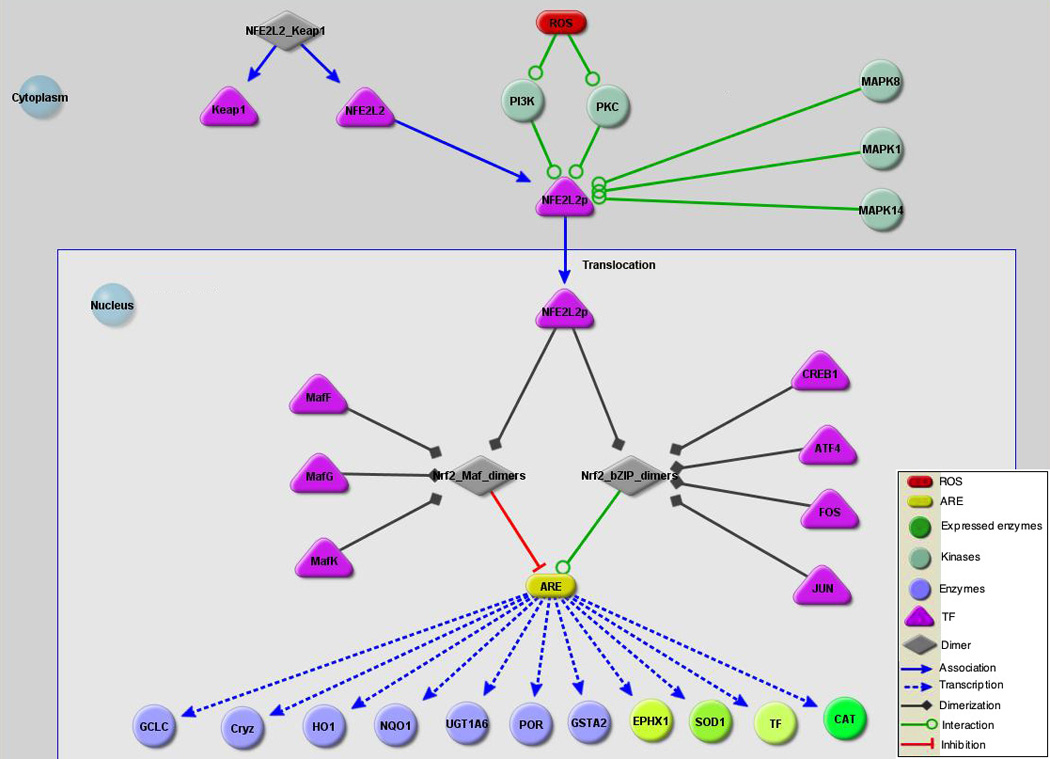
A reconstructed antioxidant regulation pathway of detoxifying proteins. Reactive oxygen species (ROS) such as electrophiles, drugs, xenobiotics and antioxidants can trigger oxidative stress that can damage cells. The Phase II detoxification enzymes detoxify the ROS to reduce cellular stress together with other enzymes that also scavenge superoxide to protect cells. Expression of these genes is coordinately regulated through antioxidant response elements (AREs) and ARE-binding transcription factors. NF-E2-related factor 2 (Nrf2) and Nrf1 are transcription factors that bind to AREs of these genes and activate transcription. In the cytosol, Nrf2 remains inactive forming a dimer with the cytoskeletal protein Keap1. Protein kinases and Map kinases activate Nrf2 and phosphorylated Nrf2 is translocated into the nucleus. In the nucleus, Nrf2 interacts with transcription factors in the bZIP family, including CREB, ATF4 and Fos or Jun and bind to AREs to activate expression of genes involved in detoxification. Nrf2 activation of genes is counterbalanced by interacting with Maf proteins, including MafG and MafK, to maintain the oxidation level of the intracellular environment. Protein expression changes induced by lycopene treatment are indicated by red (repressed) or green (induced). Over-expression of EPHX1, SOD-1, CAT, and TF, the four lycopene induced proteins identified from our study, were illustrated by different shades of green nodes based on expression values of LNCaP cells listed in the Table 3. CAT expression represents cytosol expression from androgen-depleted LNCaP cells.
Biological protein pathway modeling by TDS
Recent developments in proteomics technology make it possible to identify and quantitatively measure hundreds to thousands of proteins at once. However, systematic analysis of high-throughput expression data often creates challenges in rapid and effective screening for molecular interactions and integrating experimental measurements. TDS provided basic functions for rapid query screening of experimental data to search proteins involved in androgen metabolism pathways. It also allowed investigators to create their own ARE database and to use the proteins involved in such pathway to screen the expression data to facilitate rapid comparison and reconstruction of the pathway relevant to the experimental data. Other network analysis programs work best when used in conjunction with pre-existing protein-protein or protein-DNA interaction maps to navigate protein or gene interaction [32]. In contrast, the TDS works best when one has high-throughput (quantitative) data and only limited information concerning how the proteins function or interact. The TDS utilizes pre-existing protein-protein/DNA interaction networks and also imports pathway databases including KEGG. This feature facilitates the identification of pathways and interactions of proteins for almost any organism. However, the TDS is not open source (after a one-month trial period) which may limit its general use. Although different pathway databases might produce conflicting results, researchers should be able to integrate sufficient information from different database sources so as to draw a meaningful conclusion.
Concluding remarks
Our proteomic data indicate that lycopene affects protein expression predominantly in the nuclear compartment of the LNCaP cells. While no association between lycopene treatment and androgen metabolism was observed, a number of detoxifying proteins were detected, which stimulate the defensive mechanism in response to oxidative stress in LNCaP cells. The ICAT methodology and µLC-ESI-MS/MS provided large data sets for the evaluation of differential protein expression in the LNCaP cells as a result of lycopene treatment. However, the interpretation of these data posed a significant challenge that the data interpretation software helped address. The software offered a search function to find pathway models in databases given protein identifications from high-throughput experimental data and facilitated the pathway analysis and reconstruction. Furthermore, the software provided a comprehensive set of qualitative and quantitative analytics in one integrated application which streamlined the analysis by dynamically integrating experimental data and producing the required pathway models.
Supplementary Material
Sup_file_1(a). List of differentially expressed proteins in androgen-sufficient LNCaP cells. XLS file
Sup_file_1(b). List of differentially expressed proteins in androgen-depleted LNCaP cells. XLS file
Acknowledgements
This study was supported in full by National Institutes of Health grants: R01 CA101052 and R33 GM066461, and in part by the UW Center for ecogenetics and environmental health NIEHS grant P30ES07033, the UW WWAMI regional center of excellence for biodefense and emerging infectious disease, NIAID grant 1U54AI57141-01, R21 DK65260-01, and NCRR grant S10 RR17262-01. We thank Dr. Byron Gallis for critical reading of the manuscript.
Abbreviations
- AR
androgen receptor
- ARE
antioxidant response element
- ASAPRatio
Automated Statistical Analysis on Protein Ratio
- CAT
catalase
- EPHX1
epoxide hydrolase 1
- ipi
International Protein Index
- ICAT
isotope coded affinity tags
- MFE-2
multifunctional enzyme type 2
- Nrf2
NF-E2-related factor 2
- ROS
reactive oxygen species
- SOD-1
superoxide dismutase-1
- TF
transferring
- TDS
Teranode Design Suite
References
- 1.Di Mascio P, Kaiser S, Sies H. Arch Biochem Biophys. 1989;274:532–538. doi: 10.1016/0003-9861(89)90467-0. [DOI] [PubMed] [Google Scholar]
- 2.Conn PF, Schalch W, Truscott TG. J Photochem Photobiol B. 1991;11:41–47. doi: 10.1016/1011-1344(91)80266-k. [DOI] [PubMed] [Google Scholar]
- 3.Sies H. Oxidative Stress: Oxidants and Antioxidants. New York: Academic Press; 1990. Oxidative stress: Introduction. [Google Scholar]
- 4.Giovannucci E, Ascherio A, Rimm EB, Stampfer MJ, et al. J Natl Cancer Inst. 1995;87:1767–1776. doi: 10.1093/jnci/87.23.1767. [DOI] [PubMed] [Google Scholar]
- 5.Clinton SK, Emenhiser C, Schwartz SJ, Bostwick DG, et al. Cancer Epidemiol Biomarkers Prev. 1996;5:823–833. [PubMed] [Google Scholar]
- 6.Barber NJ, Barber J. Prostate Cancer Prostatic Dis. 2002;5:6–12. doi: 10.1038/sj.pcan.4500560. [DOI] [PubMed] [Google Scholar]
- 7.Xu X, Wang Y, Constantinou AI, Stacewicz-Sapuntzakis M, et al. Lipids. 1999;34:1031–1036. doi: 10.1007/s11745-999-0454-9. [DOI] [PubMed] [Google Scholar]
- 8.Zhou ZX, Wong CI, Sar M, Wilson EM. Recent Prog Horm Res. 1994;49:249–274. doi: 10.1016/b978-0-12-571149-4.50017-9. [DOI] [PubMed] [Google Scholar]
- 9.Huggins H, Hughes CV. Cancer Research. 1941;1:293–297. [Google Scholar]
- 10.Herzog A, Siler U, Spitzer V, Seifert N, et al. Faseb J. 2005;19:272–274. doi: 10.1096/fj.04-1905fje. [DOI] [PubMed] [Google Scholar]
- 11.Chang GT, Blok LJ, Steenbeek M, Veldscholte J, et al. Cancer Res. 1997;57:4075–4081. [PubMed] [Google Scholar]
- 12.Rosenberg IM. protein analysis and purification. Benchtop techniques. Boston: Birkhauser; 1996. [Google Scholar]
- 13.Syka JE, Marto JA, Bai DL, Horning S, et al. J Proteome Res. 2004;3:621–626. doi: 10.1021/pr0499794. [DOI] [PubMed] [Google Scholar]
- 14.Gygi SP, Rist B, Gerber SA, Turecek F, et al. Nat Biotechnol. 1999;17:994–999. doi: 10.1038/13690. [DOI] [PubMed] [Google Scholar]
- 15.Goo YA, Yi EC, Baliga NS, Tao WA, et al. Mol Cell Proteomics. 2003;2:506–524. doi: 10.1074/mcp.M300044-MCP200. [DOI] [PubMed] [Google Scholar]
- 16.Li XJ, Zhang H, Ranish JA, Aebersold R. Anal Chem. 2003;75:6648–6657. doi: 10.1021/ac034633i. [DOI] [PubMed] [Google Scholar]
- 17.Han DK, Eng J, Zhou H, Aebersold R. Nat Biotechnol. 2001;19:946–951. doi: 10.1038/nbt1001-946. [DOI] [PMC free article] [PubMed] [Google Scholar]
- 18.Jiang LL, Kobayashi A, Matsuura H, Fukushima H, Hashimoto T. J Biochem (Tokyo) 1996;120:624–632. doi: 10.1093/oxfordjournals.jbchem.a021458. [DOI] [PubMed] [Google Scholar]
- 19.Adamski J, Normand T, Leenders F, Monte D, et al. Biochem J. 1995;311(Pt 2):437–443. doi: 10.1042/bj3110437. [DOI] [PMC free article] [PubMed] [Google Scholar]
- 20.Gygi SP, Rochon Y, Franza BR, Aebersold R. Mol Cell Biol. 1999;19:1720–1730. doi: 10.1128/mcb.19.3.1720. [DOI] [PMC free article] [PubMed] [Google Scholar]
- 21.Aruoma OI. Food Chem Toxicol. 1994;32:671–683. doi: 10.1016/0278-6915(94)90011-6. [DOI] [PubMed] [Google Scholar]
- 22.Skoda RC, Demierre A, McBride OW, Gonzalez FJ, Meyer UA. J Biol Chem. 1988;263:1549–1554. [PubMed] [Google Scholar]
- 23.Michiels C, Raes M, Toussaint O, Remacle J. Free Radic Biol Med. 1994;17:235–248. doi: 10.1016/0891-5849(94)90079-5. [DOI] [PubMed] [Google Scholar]
- 24.Yang F, Lum JB, McGill JR, Moore CM, et al. Proc Natl Acad Sci U S A. 1984;81:2752–2756. doi: 10.1073/pnas.81.9.2752. [DOI] [PMC free article] [PubMed] [Google Scholar]
- 25.Shapiro LE, Wagner N. In Vitro Cell Dev Biol. 1989;25:650–654. doi: 10.1007/BF02623636. [DOI] [PubMed] [Google Scholar]
- 26.Yasmineh WG, Theologides A. J Lab Clin Med. 1993;122:110–114. [PubMed] [Google Scholar]
- 27.Pathak SK, Sharma RA, Steward WP, Mellon JK, et al. Eur J Cancer. 2005;41:61–70. doi: 10.1016/j.ejca.2004.09.028. [DOI] [PubMed] [Google Scholar]
- 28.Dhakshinamoorthy S, Jaiswal AK. J Biol Chem. 2000;275:40134–40141. doi: 10.1074/jbc.M003531200. [DOI] [PubMed] [Google Scholar]
- 29.He CH, Gong P, Hu B, Stewart D, et al. J Biol Chem. 2001;276:20858–20865. doi: 10.1074/jbc.M101198200. [DOI] [PubMed] [Google Scholar]
- 30.Huang HC, Nguyen T, Pickett CB. Proc Natl Acad Sci U S A. 2000;97:12475–12480. doi: 10.1073/pnas.220418997. [DOI] [PMC free article] [PubMed] [Google Scholar]
- 31.Itoh K, Wakabayashi N, Katoh Y, Ishii T, et al. Genes Dev. 1999;13:76–86. doi: 10.1101/gad.13.1.76. [DOI] [PMC free article] [PubMed] [Google Scholar]
- 32.Shannon P, Markiel A, Ozier O, Baliga NS, et al. Genome Res. 2003;13:2498–2504. doi: 10.1101/gr.1239303. [DOI] [PMC free article] [PubMed] [Google Scholar]
Associated Data
This section collects any data citations, data availability statements, or supplementary materials included in this article.
Supplementary Materials
Sup_file_1(a). List of differentially expressed proteins in androgen-sufficient LNCaP cells. XLS file
Sup_file_1(b). List of differentially expressed proteins in androgen-depleted LNCaP cells. XLS file