Abstract
Polyurethane cationomers were synthesised in the reaction of 4,4’-methylenebis(phenyl isocyanate) with polyoxyethylene glycol (M = 2,000) or poly(tetrafluoroethyleneoxide-co-difluoromethylene oxide) α,ω-diisocyanate and N-methyl diethanolamine. Amine segments were built-in to the urethane-isocyanate prepolymer in the reaction with 1-bromobutane or formic acid, and then they were converted to alkylammonium cations. The obtained isocyanate prepolymers were then extended in the aqueous medium that yielded stable aqueous dispersions which were applied on the surfaces of test poly(tetrafluoroethylene) plates. After evaporation of water, the dispersions formed thin polymer coatings. 1H, 13C NMR and IR spectral methods were employed to confirm chemical structures of synthesised cationomers. Based on 1H NMR and IR spectra, the factors κ and α were calculated, which represented the polarity level of the obtained cationomers. The DSC, wide angle X-ray scattering and atom force microscopy methods were employed for the microstructural assessment of the obtained materials. Changes were discussed in the surface free energy and its components, as calculated independently according to the method suggested by van Oss–Good, in relation to chemical and physical structures of cationomers as well as morphology of coating surfaces obtained from those cationomers. Fluorine incorporated into cationomers (about 30%) contributed to lower surface free energy values, down to about 15 mJ/m2. That was caused by gradual weakening of long-range interactions within which the highest share is taken by dispersion interactions.
Keywords: Polarity of bonds, 1H and 13C NMR, IR spectroscopy, Surface free energy parameters by van Oss–Good method, Physical structures, WAXS and AFM methods, Glass transition temperature
Introduction
Fluorine-containing polymers, particularly polyurethanes (PU), have been attracting much attention recently, principally because of their superior chemical and biological stability [1]. The basic method for the synthesis of that type PUs is definitely based on introduction of fluorine into the flexible segment of the polyurethane chain, e.g. in the form of polytetramethylene glycol (PTMG-g-HFP), M n = 1,500) which has been partially fluorinated [2]. Functional perfluoropolyethers (PFPEs) are known as intermediates for the preparation of high performance PU coatings. In particular, Fomblins ZDOL PFPE as the OH-functionalized oligomers:
| 1 |
have a number of peculiar properties such as extremely low T g, low viscosity, excellent thermal and UV-light stability, insolubility and minimum surface energy [3, 4].
The possible structural modifications which involve the use of fluorinated derivatives of isocyanates were presented in [5]. Yet another route employ low-molecular-weight fluorinated chain extenders, which are non-typical compounds in many cases [6], or they go through the synthesis of copolymers with the use of polyurethane and fluoroacrylic polymer [7]. Fluorine, when introduced into PUs, improves their mechanical strength, which results from better phase separation induced by fluorine-containing segments, from considerable reduction in surface free energy of groups (high values of wetting angles) and from improved thermal stability due to C–F bonds which are more stable. An interesting concept was also developed which was based on the synthesis of water-dilutable, fluorinated, polyurethane anionomers [8]. Such elastomers are expected to be applicable inter alia in biocompatible implants [7, 9–11]. The fluorinated polyurethanes were obtained using hexamethylene diisocyanate and chain extender of 2,2,3,3-tetrafluoro-1,4-butanediol (TF) as the hard segment as well as various soft segments—polytetramethyl oxides with molecular weights of 650, 1,000; 1,400 and 2,000 [12]. These features are concluded to exert a major influence on the preliminary blood compatibility of TF-PUs compared with the effect of phase separation. Introduction of fluorine into polyurethanes leads to a reduction in platelet adhesion and activation. Increasing fluorine content by decreasing soft segment length promotes reduction in platelet adhesion and activation on polyurethane surfaces. In particular, the incorporation of fluorine into the polymer chain leads to larger changes in materials’ surface energy and phase-separated structure. These features are believed to have a significant effect on protein adsorption and subsequent coagulation events in blood/material interfacing systems. This low surface energy is applicable in particular to the field of cardiovascular prostheses [13].
Our paper follows that trend of research, although it covers in particular synthesis and investigation of surface properties of coatings which have been obtained from polyurethane cationomers. We have demonstrated earlier that it is possible to make considerable structural changes just in polyurethane cationomers in order to reduce polarity of the coatings produced therefrom [14, 15]. If we manage to add a desirable and valuable feature of improved thermal stability, then fluorinated cationomers may become interesting materials for the production of coatings and membranes for biomedical outlets [6, 16].
Experimental
Raw materials and reagents
Toluene-2,4-diisocyanate and toluene-2,6-diisocyanate (TDI; from Aldrich). The reagent was used as purchased.
| 2 |
Polyoxyethylene glycol (M n ≈ 2,000 g/mol; PEG; that product was dried under vacuum in nitrogen, at 120 °C, during 2 h)
| 3 |
N-Methyldiethanolamine (N-MDA; M = 119.16 g/mol; Aldrich)
 |
4 |
1-Bromobutane (M = 137.02 g/mol; Aldrich)
 |
5 |
Tetrahydrofurane (THF; from POCh S.A., Gliwice, Poland)
Formic acid (HCOOH), 99%, analytically pure (POCh S.A., Gliwice, Poland)
 |
6 |
Benzoyl chloride (C6H5COCl), 99%, analytically pure (POCh S.A., Gliwice, Poland)
Poly(tetrafluoroethyleneoxide-co-difluoromethylene oxide) α,ω-diisocyanate (PF) (M n = 3,000 g/mol; 2.8% of NCO groups; Aldrich)
| 7 |
Method for the synthesis of urethane cationomers
Cationomers were synthesised in a glass stand composed of: three-necked flask, heating bowl, mechanical agitator, dropping funnel, thermometer, reflux condenser and nitrogen supply nozzle.
Unmodified urethane cationomers (sample nos. 1 and 2)
As stage 1, urethane-isocyanate prepolymer was synthesised in the reaction of diisocyanate (B) and PEG (A):
 |
8 |
About 6.96 g (0.04 mol) of TDI and 0.01 g of benzoyl chloride were dissolved in 27 cm3 of THF which has been heated up to 50 °C. Then, 8.80 g (0.0044 mol) of PEG were added to that solution over about 10 min. Benzoyl chloride was added to inhibit the disadvantageous reaction which yielded allophanate structures. The content of –NCO groups in the isocyanate prepolymer amounted to about 7.8 wt.% after that stage.
At stage 2, the prepolymer was reacted with N-methyldiethanolamine (X):
 |
9 |
as a result of tertiary amino groups were incorporated into the polyurethane chains.
In order to do that, 4.19 g (0.035 mol) of N-MDA (dissolved in 20 cm3 of THF but only for sample no. 2) were added to the flask with the prepolymer BAB in it, at 50 °C, and the flask was maintained at that temperature over 30 min. After that time, the analysed content of –NCO groups was close to 0%.
Alkylammonium cations were produced at stage 3 by alkylation of tertiary amino groups from N-MDA with HCOOH (sample no. 1) or with butyl bromide C4H9Br (sample no. 2).
The amount in moles (0.0352 mol) of HCOOH (1.62 g) or C4H9Br (4.80 g) to be added to the mixture was adjusted to correspond to the number of moles of built-in tertiary amine contained in the known amount of the polymer. The mass fraction of NH+ or NR+ groups in so synthesised cationomers resulted from the stoichiometry:
The reaction with HCOOH or C4H9Br was conducted at 50 °C during 2 h, and then it was allowed to continue at ambient temperature during 24 h.
At stage 4, redistilled water (26.4 g) was added under intensive agitation conditions. That stage was intended not only to produce the dispersion; cationomer chains with the residual –NCO groups were subjected to extension at the same time in the reaction between groups –NCO and water:
| 10 |
where:
 |
-
b)
Fluorine-modified urethane cationomers (sample nos. 3 and 4)
Poly(tetrafluoroethyleneoxide-co-difluoromethylene oxide) α,ω-diisocyanate was used as type BAB prepolymer, thus the first stage could be reduced basically to dissolution of the purchased prepolymer in THF.
Stage 2 consisted in reacting the PF prepolymer with N-methyldiethanolamin.
In order to do that, 5 g (0.0017 mol) of PF and 0.01 g of benzoyl chloride were dissolved in 9 cm3 of THF which had been heated up to 50 °C and reacted with 0.1118 g (0.00094 mol) of N-MDA which had been dissolved in 2 cm3 of THF at 50 °C and over 30 min. Then, at the same temperature, the remaining amount of N-MDA, i.e. 0.1177 g (0.001 mol) in 2 cm3 of THF, was added and the reaction (9) was continued over another 60 min. After that time, the analysed content of –NCO groups was close to 0%. Stages 3 and 4 of the fluorine cationomers manufacturing process were the same as the production of the unmodified cationomers: cationomers were formed in the reaction of products (9) with HCOOH (0.0019 mol; 0.09 g; sample no. 3) or with C4H9Br (0.0019 mol; 0.260; sample no. 4) which were emulsified in water. The coatings were obtained in the same procedure as before.
The polymer content in the obtained dispersions amounted to about 21 wt.%. The polymer coatings for further tests were formed by applying the above-mentioned dispersions to a non-polar surface of poly(tetrafluoroethylene) (PTFE) and evaporation of water by air-drying at 20 °C. The coatings were then subjected to seasoning under such conditions over 10 days.
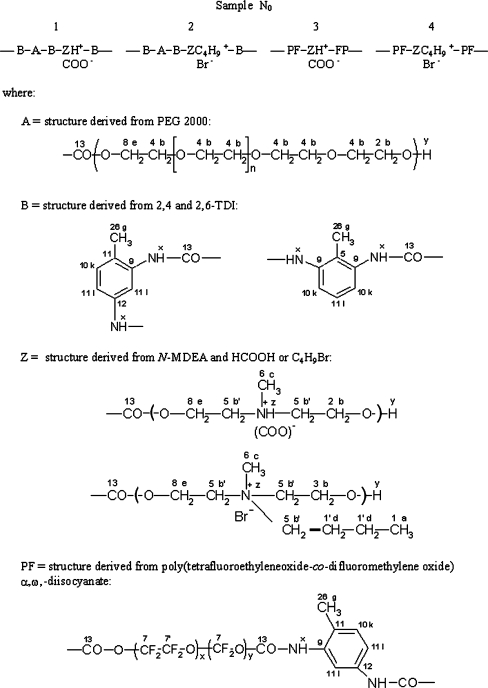
Structures of received cationomers were presented on Fig. 1. Protons occurring in these structures were indicated by letters and carbon atoms by numbers. Additionally information about synthesised polyurethanes was demonstrated on Table 1.
Fig. 1.
The polyurethane chains structure of the synthesised cationomers
Table 1.
Substrates for synthesised cationomers
Determination of –NCO group content
That determination involved a well-known method, and dibutylamine was used in the tests. Excess of unreacted amine was titrated with the HCl solution, and bromophenol blue was used as an indicator.
NMR spectroscopy
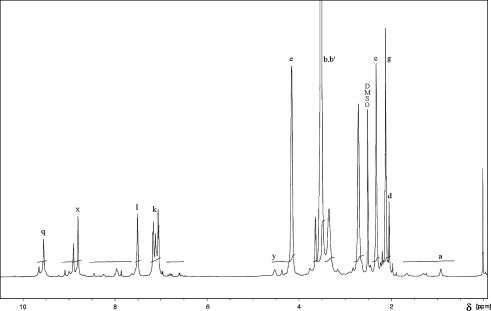
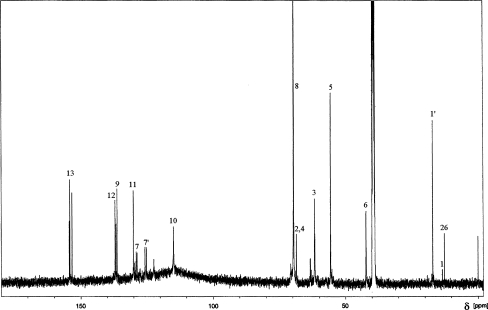
1H and 13C NMR spectra of the obtained polymers were taken with the use of the spectrometer FT NMR Bruker Avance 500 II. The samples of coatings (i.e. produced cationomers) were dissolved in DMSO-d6/h-DMSO and the solutions with the concentration of about 0.2 g/dm3 were prepared. TMS was used as a standard. For example, Fig. 2 presents the 1H spectrum and Fig. 3—13C NMR spectrum for cationomer no. 4. Proton spectra were employed additionally for the needs of comparative analysis of polarity of those cationomers, on the basis of the parameter κ which was defined especially for that purpose. That parameter was calculated from the values of integrated signals in 1H NMR spectra. The protons were distinguished: those representing polar and those representing apolar structural fragments which formed the chains of cationomers.
Fig. 2.
1H NMR spectrum for cationomer no. 4 synthesised with the use of PF diisocyanate prepolymer, PEG, N-MDA and C4H10Br
Fig. 3.
13C NMR spectrum for cationomer no. 4 synthesised with the use of PF diisocyanate prepolymer, N-MDA and C4H10Br
The factor κ was calculated in the way which was analogous to that defined in [14, 15]:
 |
11 |
where:
 |
12 |
makes the total for integrated signals recorded over a wide band of δ = 3.0–5.0 ppm for groups CH2 connected to partially polar ether groups CH2–CH 2 –O (subscript b on Fig. 2) which were present in PEG soft segments, for signals b’ from NH+ –CH 2, signals c from NH+–CH 3 groups, and signals e from –CH 2–O–CO–NH– groups connected directly to urethane groups. The signals y were also considered which represented incompletely converted groups –CH2–OH, and so were the signals x of polar groups NH in urethanes, urea compounds (x) and in allophanates (q).
The sum of integrations of signals generated by apolar structures:
 |
13 |
covers the signals within δ = 0.8–2.4 ppm, coming from protons in groups CH3 and CH2 of butyl bromide (designated as a and d), partially non-polar in CH 2 –CH 2–O designated as b in PEG, and in –CH2–CH 2–N designated as b’ in DMPA. The g signals were also included for the CH3 groups in 2,4- and 2,6-TDI and signals for aromatic protons (k, l) in two TDI isomers.
IR spectroscopy
IR spectra were taken with the spectrophotometer Paragon 1000 FT-IR, within 4,000–6,500 cm−1, with the use of ATR technique (the polymer film was placed between the prism walls). The obtained spectra were presented as the relation of transmittance [%] versus wave number  [cm−1]. These spectra were used for calculating the relative absorbance α for the bands connected with polar groups and the total absorbance of the bands for polar and non-polar groups:
 |
14 |
where;
 |
15 |
is the sum of absorbances measured at peak maximum values for polar groups within 3,200–3,490 cm−1, i.e. absorbances for valence vibrations of N–H in urethane and ureas (A 3200–3490), valence vibrations of C = O in urethane and ureas 1,680–1,720 cm−1 (A 1680–1720) and deformation vibrations of N–H in urethane group 1,530–1,540 cm−1 (A 1530–1540), vibrations of anions COO− (A 1643–1653), vibrations of C–O in ether groups (A 1222–1225) and hydroxyl groups in alcohols (A 1278–1281), as well as vibrations of C–N in amines (A 1180). On the other hand:
 |
16 |
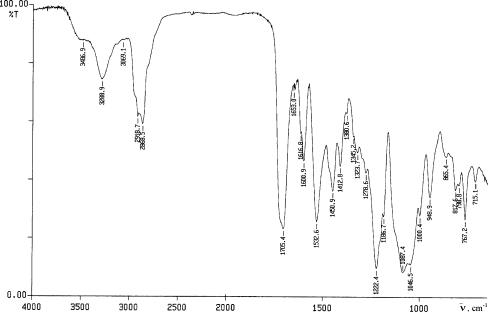
is the sum of absorbances measured at peak maximum values for non-polar groups, i.e. valence vibrations of C–H in alkyl groups 2,800–3,057 cm−1 (A 2800–3057) and principal bands, 1451–1457, 1504 and 1600–1602, for vibrations of C–C bonds in benzene rings (A 1451–1457, A 1504, A 1600–1602). Moreover, bands for vibrations of C–F in group CF2 (A 1255–1257) were also considered which were relatively well outlined in spectra for cationomers 3 and 4. All included analytical bands in the analysed IR spectra offered generally high intensities, which make it possible to assume that the values of their molar extinction factors ε are close to each other; hence they may be neglected in Eq. 14, which will become specific for the relative share of functional groups only. Figure 4 presents the example—IR spectrum for cationomer no. 2.
Fig. 4.
IR spectrum for cationomer no. 2 synthesised with the use of TDI diisocyanate, PEG, N-MDA and C4H10Br
Wide angle X-ray scattering analysis
The wide angle X-ray scattering (WAXS) investigations were performed at room temperature on a modified DRON-3-SEIFERT automated diffractometer. The radiation of CuKα and the nickel filter were employed. The operating conditions for the X-ray tube were as follows: 40 kV, 30 mA. X-ray diffraction patterns were taken within the range of 2θ from 1° to 60°, with a step scanning equal to 0.02° and at counting time of 10 s.
Study on cationomer coat surface form
Confocal microscopic analysis
The optical three-dimensional measurement system NANOFOCUS is a compact package for the measurement and material analysis. The nanometer precision resolution is based on innovative confocal Multi-Pinhole-Technology in combination with the piezo module. The objective lens used in the measurements sized between 1.6 × 1.6 mm and 260 × 260 µm. The image acquisition module from NANOFOCUS system is a fast digital camera with progressive scan technology, up to 55 fps, 512 × 512 pixel, 10 bit and firewire. The measurement pictures were taken for the objects 320 × 320 µm and with magnification 50× [17].
Atomic Force Microscopy
The atomic force microscope (Nanoscope III, Digital Instrument, USA) was employed to study superficial structures of the coating obtained from FP. The scans were taken at ambient temperature, in air and at tapping mode (TM) conditions, i.e. at direct contact between the sample surface and the tip. The pyramidal Si tip employed in the TM system had a spring constant of 20–80 N/m (Nanoprobe™). Each scan was presented in the following data formats:
topographic image (height, h), two-dimensional or three-dimensional
phase image (phase, p), which represented the phase lag for probe vibrations at the boundary between two media (due to friction of the probe/needle tip on the sample surface (friction, f) or axial deflection z of the probe/needle tip after it hits any surface irregularity (deflection, d)
Method for determination of components of surface free energy for solids
Physical parameters of surface energy of a solid γS were found in the present study on the basis of the van Oss–Good theory [18, 19]. This method, although procedure based on it requires using three measuring liquids for evaluating SEP of polymer materials, is proper more often than Neumann method. Admittedly, the last one is based on measurement of contact angle only with one measuring liquid, but theoretical justification is still arousing controversy [20]. The van Oss–Good model assumes that the surface free energy γS,L may be presented as a sum of two components:
 |
17 |
where:
- γLWS
surface energy connected with long-range interactions (dispersion, polar and induction interactions)
- γABS
surface energy connected with acid–base interactions, as results from the Lewis theory
Equation 17 is generally applicable both to a solid, marked with the subscript S, and to a wetting liquid (standard liquid or tested liquid), marked with the subscript L.
Let’s use the symbol γ+S for the component of γABS which is responsible for the surface free energy of the Lewis acid, and the symbol γ−S for the component representing the Lewis base. On the basis of the Berthelot theory, which assumes that interactions between molecules of different bodies located on a surface are equal to the geometric mean of interactions between molecules within each of those bodies, one can now formulate the following relations:
- for bipolar substances (liquids and surfaces of solids), which can be equivalent to synthesised PU ionomers—present in the form of aqueous dispersions or coatings:

18 -
for non-polar liquids and surfaces of solids (diiodomethane or PTFE):

19 (where: i = S—solid, L—liquid).
The surface free energy (SFE) parameters for solids (S) and for liquids (L) interacting with those solids should satisfy the equation of van Oss–Good:
 |
20 |
where Θ is the experimentally found wetting angle between a liquid drop and a solid surface under investigation. So, wetting angles Θ were first measured for the surfaces of cationomer coatings with the use of three model liquids (water, diiodomethane and formamide) with known parameters of γL, γLWL, γ+L and γ−L (Table 6), and then the Eq. 20 was used to calculate the values of γLWS, γ+S and γ–S for the studied cationomers. The values of γABS were calculated from the Eq. 18, while the values of γS—from the Eq. 17.
Table 6.
Experimental values of contact angles and parameters of FSE as calculated by van Oss–Good method for cationomer coatings
| Sample no. | Experimental values of contact angles Θ [°] | Parameters of FSE [mJ/m2] | |||||||||
|---|---|---|---|---|---|---|---|---|---|---|---|
| Model measuring fluids | |||||||||||
| CH2I2 | Standard deviation | Formamide | Standard deviation | Water | Standard deviation | γLWS | γ−S | γ+S | γABS | γS | |
| 1 | 42.98 | 1.33 | 61.97 | 1.17 | 77.85 | 0.79 | 33.282 | 0.025 | 13.819 | 1.176 | 34.5 |
| 2 | 51.66 | 0.15 | 68.44 | 0.17 | 85.78 | 0.24 | 29.143 | 0.071 | 7.967 | 1.504 | 30.6 |
| 3 | 79.26 | 0.25 | 84.63 | 0.16 | 89.01 | 0.48 | 15.662 | 0.020 | 16.586 | 1.152 | 16.8 |
| 4 | 84.21 | 0.18 | 88.31 | 0.24 | 99.85 | 0.11 | 13.453 | 0.326 | 4.948 | 2.540 | 16.0 |
The contact angles Θ were measured with the use of the method suggested by Zisman [21], i.e. by means of an optical goniometer (Cobrabid Optica—Warsaw) with a digital camera installed in axial extension of its lens. The liquid drops with the constant volume (about 3–5 μdm3) were applied to the surfaces of studied samples with the use of a special micropipette. The samples were fixed on the stage of the goniometer. The measurements were taken at 21 ± 1 °C. The values of contact angles were found from the geometric analysis of pictures taken for liquid drops, which involved the use of the original software developed by Kontrast (Pasłęk, Poland) for interpretation of the Young’s equation. The measuring errors for angles Θ come from two sources. The first of them results from different shapes of liquid drops placed on the investigated coatings and from possible interactions between the standard liquid and that subgrade, as well as from different liquid vaporisation rates observed when the pictures were taken. Nine drops were analysed each time which were placed on the surface simultaneously. Another source of potential errors is inaccuracy in graphical interpretation of the pictures with the use of the computer software. For each picture recorded (i.e. for each liquid drop), the geometrical shape analysis was repeated ten times: the extreme values were rejected and the arithmetic mean value was calculated for the accepted findings. The measured values of wetting angles and the components of the surface free energy for the cationomer coatings as derived from those measurements were presented in Table 6.
Thermal analysis by TGA and DTA methods
Thermal gravimetric analysis of the obtained PU cationomers involved the use of a TGA/DSC1 thermobalance from Mettler Toledo. TG; Δm/m = f(T), DTG; dm/dT = f(T); and DTA thermograms were recorded from which glass transition temperatures specific for rigid segments were derived. The measurements were taken within the temperature range of 30–500 °C, at a constant heating rate of 20°/min, in nitrogen.
Results and discussion
Chemical structure of cationomers
The chemical structures of the synthesised cationomers were verified on the basis of the 1H and 13C NMR spectra [22, 23]. The recorded NMR and IR spectra confirmed chemical structures of cationomers were presented on Fig. 1. Those spectra were provided with precise interpretations in [15], so they were not discussed in this paper. With our assumption, Eq. 12 presents the value which is proportional to the amounts of chemical structures with the dominant effect on polar interactions, and Eq. 13 represents non-polar interactions in the structures of synthesised cationomers. One may assume then that the value of the factor κ as calculated from Eq. 11 makes the physical characterisation of the polarity degree of a given cationomer. The data presented in Table 2 show that the values of the factor κ for the series of synthesised cationomers goes down from 54.81% to 50.35%, which results from the declining share of polar groups in successive cationomer structures. It should be noted that the values of κ as calculated for those cationomers are close to κ values for the cationomer structures which were obtained earlier from MDI and N-MDA (κ = 50.6%) and from TDI and N-MDA (κ = 50.3%) [15]. The κ values, however, which were determined earlier for the cationomer structures obtained from MDI and a number of various alkylethanoloamines, were clearly lower and they amounted to about 29.4–36.8%. That corresponds to the lower values of surface free energy for those cationomers [24]. In the case of polyurethanes containing fluorine the parameter IN, as defined by Eq. 13, does not represent apolar structures which result from the presence of groups CF2 in cationomers nos. 3 and 4. Having the above in mind, an attempt was made to find analogical criteria for polarity of the studied structures on the basis of IR spectra, just like in [24]. The data employed in calculations band, the obtained values of α by Eq. 14, were presented in Table 3. The parameter α, if defined in that way, may be found adequate for the assessment of polarity of fluorinated cationomers as well. When its values are analysed, a clear decline in the share of polar structures is observed for fluorinated cationomers nos. 3 and 4, while no decline in polarity is apparent for cationomers synthesised with the use of C4H9Br when compared to their counterparts which have been synthesised with the use of HCOOH. That effect became observable for higher alkyl bromides, and it made its contribution to the lower surface free energy values in cationomer coatings [25]. On the basis of received results, we can conclude that only complementary results obtained on the basis of 1H NMR and IR spectra allow estimation of the relative polarity of synthesised polymers and to compare received results with SFE parameters obtained based on measurements of contact angles.
Table 2.
Analysis of signal integration in NMR spectra of synthesised cationomers
| Sample no. | 1 | 2 | 3 | 4 |
|---|---|---|---|---|
| Integration (conventional unit) | ||||
| 0.5(Ib + Ib’) | 15.6195 | 15.3972 | 1.576 | 22.7407 |
| Ic | 3.8294 | 2.9512 | 0.8067 | 3.4996 |
| Ie | 6.0066 | 4.6950 | 0.7197 | 3.4319 |
| Iy | – | 0.4587 | – | 0.9010 |
| Ix + Iq + Iz | 3.3265 | 2.3895 | 1.000 | 6.0409 |
| I P | 28.782 | 25.8915 | 4.1024 | 36.6141 |
| 0.5(Ib + Ib’) | 15.6195 | 15.3972 | 1.576 | 22.7407 |
| Ia | – | 0.5820 | – | 0.7144 |
| Iw | – | 0.3111 | 3.886 | |
| Ig | 4.072 | 3.7700 | 0.8068 | 3.9641 |
| Ik | 3.0416 | 2.9328 | 0.4732 | 3.4844 |
| Il | 1.0000 | 1.5438 | 0.5640 | 1.3117 |
| I N | 23.7331 | 24.2258 | 3.7311 | 36.1013 |
| κ [%] | 54.807 | 51.662 | 52.237 | 50.352 |
Table 3.
Analysis of absorbance data for selected IR spectra of synthesised cationomers
| Sample no. | 1 | 2 | 3 | 4 |
|---|---|---|---|---|
Location and type of IR bands  (cm−1) (cm−1) |
Absorbance (conventional scale) | |||
| 3,200–3,490 N–H valence vibrations of urethane and ureas | 0.2872 | 0.2444 | 0.0466 | 0.0278 |
| 2,250–2,500 NH+ deformation vibrations | 0.0200 | 0.0286 | 0.0136 | 0.0315 |
| 1,680–1,720 C = O valence vibrations of urethane and ureas (I amide band) | 0.6113 | 1.2267 | 0.1648 | 0.1771 |
| 1,643–1,653 C = O ionic vibrations in COO– groups | 0.3052 | 0.3058 | 0.0704 | 0.0694 |
| 1,532–1,539 N–H deformation vibrations (II amide band of urethanes and ureas) | 0.6630 | 0.5888 | 0.1765 | 0.1078 |
| 1,222–1,224, 1,278–1,281 valence vibrations: C–OH in alcohols and C–O–C in ethers | 1.0963 | 1.0044 | – | – |
| 0.3990 | 0.3792 | |||
| 1,180 C–N vibrations in amines | 0.5821 | 0.5582 | 0.7222 | 0.4842 |
| A P | 3.9641 | 4.3361 | 1.1941 | 0.8978 |
| 2,800–3,057 valence vibrations of alkyl groups | 0.3225 | 0.4926 | 0.079 | 0.1021 |
| 1,600–1,602, 1,451–1,457 C–C vibrations in aromatic rings | 0.4526 | 0.3310 | 0.1108 | 0.0601 |
| 0.4707 | 0.4394 | 0.0915 | 0.0432 | |
| 1,255–1,257 Palence vibrations of C–F linkage in CF2 groups | – | – | 0.3687 | 0.2612 |
| A N | 1.2458 | 1.2630 | 0.6500 | 0.4666 |
| α | 76.089 | 77.443 | 64.752 | 65.802 |
Before interpretation of those findings is presented, it is necessary to discuss one additional issue, i.e. possible effects of the presence or absence and structure of crystalline phase and of interactions between rigid and soft segments within the crystalline and amorphous phases, on the measured contact angle values and on SFE parameters. Those effects may be enhanced by the presence of high amounts of hydrogen bonds, which are typical for polyurethanes and which are even more active in the case of polyurethane cationomers.
In order to throw more light on that question, glass transition temperature was measured for rigid urethane–urea segments which contained considerable amounts of fluorine in the case of samples nos. 3 and 4. Additionally, the nature of the orderly arrangement in the studied cationomers was compared on the basis of the WAXS analysis, and superficial microstructures of the obtained samples were analysed with the use of a confocal microscope and atom force microscopy (AFM). The results of those studies turned out much useful in interpretation of SFE measurement findings.
Glass transition temperature of polyurethane coatings
Introduction of a high number of fluorine atoms to cationomer chains which contain the anions COO− and/or Br− as counter ions, makes those structures much more rigid. That is revealed by increased glass transition temperatures for rigid segments by from 119 °C up to 155 °C (Table 1). A coat becomes much more rigid and brittle then. Such a critical decline in mechanical properties of the final coatings is disadvantageous for further applications of coated elements. Further studies should thus verify the effect of reduced fluorine amounts on increased flexibility of a polymer coating and whether that effect is accompanied by the loss of precious hydrophobic performance.
Solid state structure and stability of synthesised cationomers
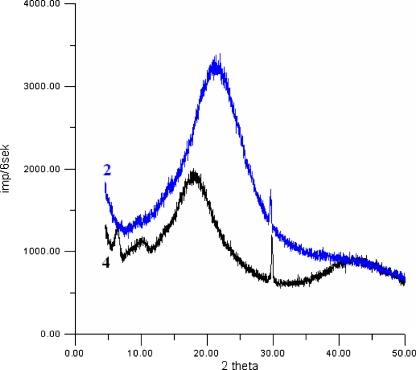
Supermolecular ordering of investigated cationomers was analysed by means of the WAXS method. X-ray diffraction patterns for two cationomers nos. 2 and 4 were shown in Fig. 5. As can be seen from that figure, the X-ray diffraction patterns for both samples show one broad peak which originates from amorphous structures of investigated cationomers. It is worth to notice that these broad peaks have maxima at different values of 2θ, which suggests differences in the structural arrangements of cationomers nos. 2 and 4. Adding to broad peaks in Fig. 5, one sharp peak is visible for both samples close to 2θ equal to about 30°. It means that both samples contain small amounts of crystallites. Theoretically, those crystallites could be formed by organic monomers or by inorganic compounds (NaCl or KCl) which were added when prepolymer PF was synthesised. That last suggestion is much more credible. In Fig. 5 for cationomer no. 4, two small but distinct peaks are visible in a small range of 2θ. The presence of these peaks and a smaller value of full width in half maximum of the amorphous peak for the sample no. 4 than for the sample no. 2 are indicative for a better ordered structure in the first sample.
Fig. 5.
WAXS diffraction pattern for cationomers nos. 2 and 4
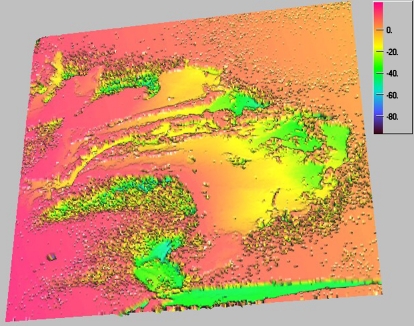
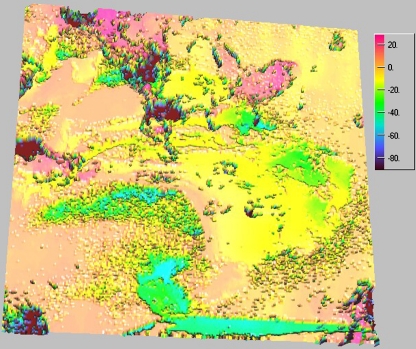
Although they are the scanned surface images, the surface was freely formed after evaporation of volatile substances from a cationomer dispersion applied to a completely apolar PTFE coating. Thus, the nature of that surface is completely representative for the amorphous and crystalline structures of the coat which were formed under those conditions and for the phase structure of cationomer which results from interactions between soft and hard segments [26, 27].
It should be mentioned that the images for cationomer 2 and cationomer 4 coatings, as obtained in the confocal microscope, were completely different from each other (Figs. 6 and 7). Cationomer no. 4 probably contains a higher share of hard phase which comes from rigid urethane–fluorine segments. And surface topography for sample no. 4 is definitely more diversified.
Fig. 6.
Image for coating obtained from cationomer no. 2, recorded under the confocal microscope
Fig. 7.
Image for coating obtained from cationomer no. 4, recorded under the confocal microscope
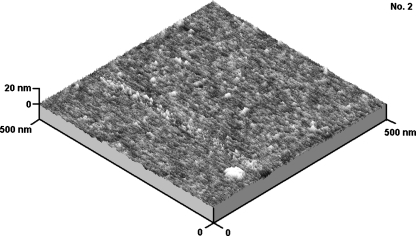
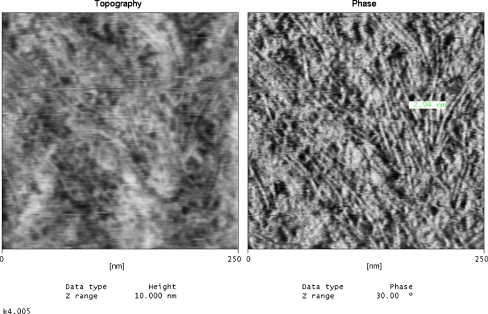
More interesting arrangements can be seen in AFM method. Figures 8 and 9 present AFM micrographs for cationomers nos. 2 and 4. What can be seen is strongly superior separation of phases in sample no. 4 as well as fragments of very thin fibrils which were formed within the hard phase. Images of the surface shape recorded with AFM method, visible on these micrographs phase inhomogeneity and on the basis of the results of the WAXS analysis, in our opinion, can assign received cationomers certain ability to create thermodynamic stable crystalline structures. That alone makes a proof for orderly arrangement of supermolecular structures. That fact may not be uninfluential on the energy performance of the sample which was quantitatively analysed by the van Oss–Good method. This method is reflecting long-range interactions (γLWS) and acid–base interactions (γABS) which the chemical structure of polyurethane chains and their orientation character in the range of domain built from soft and hard segments are deciding. Of course shouldn’t chemical structure of polymer in the aspect of it influence on surface properties overrate, because other factors connected with, e.g. the technique of producing polymer sample as the coating, fibre or the product about character of the polyurethane foam or the elastomer can perform. For the presented work it is essential that all analysed samples were obtained in the same way (Table 4).
Fig. 8.
Three-dimensional AFM 500 × 500 nm image for cationomer no. 2, obtained by the “moderate tapping” method
Fig. 9.
Topographic (left-hand side) and phase (right-hand side) AFM 250 × 250 nm images for cationomer no. 4, obtained by the “moderate tapping” method
Table 4.
Thermal stability of polyurethane cationomers
| Sample no. | I stage degradation | II stage degradation | III stage degradation | Total mass loss | Ea | |||
|---|---|---|---|---|---|---|---|---|
| Mass loss | T | Mass loss | T | Mass loss | T | |||
| [%] | [°C] | [%] | [°C] | [%] | [°C] | [%] | [kJ/mol] | |
| 1 | 7.9831 | 128 | 23.0752 | 233 | 61.8665 | 411 | 92.7827 | 1 |
| 2 | 12.493 | 61 | 57.6712 | 231 | 11.623 | 410 | 81.2362 | 46 |
| 3 | – | – | 98.8291 | 244 | 1.171 | 454 | 100 | 45 |
| 4 | – | – | 99.9965 | 267 | 0.0035 | 453 | 100 | 147 |
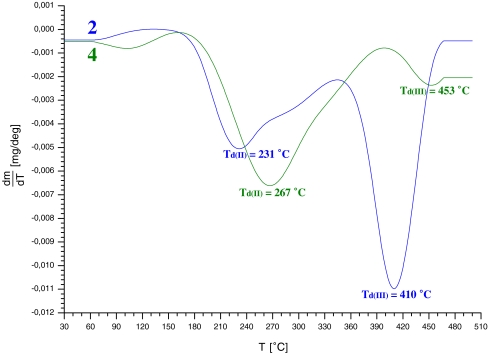
While AFM analyses cover sample surfaces only, conclusions on the chemical and structural nature of the sample volume may be drawn from WAXS analyses and indirectly from sample thermal stability, although a more precise criterion should be assumed here than the one which results from the classical TG analysis. The recorded TG thermograms demonstrate that thermal decomposition, under nitrogen, of non-fluorinated cationomers involves three stages (Table 4), and it starts at about 100 °C in the case of cationomer no. 1. On the other hand, cationomer no. 4 needs only one stage in practise for degradation, and the rate of its decomposition reaches the maximum value not earlier than at 267 °C (Fig. 10). Confirmation for higher thermal stability of chemical structures of fluorinated cationomers may be derived from a much higher activation energy in a general reaction of thermal decomposition which takes place in an oxygen-free atmosphere. That energy may be obtained from the Arrhenius equation [28] (Table 4):
 |
21 |
where:
- dα/dt
rate of general degradation reaction [s–1]
- ko
pre-exponential factor
- EA
activation energy for thermal decomposition reaction [J/mol]
- R
universal gas constant [8.31 J/mol·K]
- T
sample temperature [K]
- α
reaction conversion
- n
reaction order
Fig. 10.
DTG thermograms for cationomer coatings nos. 2 and 4
Said stability comes from hydrogen bonds between the structures which are present at the interface as well as inside hard and soft phases, and also from the presence of a high number of C–F bonds in cationomers nos. 2 and 4 (Dissociation energy for C-F bonds is 485 kJ/mol, while it is only 415 kJ/mol for C–H bonds). These results of thermal analysis support earlier conclusions on higher structural stability of cationomers which have fluorine atoms incorporated into their hard segments.
Surface free energy of coatings obtained from polyurethane cationomers
The known parameters γL, γLWL, γL+ and γL− for model fluids were utilised in calculations of SFE, and they were presented in Table 5. The values of contact angles Θ were recorded by means of an optical goniometer and averaged. Table 6 provides the values of contact angles Θ as found and also components of surface free energy calculated on the basis of those angles in accordance with the van Oss–Good method, for coatings obtained from the studied polyurethane cationomers. Wetting agents were determined for the studied coatings and used in calculations of SFE parameters.
Table 5.
Surface properties of model measuring liquids [19]
| Model measuring liquid | Surface free energy parameters [mJ/m2] | ||||
|---|---|---|---|---|---|
| γL | γLWL | γABL | γ−L | γ+L | |
| Water | 72.8 | 21.8 | 51 | 25.5 | 25.5 |
| Formamide | 58.0 | 39.0 | 19.0 | 2.28 | 39.6 |
| Diiodomethane | 50.8 | 50.8 | 0 | 0 | 0 |
The collected data show that N-alkylation of the cationomer with the use of 1-bromobutane slightly reduces the surface free energy of the coating obtained from that material, in relation to the coating prepared from the cationomer material produced with the use of HCOOH (samples 1 and 3). As compared to a big reduction in SFE for fluorine-containing cationomers nos. 2 and 4, the discussed reduction is not so high, although it is considerable—as results from our earlier studies [14, 15, 24, 26]. On the other hand, reduction in SFE of fluorine-containing cationomer coatings is much higher than expected. The values γS < 15 mJ/m2 fall with the lowest ones and such figures were recorded, e.g. for perfluoroalkylethyl methacrylate and polymethyl methacrylate copolymers, which were employed as coats with special tribological properties [29]. The lowest value of γS = 26 mJ/m2 was found in our earlier studies for the cationomer involving C10H21Br. Noticeable reduction in SFE took place even for cationomer no. 2 which was produced with the use of C4H9Br [26]. The findings from the van Oss–Good method bring us to the conclusion that the basic impact on the value of γS comes from the γLWS component of long-range interactions. However, the values of acid–base interactions γSAB cannot be evaluated precisely and these should be estimated as 1.2–2.5 mJ/m2, with the dominant contribution from base interactions γ S −. Somewhat higher values of γABS were observed for cationomers which contained quaternary N-alkyl groups (samples 2 and 4) in relation to their analogues which were produced from HCOOH.
The presented data show that fluorine atoms, when incorporated into hard segments of polyurethane cationomers, are responsible for considerable reduction in SFE of the coats obtained from those polyurethanes. That reduction is much higher than observed after building in N-decyl groups to cationomer chains. The presence of fluorine at the level about 30 wt.% is critical and decisive for the apolar structure of the final coatings. It is probably inter alia for that reason that such a high reduction in SEP for cationomers nos. 2 and 4 was not clearly reflected in the value of parameter κ, which is not sensitive in practise to the presence of C–F groups, while it was observed in reducing the value of parameter α, which is calculated from IR spectra where C–F bands are exposed. The apolar structures of cationomers nos. 2 and 4 find the reflection principally in definitely lower values of parameter γ S LW which represents long-range interactions.
The supermolecular structures are probably of secondary importance for polarity of obtained coatings, at such a high F content in the studied cationomers, yet they should not be completely neglected. Cationomers nos. 2 and 4, as it was demonstrated in microscopic observations and in visualisation by the AFM method, not only have different F contents but also different levels of orderly arrangement, which is additionally favourable for much superior thermal stability.
Conclusions
Fluorinated polyurethanes were demonstrated to have the value as biomedical and coating materials; the chemical and biological stability for those outlets is especially important. That, in turn, results from improved hydrophobic performance of the polymer material, which involves reduction in surface free energy. The coatings were studied which were obtained from aqueous emulsions of the synthesised cationomers. That choice was driven by considerable possibilities of introducing structural modifications in cationomers and by general environmental compatibility of waterborne polyurethanes.
The goal of this study was to demonstrate to which extent a considerable fluorine content, when introduced to polyurethane cationomer chains, and namely to rigid segments, can contribute to lower polarity of coatings obtained from those cationomers, said polarity being assessed with the use of SFE parameters. Also, the question was whether the quantitative structural criteria employed so far [14, 15, 25, 26], and based on the analysis of 1H NMR spectra (parameter κ) and IR spectra (parameter α), may be useful in evaluation of polar nature of linear polyurethanes. The SFE parameters were determined by the van Oss–Good method, i.e. by measuring the wetting angle values for the obtained coatings and selected model liquids. Fluorine atoms were added to rigid segments of polyurethane chains with the use of a fluorine macromonomer which was produced on the basis of TDI.
Introduction of about 30 wt.% of F to a polyurethane cationomer was found to yield completely apolar coatings. While SFE of the coating produced from cationomer no. 1—synthesised from N-MDA and neutralised with HCOOH—equals to γS = 30 mJ/m2, which is a value for a medium-polarity polymer, the analogous compound with additional F atoms offers only one half of that value, γS = 15 mJ/m2. The apolar coating is a material with much superior thermal stability, and its supermolecular structure is more orderly, with a noticeable trend to form orderly arranged rigid segments, predominantly within the hard phase. That was confirmed by observations with the use of WAXS and AFM methods. Moreover, the structural criterion κ, which is based on 1H NMR spectra, was found not sufficient to evaluate polarity of polyurethanes with high F contents, while the criterion α, which is based on selected bands within the IR spectra, was found a much better instrument for that purpose. A drawback was noticed in the research programme, which however was not analysed in details: coatings with such high F contents were considerably more brittle. Further studies should thus verify how far the high fluorine content can be reduced to restore flexibility of a linear polyurethane coating and whether the loss of precious hydrophobic performance is not the price to be paid.
Acknowledgement
The authors wish to thank Mr. Heinz-Peter Hippler, Applikation und Service Director Marketing and Sales, NANOFOCUS AG and Mr. Ireneusz Niemiec and Mr. Michał Niemiec from NANOFOCUS Poland for realisation of measurements with the use of confocal microscope. This work has been supported by the Polish Ministry of Science and Higher Education under contract no. N N507 329636.
Open Access
This article is distributed under the terms of the Creative Commons Attribution Noncommercial License which permits any noncommercial use, distribution, and reproduction in any medium, provided the original author(s) and source are credited.
References
- 1.Ameduri B, Boutevin B (2004) Well-Architekture Fluoropolymers: Synthesis, Properties and Applications. Elsevier
- 2.Ge Z, Zhang X, Dai J, Li W, Luo Y. Eur Polym J. 2009;45:530. doi: 10.1016/j.eurpolymj.2008.11.008. [DOI] [Google Scholar]
- 3.Bassi M, Tonelli C, Di Meo A. Macromolecules. 2003;36:8015–8023. doi: 10.1021/ma034674g. [DOI] [Google Scholar]
- 4.Chattopadhyay DK, Raju KV. Prog Polym Sci. 2007;32:352–418. doi: 10.1016/j.progpolymsci.2006.05.003. [DOI] [Google Scholar]
- 5.Ming W, Melis F, Grampel RD, Ravenstein L, Tian M, Linde R. Prog Org Coat. 2003;48:316. doi: 10.1016/S0300-9440(03)00107-3. [DOI] [Google Scholar]
- 6.Tan H, Xie X, Li J, Zhong Y, Fu Q. Polymer. 2004;45:1595. [Google Scholar]
- 7.Lin YH, Liao KH, Chou NK, Wang SS, Chu SH, Hsieh KH. Eur Polym J. 2008;44:2927. doi: 10.1016/j.eurpolymj.2008.06.030. [DOI] [Google Scholar]
- 8.Jeong YH, Lee MH, Kim KB. Coll Surf Phys Eng Aspects. 2006;290:178. doi: 10.1016/j.colsurfa.2006.05.036. [DOI] [Google Scholar]
- 9.Deng J, Cao J, Li J, Tan H, Zhang Q, Fu Q. J Appl Polym Sci. 2008;108:2023. doi: 10.1002/app.27625. [DOI] [Google Scholar]
- 10.Liang M, Zhao X, Ding X, Zheng Z, Peng Y. Eur Polym J. 2005;41:1798. doi: 10.1016/j.eurpolymj.2005.02.013. [DOI] [Google Scholar]
- 11.Tan H, Jiehua L, Min G, Rongni D, Xingyi X, Yinping Z, Qiang F. Polymer. 2005;46:7230. doi: 10.1016/j.polymer.2005.06.032. [DOI] [Google Scholar]
- 12.Wang L-F, Wei Y-H. Coll Surfaces B: Biointerfaces. 2005;41:249. doi: 10.1016/j.colsurfb.2004.12.014. [DOI] [PubMed] [Google Scholar]
- 13.Wang L-F. Polymer. 2007;48:894. doi: 10.1016/j.polymer.2006.11.063. [DOI] [Google Scholar]
- 14.Król P, Król B (2008) 2 Colloid Polym Sci 286:1111
- 15.Król P, Król B. Colloid Polym Sci. 2008;286:1243. doi: 10.1007/s00396-008-1881-3. [DOI] [Google Scholar]
- 16.Tan H, Guo M, Du R, Xie X, Li J, Zhong Y, Fu Q. Polymer. 2004;45:1647. doi: 10.1016/j.polymer.2003.12.064. [DOI] [Google Scholar]
- 17.www.nanofocus.com
- 18.Good JR (1991) Fundamentals of Adhesion. Lee LH (Ed.) 153, New York, Dekker
- 19.Żenkiewicz M (2006) Polimery 51:169 and 51, 584
- 20.Gaydos J, Moy E, Neumann W. Langmuir. 1990;6:888. doi: 10.1021/la00094a033. [DOI] [Google Scholar]
- 21.Zisman WA. Ad in Chem Am Chem Soc. 1964;43:1. [Google Scholar]
- 22.Pham Quang Tho (2003) Proton and Carbon NMR Spectra of Polymers. John Wiley & Sons, Inc., Chichester
- 23.Zhen Ge, Xingyuan Zhang, Jiabing Dai, Weihu Li, Yunjun Luo (2009) Eur Polym J 45, 530
- 24.Król P, Król B. Polimery. 2007;52:427. [Google Scholar]
- 25.Król B, Król P. Colloid Polym Sci. 2009;287:189. doi: 10.1007/s00396-008-1966-z. [DOI] [Google Scholar]
- 26.Magonov SN, Elings V, Whangbo MH. Surf Sci. 1997;L385:375. [Google Scholar]
- 27.Magonov SN, Reneker DH. Ann Rev Mater Sci. 1997;27:175. doi: 10.1146/annurev.matsci.27.1.175. [DOI] [Google Scholar]
- 28.Das D, Nayak SS, Das SK, Nayak PL, Lenka S. Thermochim Acta. 1997;297:10. doi: 10.1016/S0040-6031(97)00150-0. [DOI] [Google Scholar]
- 29.Tongkhundam Y, Anuvat Sirivat A, Brostow W. Polymer. 2004;45:8731. doi: 10.1016/j.polymer.2004.10.063. [DOI] [Google Scholar]


