Abstract
A synthetic approach to model the analytical complexity of biological proteolytic digests has been developed. Combinatorial peptide libraries ranging in length between nine and twelve amino acids that represent typical tryptic digests were designed, synthesized and analyzed. Individual libraries and mixtures thereof were studied by replicate liquid chromatography-ion trap mass spectrometry and compared to a tryptic digest of Deinococcus radiodurans. Similar to complex proteome analysis, replicate study of individual libraries identified additional unique peptides. Fewer novel sequences were revealed with each additional analysis in a manner similar to that observed for biological data. Our results demonstrate a bimodal distribution of peptides sorting to either very low or very high levels of detection. Upon mixing of libraries at equal abundance, a length-dependent bias in favor of longer sequence identification was observed. Peptide identification as a function of site-specific amino acid content was characterized with certain amino acids proving to be of considerable importance. This report demonstrates that peptide libraries of defined character can serve as a reference for instrument characterization. Furthermore, they are uniquely suited to delineate the physical properties that influence identification of peptides which provides a foundation for optimizing the study of samples with less defined heterogeneity.
Introduction
Whole organism or blood serum proteomes are complex - both in terms of total number of proteins and dynamic range.1–3 Current analytical platforms, such as the liquid chromatography-mass spectrometry (LC-MS) commonly employed in proteomic analyses, are challenged to deal with these two features, motivating the development of improved instrumentation. Reference or standard samples would be valuable for this purpose, but a suitable model has remained elusive. Biological samples are inherently diverse; even the best-characterized organisms vary their protein expression based on diet, growth conditions, age, and disease. Attempts have been made to model proteome complexity,4–7 however these model systems lack the desired complexity, are prone to contamination, and are costly and tedious to produce. A robust standard that closely mimics proteome complexity and can be produced at a reasonable cost would enable platform comparison, further the understanding of variables and limitations associated with proteome analysis, and potentially serve as an internal or external standard for routine proteomics analysis.
Here, we propose to use combinatorial libraries of synthetic peptides to mimic a bottom-up proteomic sample. This approach has many advantages. First, the experimenter can define the diversity in a library, establishing sample complexity. One can also define the amino acid composition of peptides in a library, which allows access to a wide range of chemical properties. Even some typical post-translational modifications can be introduced through derivatization or incorporation of modified amino acid residues. Known composition also enables efficient database searching to interpret MS/MS spectra for peptide identification. Lastly, peptide libraries can be mixed in precise ratios to establish the dynamic concentration range of a sample. Given these advantages, peptide libraries may potentially be valuable in proteomic analyses as a reference or standard sample from which the capabilities of analytical platforms can be characterized. This approach also complements recent inter-laboratory efforts to develop a yeast standard8 for the investigation of performance metrics regarding separation, ionization, precursor sampling, and peptide identification in LC-MS analyses.9
As a first step, we have carefully designed and synthesized four peptide libraries to closely resemble a generic proteome digest. We have performed replicate LC-MS analyses of individual libraries and library mixtures to characterize their analytical complexity. For comparison to biological samples, analogous experiments were performed on a tryptic digest of the Deinococcus radiodurans bacterial proteome. Probabilistic theoretical simulations were performed to model detectability distributions for complex mixtures. Briefly, peptide detectability refers to the probability that a peptide is detected in a standard shotgun proteomics analysis. Probability of detection is likely influenced by peptide abundance, matrix effects, sample preparation, instrumental sensitivity, and identification method; standard peptide detectability, however, is taken to be an intrinsic property of the peptide sequence and, for biological samples, its protein of origin.10 These simulations successfully predict a bimodal distribution of standard peptide detectability for individual libraries. Furthermore, our results suggest preferential detection of longer peptide sequences, an interesting result that likely has implications in quantitative proteomics studies and might be addressable by implementation of peptide libraries as internal standards. Lastly, we demonstrate the potential role of combinatorial libraries as ideal models to systematically probe chemical and structural features of peptides and the possible impact such specific changes have on peptide identification.
Experimental
Library Design
This study focuses on four libraries of peptides ranging between 9 and 12 residues in length. These libraries are designated as BB9A through BB12A, respectively, and their composition is shown in Table 1. Tryptic peptides detected in previous experiments were selected as templates for each library to increase the resemblance of a proteome digest. The original sequences are shown in the top rows in Table 1. The sequences SAVTALWGK and FLASVSTVLTSK, both identified in direct-infusion ESI-IMS-MS analysis of a human hemoglobin digest,11 were selected as templates for BB9A and BB12A, respectively. NTMILEICTR from complement component C3 and ATEHLSTLSEK from apolipoprotein A-I were identified in SCX-RPLC-IMS-MS mapping of a human plasma digest12 and chosen as templates for BB10A and BB11A, respectively. Permutations for each position (shown as columns) were assigned such that the hydrophobicity distribution of each library was similar to that for tryptic peptides of the same length in the human proteome.13 Also, the distribution of amino acids in the four libraries matches the relative abundance of amino acids in a collection of more than 1,150 proteins from several organisms within ±0.5%.14 Lastly, the possible permutations in the different libraries were scaled to produce similar numbers of unique sequences; 3,888 peptides in BB9A, 5,184 peptides in the BB10A, 4,608 peptides in BB11A, and 4096 peptides in BB12A.
Table 1.
Composition of Synthetic Peptide Libraries
| Library Name | Position Number | |||||||||||
|---|---|---|---|---|---|---|---|---|---|---|---|---|
| 1 | 2 | 3 | 4 | 5 | 6 | 7 | 8 | 9 | 10 | 11 | 12 | |
| BB9A (3888 peptides) | S | A | V | T | A | L | W | G | K | |||
| C | D | I | E | P | D | Q | D | R | ||||
| L | Y | N | F | V | ||||||||
| BB10A (5184 peptides) | N | T | M | I | L | E | I | C | T | R | ||
| E | L | A | D | A | F | P | V | L | K | |||
| G | Y | G | Q | |||||||||
| BB11A (4608 peptides) | A | T | E | H | L | S | T | L | S | E | K | |
| Y | Q | A | V | G | P | N | P | G | I | R | ||
| I | F | |||||||||||
| BB12A (4096 peptides) | F | L | A | S | V | S | T | V | L | T | S | K |
| G | N | D | I | G | H | P | E | M | Q | A | R | |
Peptide Synthesis
Combinatorial libraries of peptides were created following typical solid phase synthesis and split and mix techniques.15 Reagents were purchased from Midwest Biotech (Indianapolis, IN) except where noted. In this scheme, the C-terminal residue is anchored to phenylacetamidomethyl (PAM) resin beads and the growing peptide chain is constructed by addition of N-tert-butoxycarbonyl (Boc) protected amino acids and 3-(Diethoxy-phosphoryloxy)-3H-benzo[d][1,2,3] triazin-4-one (DEPBT, purchased from National Biochemicals, Twinsburg, OH) as a coupling reagent. For the purpose of synthesizing tryptic-like peptides, the synthesis began with a mixture of PAM resin beads preloaded with arginine or lysine residues. Coupling reactions were performed in separate vessels for each residue with the Boc-protected amino acid and DEPBT present at 10-fold molar excess. By adding each amino acid in a separate vessel with 10-fold molar excess of reagent, equimolar incorporation of each amino acid at a give position is ensured. In order to incorporate two or more amino acids at a given position, beads were dried, divided equally by mass, and redistributed among the reaction vessels prior to the next coupling step. Upon cleavage and side-chain deprotection with hydrofluoric acid, the retrieved peptides were purified via lyophilization. The efficiency of peptide synthesis was verified using LC-MS data. A larger database containing all possible peptide sequences that arise from omission of a single amino acid residue was constructed for each library and observed to identify very few deletion peptides. Chemical stability of the peptide libraries appears to be robust; samples stored at −20°C (as solid or in solution) yield similar results to solutions stored in an autosampler at 10°C over the course of 3 months.
Biological Sample Preparation
For the D. radiodurans digest, proteins were extracted by four passes through a French press at 16000 psi and cleared by centrifugation at 13000 g for 45 minutes. Replicate 250 microliter protein extracts (estimated protein concentration of 10.3 mg/mL) were digested overnight with trypsin in the presence of 0.05% RapiGest SF (Waters, Milford, MA) acid-labile surfactant and 25 mM ammonium bicarbonate after reduction and alkylation with dithiothreitol and iodoacetamide. Trypsin was deactivated and the acid-labile surfactant was cleaved with the addition of five microliters of 90% formic acid followed by incubation at 37° C for 2 hours and centrifugation at 13000 g for 10 minutes. The peptide samples were cleaned by solid phase extraction using a Waters OASIS HLB cartridge and the manufacturer’s protocol. After removing the solvent by speed-vac at 45° C for 2 hours, the digest was suspended in 200 microliters of solvent A.
LC-MS Analysis
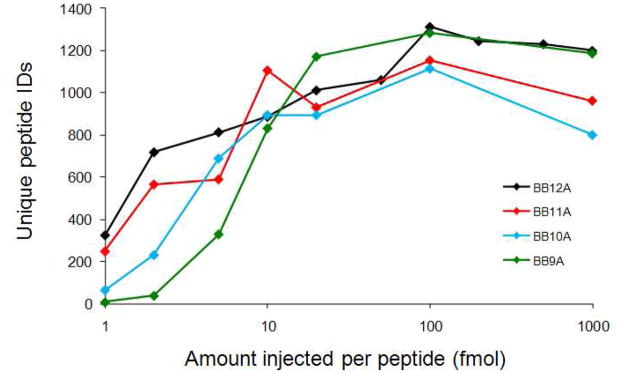
All data reported here were recorded on an LCQ DecaXP Plus (Thermo Scientific, Waltham, MA) ion trap mass spectrometer. For synthetic libraries, sample sizes between 1 fmol and 1pmol per peptide (based on average molar mass of the library) were tested for optimal LCQ performance (Figure 1). The optimum loading amount (100 fmol per peptide, or 410, 592, 564, and 528 ng of BB9A, BB10A, BB11A, and BB12A, respectively) was then used to collect ten replicate analyses for each library using a 120-minute gradient from 97% to 60% solvent A (97% water, 3% acetonitrile with 0.1% formic acid) at 250 nL/min using an Eksigent nanoLC 2D (Dublin, CA). Solvent B is acetonitrile with 0.1% formic acid. The sample is first loaded on a 15 mm × 0.1 mm i.d. fritted trapping column packed in-house with 5 micron, 200 Å pore MAGIC C18AQ particles (Michrom Bioresources, Auburn, CA). Separation occurs in a 150 mm × 75 micron i.d. pulled-tip capillary column packed in-house with 5 micron, 100 Å pore MAGIC C18AQ particles. Eluting peptides are electrosprayed directly into the source of the LCQ Deca XP ion trap mass spectrometer where they are analyzed by a recurring sequence of one mass spectrum from m/z 300 to 1500 followed by two tandem mass spectra of the two most intense ions. A dynamic exclusion protocol is employed such that each precursor mass is analyzed only twice before it is excluded for 45 seconds. The D. radiodurans digest was analyzed under LC-MS conditions identical to those used for the synthetic libraries with an injected mass of 1.29 μg, assuming quantitative recovery from solid-phase extraction sample clean-up.
Figure 1.
Average number of unique peptides identified from each peptide library (analyzed in triplicate) for injection amounts ranging three orders of magnitude. Results indicate that 100 fmol per peptide is the optimum sample size for this platform for all four libraries.
Data Analysis
For database searching, all possible sequences within a library were concatenated and treated as a single protein in a custom database. Mascot version 1.9 was used to query the custom database by setting the enzyme specificity to trypsin and allowing for zero missed cleavages and variable modification of oxidized methionine. The precursor mass tolerance was set to ±1.5 Da and the fragment ion tolerance to ±0.8 Da using monoisotopic masses. A peptide score threshold of 25 was chosen for parsing the results as it produced as few as zero matches to the reverse sequence for the respective synthetic libraries in the database. Searches of the D. radiodurans data against the reverse D. radiodurans database as a decoy resulted in a FDR of 3.9% using a Mascot score threshold of 25. Three different methods of estimating the FDR for the synthetic libraries are explained in the Supporting Information. The first method used the D. radiodurans proteome as a decoy database and resulted in FDR values ranging from 1.9% to 4.4% depending on the library (see Supporting Table S-1). The other two methods used searches that included decoy sequences with one deletion, two consecutive deletions, or one amino acid insertion and produced less conservative FDR values ranging from 1.89% to 2.14% or highly conservative FDR values ranging from 4.07% to 9.44% (see Supporting Table S-2). These combined estimates confirm that a reasonable estimate of FDR for the synthetic library database searches is less than 5%.
Results and Discussion
Optimizing Synthetic Library Injection Amount
Several experimental parameters, such as nano-LC gradient length, dynamic exclusion settings, and the mass of peptides loaded onto the instrument, were optimized prior to replicate analyses. The optimal injection amount for each peptide library was expected to be important for two reasons. Insufficient mass would generate little usable data due to instrumental sensitivity limits, whereas excessive amounts of sample can overload the column and impair chromatography performance. Optimal injection amounts for each library were determined by triplicate injections of each library from 1 fmol to 1 pmol per peptide, as shown in Fig. 1. At lower injection amounts, below 10 fmol, the number of identifications decreases for all peptides with the shorter-length libraries exhibiting a more dramatic reduction. This result indicates the sensitivity limit of the mass spectrometer, which apparently varies for these libraries in a seemingly length-dependent manner. At larger injection amounts, increasing the injection amount beyond 100 fmol results in fewer peptide identifications for all four libraries. Investigation of the data in more detail illustrates that broadened peaks in the chromatogram likely leads to selection of fewer unique precursor ions compared to the optimal 100 fmol injection amount. It should be noted that these data were acquired over a period of several weeks and that varied tuning conditions of the mass spectrometer and different nanoLC columns were used.
Hydrophobicity Distributions of Libraries
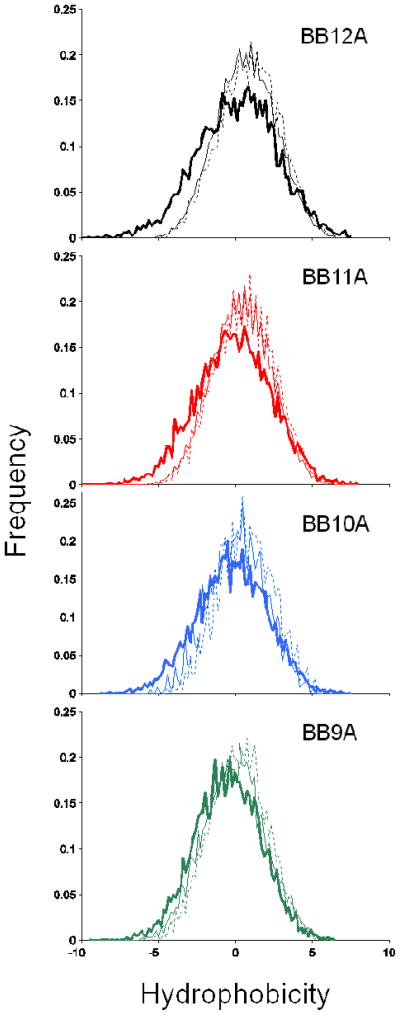
Hydrophobicity is a simple metric that can describe similarity between peptide library models and proteomic samples. Not only is it desirable for our model system to adhere to the naturally observed hydrophobicity distribution, it is also important to consider potential biases that occur if the distribution for the libraries falls outside of a practical range. Peptides that are too hydrophobic might fail to be detected due to insufficient solubility, whereas peptides that are too hydrophilic might not be retained sufficiently on the trapping column of the nano-LC system. Figure 2 compares the hydrophobicity distribution of 6000 random length-matched tryptic sequences from the human proteome13 (thick lines) to that of the designed libraries (thin lines). Median and quartile values for these distributions are reported in Supporting Table S-3. The hydrophobicity scale used here corresponds to that developed by Eisenberg et al.;16 other scales produced similar results. The hydrophilic portion of the distribution for the human sequences is slightly more populated than libraries BB11A and BB12A, but overall widths and ranges of distributions for peptide libraries are in good agreement with their proteome counterpart. The dashed lines in Figure 2 show the distribution of identified peptides from ten replicate analyses of the libraries. Identifications are obtained across the libraries’ distributions and show no significant bias. This result reaffirms the widespread use of reversed-phase liquid chromatography in shotgun proteomics, although the ability to identify extremely low or high hydrophobicity peptides by this approach may be problematic and deserves further investigation.
Figure 2.
Normalized histograms of the hydrophobicity distributions for 6000 random length-matched peptides from the human proteome (thick lines), all peptides from the synthetic libraries (thin lines), and peptides identified from individual libraries (dashed lines).
Comparison between Synthetic and Biological Samples
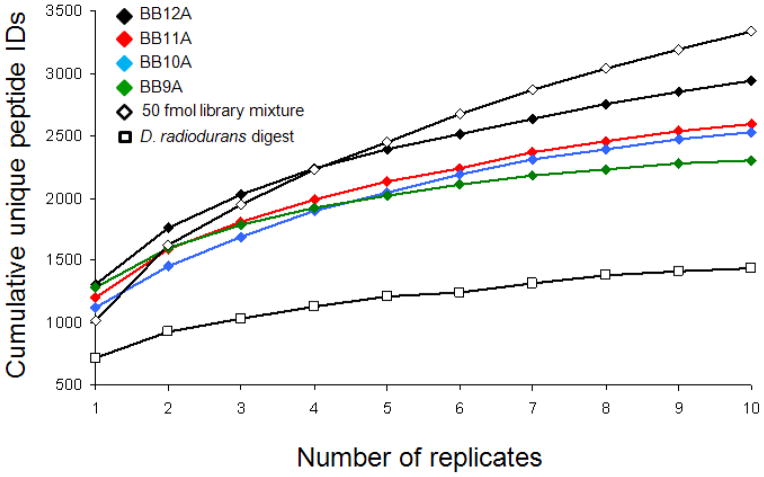
Individual peptide libraries were subjected to ten replicate LC-MS analyses to assess the depth of analysis this platform can achieve in regard to the complexity of our model system. Because each library contains thousands of peptides at approximately equal abundance, competitive ionization was expected to result in peptide identifications that are fairly random, causing significant additional unique identifications to be obtained with each replicate. Alternatively, biological samples typically contain peptides present at abundances varying by several orders of magnitude. In this circumstance, one would suspect that the most abundant components are detected redundantly and additional unique identifications obtained from replicate analyses correspond to inconsistent detection of less abundant peptides. Experimental results from replicate analyses of peptide libraries and the D. radiodurans sample are shown in Figure 3. The cumulative peptide identifications for the BB12A, BB11A, and BB10A libraries seem to scale similarly with each replicate, with slightly fewer identifications in the libraries of shorter lengths. This trend may be explained by the tendency for longer peptides to receive higher Mascot scores. Also, BB10A contains more components than BB11A, which contains more components than BB12A. Thus, it could also be reasoned that increased complexity may lead to increased co-elution, competitive ionization, and convoluted MS/MS spectra. The results from BB9A appear slightly different. In a single analysis, it ranks second to BB12A for identified peptides, yet it quickly intersects the curves for BB11A and BB10A to yield the fewest identifications of the libraries after 6 replicates. Initially, this shallow curve was thought to be the result of exhaustive analysis of the library, as BB9A contains the fewest number of components. However, when these data are plotted to show the percent of each library identified per replicate (see Supporting Figure S-1), only ~60% of BB9A can be assigned after ten replicates, which is within the range observed for the other libraries (49%, 56%, and 72% for BB10A, BB11A, and BB12A, respectively). It is possible that our choice of template peptide and permutations for the BB9A library has introduced some unanticipated properties and is an ongoing point of interest in this study. The replicate curve for an equimolar mixture of these peptide libraries (open black diamonds) displays the opposite trend of BB9A. The increased complexity in the library mixture exacerbates the effect of competition in the sample, yielding fewer identifications in a single analysis than any of the individual libraries. Identifications also become more random, leading to a greater number of unique identifications upon replicate analysis.
Figure 3.
Cumulative unique peptide identifications obtained upon subsequent analyses up to ten replicates for BB12A, BB11A, BB10A, and BB9A (black, red, blue, and green diamonds, respectively). Results for a mixture containing 50 femtomoles per peptide from all four libraries are shown in open diamonds. Data for replicates of a tryptic digest of D. radiodurans are shown in open squares. The data point at one replicate represents the average number of unique identifications among all ten replicates, rather than the number in any one replicate.
The LC-MS results for the D. radiodurans digest (open black squares) show significantly fewer identifications for a single LC-MS/MS analysis as well as after 10 replicates than for any of the synthetic libraries for similar amounts loaded on column. This is consistent with the dynamic range of peptide abundance in the biological sample; the D. radiodurans digest is anticipated to contain over 50,000 peptides present across 5 orders of magnitude in abundance.17 Consequently, the peptides from the most abundant proteins are repeatedly detected while lower-abundance species are detected less consistently or not at all. The average length of peptides identified in the D. radiodurans digest was 12.5 residues (data not shown), which suggests the lengths of the peptide libraries are appropriate to model tryptic peptides. In general, the replicate curves for our peptide libraries and D. radiodurans sample appear similar to other reports that involve extensive replicate analyses of proteomic samples.18 The curvature of these lines appears to depend not only on complexity, but also on composition or length as well (as observed for BB9A). These results demonstrate that model libraries can be created that produce replicate curves resembling biological systems of interest.
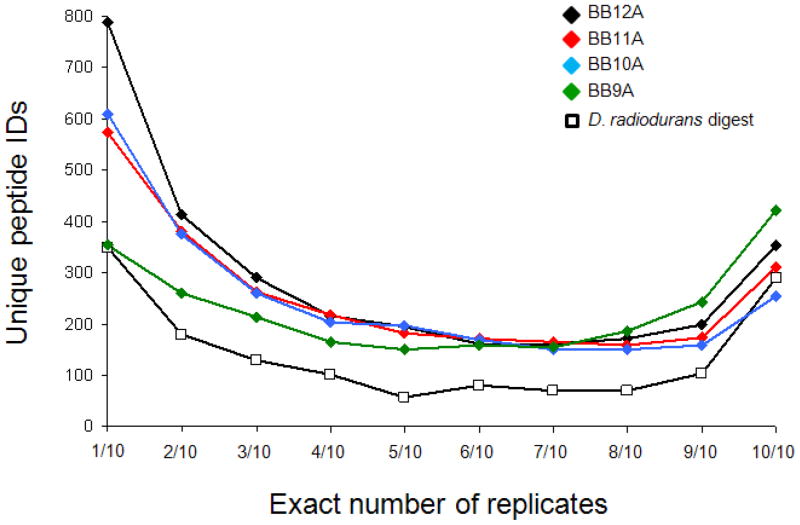
Proteome digests typically contain several peptides at high abundance that may be readily identified in every replicate. Peptides detected in only one replicate are thought to be less abundant (or possibly false positives). While identification of many peptides from a biological digest in all ten replicates would be expected for mainly those peptides from higher abundance proteins, most identified peptides should presumably be detected in one (or at most, a few) replicates. For synthetic libraries in which all sequences are present at equimolar concentrations, co-elution and competitive ionization likely result in a smaller fraction of peptides detected in ten of ten replicates as compared to a biological digest where peptides from the highest concentration proteins should be favored. In Figure 4, results for these samples are plotted as the number of unique peptides identified in an exact number of replicates. The data point at one replicate represents the peptides detected in exactly one of the ten LC-MS replicates, whereas the data point at ten replicates represents peptides detected in all ten LC-MS analyses. For the D. radiodurans digest, the observed bimodal distribution was anticipated given the dynamic range of biological samples. The distribution is also remarkably symmetric with nearly as many peptides detected in every analysis as are in only one of the ten replicates. Curiously, the synthetic libraries also give rise to bimodal distributions. Although this result may not be intuitive, it appears to be consistent with a simple theoretical model discussed below. This bimodal distribution can also result from peptides with different precursor ion intensities (probably related to relative gas-phase basicity) where readily ionized peptides can be identified in all replicates while poorly ionized peptides are identified less frequently. Indeed, plots of average precursor ion peak areas and apex peak intensities for peptides found in different number of replicates show an increasing trend from peptides identified in one replicate to those identified in all ten (see Supporting Figure S-2). It is also curious that in the case of the BB9A library, more peptides are identified in every replicate than are identified in exactly one replicate. This is consistent with the data for BB9A in Figure 3, which shows a large number of identifications for BB9A in the first replicate and fewer additional identifications in subsequent replicates compared to other libraries.
Figure 4.
Number of unique peptides identified in a particular number of replicate analyses. For example, the data points at 1/10 reflect the number of peptides detected in only one replicate for its respective sample, whereas 10/10 gives the number of peptides detected in every replicate.
Library Mixtures at Varying Relative Abundance
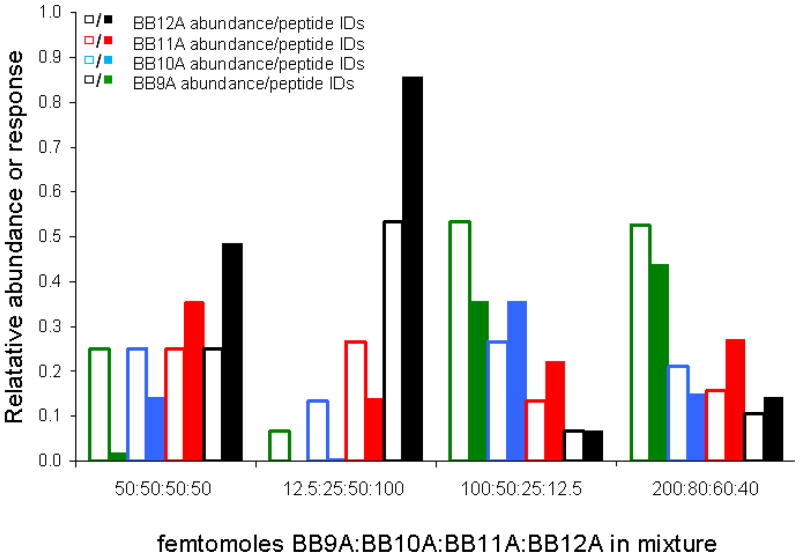
To more closely resemble a biological sample, peptide libraries can be mixed in different ratios to establish a dynamic range of abundance. From injection optimization experiments (Figure 1), we know the ion trap mass spectrometer is sensitive to individual libraries at abundances between one femtomole and one picomole, with the greatest sensitivity from 10 to 100 femtomoles. Therefore, analysis of library mixtures in this range of abundance should not be limited by instrumental sensitivity, but rather the competition related to the concentration profile for a particular mixture. Analysis of individual libraries shows evidence that each library differs at least slightly in terms of the number of identifications that can be achieved. Varying the relative abundance of these libraries will almost certainly result in further bias, but to what extent is not obvious. Figure 5 shows the results of replicate analyses of mixtures of peptide libraries BB9A, BB10A, BB11A, and BB12A. In these data, each cluster of bar graphs corresponds to LC-MS results for different library mixtures. The composition of each mixture is denoted along the x-axis as femtomoles BB9A, BB10A, BB11A, and BB12A, respectively. The hollow bars indicate the relative abundance of each library in the prepared mixture and the solid bars reflect the fraction of total identifications that correspond to a particular library upon LC-MS analysis. The equal abundance mixture, which contained 50 femtomoles per peptide for each library, suggests peptides of increasing chain length account for a much higher proportion of peptide identifications. At each extreme, BB12A accounts for nearly 50% of assignments while BB9A falls below 2%. Equimolar mixtures with 20 and 100 femtomoles per peptide gave similar results (data not shown). It also seems unlikely that choice of template peptide and library design would cause such a large difference in response, especially given the similarities of the data when each library is analyzed individually.
Figure 5.
Peptide identifications from triplicate analyses of peptide library mixtures at differing relative abundance. Hollow bars indicate the solution-phase abundance of each library while solid bars show the fraction of peptide identifications pertaining to particular libraries upon triplicate analysis of each mixture. Abundance ratios are given below each bar graph cluster in femtomoles BB9A:BB10A:BB11A:BB12A, respectively.
One possible interpretation of the length dependence result is that under these competitive conditions, peptides are ionized preferentially due to differences in apparent gas-phase basicity.19–22 For doubly-charged tryptic-like peptides in linear conformations, increased chain length would result in greater separation of charged sites (N-terminus and C-terminal basic residue) and thus less destabilization through Coulombic repulsion. Because the electrostatic interaction follows an inverse-square law, this effect might be sensitive to relatively small changes in length. When the libraries are analyzed individually, chain length is fixed and the limited number of excess charges in the electrospray droplet would ionize the peptides based on other properties. In competition among peptides of different size, however, length may become a significant parameter and contribute to the results seen here. Extracted precursor peak intensities for the experiments used for Figure 5 were compared among the four libraries and clearly demonstrate that longer peptide sequences resulted in larger average peak intensities and the trend was length dependent (see Supporting Figure S-3). This interpretation is consistent with another report which determined length to be a feature positively correlated with peptide detectability in a machine learning model.10
The middle two plots of Figure 5 show results for mixtures where the peptide libraries are present at concentrations differing by factors of two. The 12.5:25:50:100 mixture contains BB12A as the most abundant library, and considering the bias favoring longer peptides, it is not surprising that over 85% of the peptides identified from this mixture are from BB12A. In addition, the other libraries are effectively suppressed with 0.4% and 13.9% of identifications attributed to BB10A, and BB11A, respectively, and zero identifications from BB9A. In the 100:50:25:12.5 mixture, nearly the same number of peptides are identified from BB9A and BB10A, even though BB10A is present at half the abundance of BB9A. Also, the suppression of other libraries is not as significant here, with BB11A accounting for 22% of identified peptides and, curiously, BB12A’s relative response is approximately reflective of its solution-phase relative abundance. Lastly, 200:80:60:40 cluster of bar graphs represents an effort to create a mixture that yields equal response across all four libraries. In this mixture, >100 peptides can be assigned from each library. Also, each library accounts for at least 10% of identifications and no single library contributes more than 45% of identifications. Results for these mixtures demonstrate the number of peptide identifications in a mixture does not relate to solution-phase abundance in a straightforward manner. While the results from these mixtures might seem nightmarish for quantitation in biological samples, protein digests will produce peptides of various lengths and it is possible that this effect will be mitigated to some degree.
Replicate Analyses of an Equimolar Mixture of Peptide Libraries
Two scenarios can be used to envision the dynamics involved in detecting peptides in the more complex mixtures of libraries, such as those for which the results are shown in Figure 5. First, because some subset of each library can be detected in ten of ten replicate analyses of that library, it may be possible that these peptides will still be favored for detection versus the remaining, less detectable peptides. In the second scenario, the roughly four-fold increase in sample complexity reduces the likelihood of each peptide being selected for MS/MS so that even the most detectable peptides are identified less frequently. Because a comparable number of peptides can be detected in a single analysis for single libraries and library mixtures (Figure 3), one or both of these scenarios (or a suitable alternative) must be invoked.
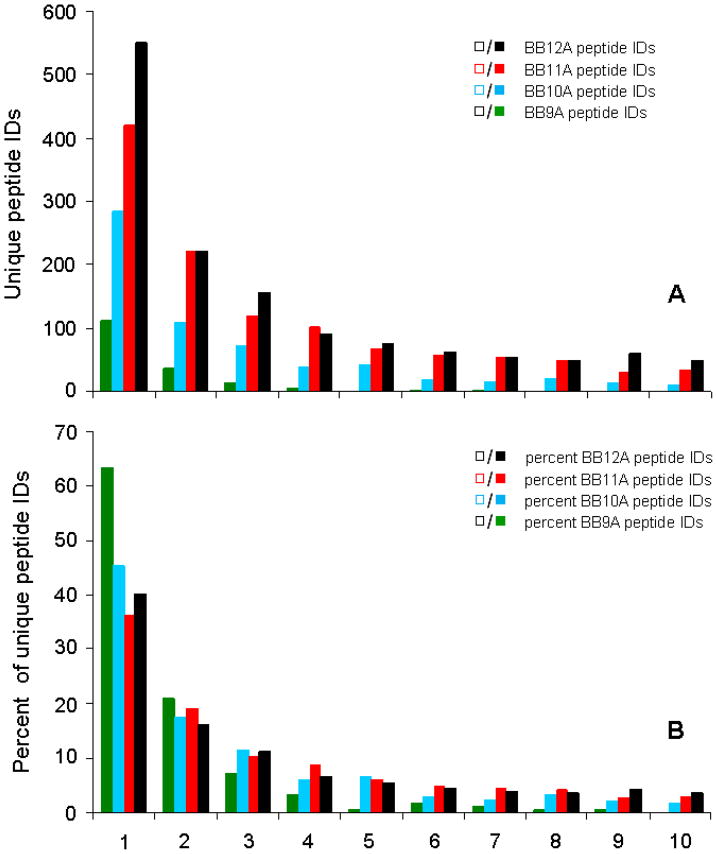
To discern which of these mechanisms dominates, ten LC-MS replicates were performed on the equimolar library mixture (50 fmol each). The results are shown in Figure 6 and plotted similarly to Figure 4, giving the number of peptides that are identified in an exact number of up to 10 replicates. In Figure 6A, the unique peptide identifications have been sorted according to library of origin and we observe a strong bias toward longer peptides similar to Figure 5. A strong peak at 10 replicates is not observed in Figure 6A, and thus no bimodal distribution. This invokes the second scenario above involving increased competition, causing highly detectable peptides within each library to be suppressed by the presence of three other libraries of similar complexity at equal abundance. As a result, identifications are obtained more randomly and most peptides are identified in only one or two replicates. Nevertheless, some peptides from the BB12A, BB11A, and BB10A libraries are detected in all ten replicates, indicating the first scenario involving highly detectable peptides contributes slightly in these data. Figure 6B shows the same data normalized to the total number of identifications for a given library. It is interesting to note that for the fraction of peptides identified in exactly one replicate, the ordering of the libraries roughly inverts, with >60% of peptides identified from BB9A occurring in only one of ten replicates, compared to ~40% for the other three libraries. The fraction of peptides identified in a given number of replicates for BB9A correspondingly decreases with additional replicates more rapidly than the other libraries. These features of the data from BB9A appear to be consistent with those when the BB9A library is analyzed individually.
Figure 6.
Peptides identified in exact numbers of replicates (A) for an equimolar mixture of the BB9A, BB10A, BB11A, and BB12A libraries, each present at 50 femtomoles. The lower panel (B) shows the same data plotted normalized to the total number of identified peptides from each library.
Theoretical Model Considerations
We have employed a probabilistic approach with a few simple assumptions to generate hypothetical results for a reasonable number of replicate analyses of complex mixtures. Assume that there are n copies of a peptide in a given sample admitted into the LC-MS system, and that the probability of ionizing a single copy of the peptide is p. Further, assume that the analytical platform can identify this peptide if its ion count (i.e. its number of ionized peptides) is greater than or equal to some threshold c. Obviously, p and c values are determined by the peptide sequence and experimental protocol. Given these assumptions, the detectability of the peptide, i.e. the probability that this peptide is detected, at quantity n can be expressed as
| (Eq. 1) |
where k is the number of peptides reaching the detector. In the limit, and for large n, this truncated sum of binomial distributions can be approximated by the integration of a Gaussian distribution. Thus, the detectability of a peptide at quantity n can be expressed as
| (Eq. 2) |
where Φ(x) is the standard Gaussian cumulative density function. Using this relationship, we can estimate the distribution of peptide detectability f(d) as
| (Eq. 3) |
where ϕ(x) is the standard Gaussian probability density function. Note that the denominator here is independent of n, p, and c, while the numerator is the density function of a random variable. Quantity c-1/2 was introduced to provide more accurate integration. For standard detectability, peptide number n will be a constant. Thus, if the variability of p and c is not very large, we can assume that the random variable in the numerator of Eq. 3 is uniformly distributed within a certain range of parameters. From this, Eq. 3 can be simplified to
| (Eq. 4) |
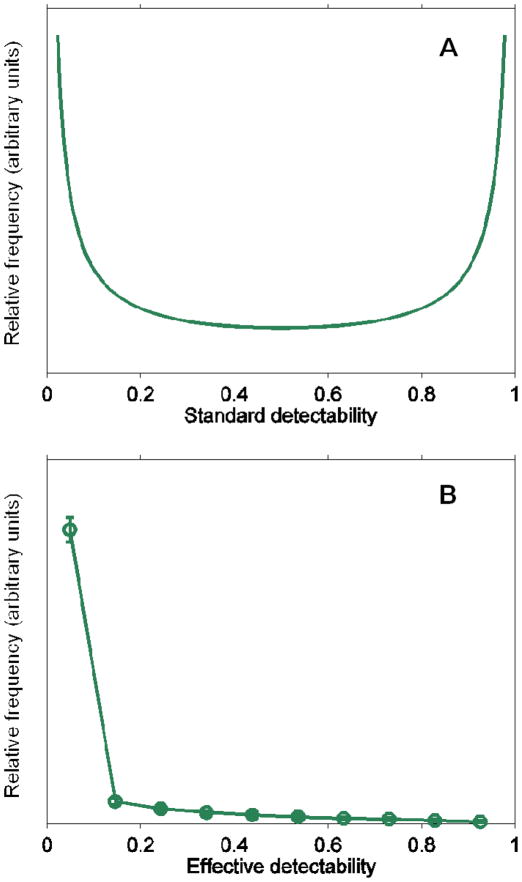
which is a symmetric “U”-shaped distribution (Figure 7A).
Figure 7.
Results of theoretical modeling of peptide detectability predicting A) a bimodal distribution of peptide standard detectability for a mixture of peptides in equal abundance and B) the same treatment on a mixture of peptides whose relative abundances follow a power law distribution, resulting in a rapidly decaying distribution of effective detectability.
Using a Monte Carlo simulation, we further investigated whether this theoretical model can also explain the “L”-shaped distribution of effective peptide detectabilities (i.e. the probability of detection of peptides in non-equimolar mixtures). First, we assumed a power law distribution (r = −2.0) for protein quantity n, and Gaussian distributions for peptide ionization probability p and detection cutoff c. We sampled 2000 proteins as the protein mixture. Each protein was assumed to have exactly 30 peptides, with one same quantity n sampled from the power law distribution, and different p and c values sampled from uniform and Gaussian distributions, respectively. Effective peptide detectability can then be computed using Eq. 2 for each peptide in each protein. Protein identification protocol was simulated using Bernoulli trials with the success probabilities equaling effective peptide detectabilities as parameters for each of the 2000 proteins. Only proteins with ≥2 identified peptides were retained. Finally, we collected effective detectabilities of the peptides from these proteins only and obtained the histogram of detectabilities as an approximation of the distribution. Surprisingly, we found that the distribution of effective detectabilities obtained by this theoretical analysis was “L”-shaped (Figure 7B) or a left-skewed “U”-shape (data not shown). This result was robust to the parameters used in the simulation and even choice of probability distributions. For example, using Gaussian or Beta distributions for p and keeping c as constant resulted in a similar conclusion.
These theoretical simulations successfully predict the detectability curves for the libraries when analyzed individually (Figure 4). Due to equal abundance of peptides within a library, libraries were not expected to contain many peptides that would be identified in all ten replicates. Each library presented here shows evidence for a significant number of highly detectable peptides, however, as predicted by this model. The BB9A library even shows a roughly symmetrical distribution with slightly more highly detectable peptides relative to less detectable peptides. Other peptide libraries show evidence for left-skewed bimodal distributions. Replicates from an equimolar peptide library mixture (Figure 6) do not exhibit a local maximum for highly detectable peptides. This might be due to competition between these highly detectable peptides across libraries, or perhaps the high detectability is insufficient given the increased total number of peptides in the mixture and the analytical platform capacity. Although Figure 6 strongly resembles the “L”-shaped distribution from Figure 7B, it is important to note that this trend is observed for different reasons. Libraries are mixed at equimolar ratios, albeit with a length-dependent detection bias, to generate the data shown in Figure 6, while the model used to generate the data in Figure 7B relies on protein abundances that follow a power law distribution.
Peptide Library Model Application: Amino Acid Preference
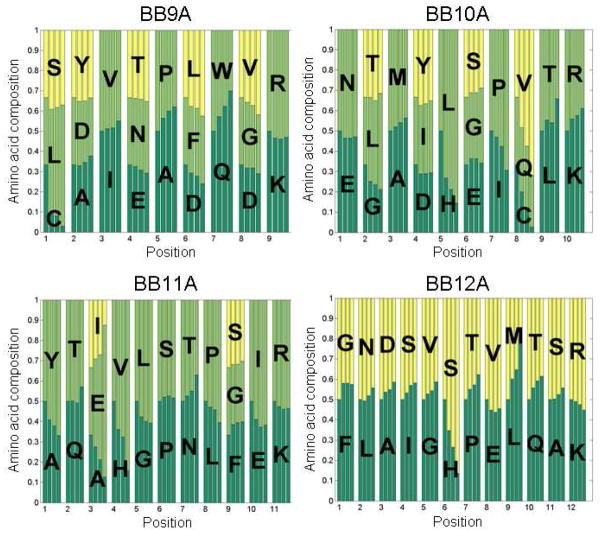
Combinatorial libraries of peptides offer a unique opportunity to study specific and systematic changes in peptide composition. What effect, for example, does a single mutation in a peptide sequence have on its detection in a complex mixture? Biological systems are not well-suited to study this phenomenon as the number of peptides that differ only by a single amino acid substitution is quite low within the proteome of a single organism. In contrast, peptide libraries synthesized combinatorially as described here result in hundreds of sets of peptides for which only one residue is different. Figure 8 illustrates how the point mutation question might be addressed using combinatorial libraries of peptides. At each position, the fractional abundance of the possible amino acids is shown in four bar graphs. The possible amino acids can be thought of as different mutations, and the bar height reflects the fraction of identified peptides with that particular amino acid. The leftmost bar represents amino acids at equal abundance, which the libraries should approximate within the precision of the split-and-mix steps of the synthesis. The second bar from the left shows the fractional abundance of each amino acid for all peptides identified in five replicate LC-MS analyses. The third bar shows the amino acid abundance observed for peptides identified in a single random replicate, and the rightmost bar represents amino acid abundance for peptides that are observed in all five replicates. In this format, one can readily discern the effect of a mutation on detection and the identity of preferred or disfavored amino acids by whether the size of an amino acid’s respective bar changes from left to right. Furthermore, the observed effect of a mutation is expected to become more exaggerated as the identification criteria become more stringent, and this trend is observed in most cases.
Figure 8.
Illustration of the influence of choice of amino acid on likelihood of peptide identification. A set of four bar graphs is assigned to each site for each library. The leftmost bar represents all peptides at equal abundance in a library. The second bar reflects the preference in detection for cumulative peptide identifications after five replicates. The third bar is based on peptides identified in a randomly selected replicate. The fourth bar represents the amino acid preference observed for peptides identified in all five replicates.
Fractional abundances for many sites change very little and remain representative of equal abundance. Not only does this result confirm the robustness of the synthetic approach, but also suggests these mutations have little impact on detectability. One might anticipate a mutation involving similar amino acids to show little preference, as in the case of valine and isoleucine in site 3 of BB9A which vary only by a methylene group. Lack of preference can also be observed, however, for mutations that differ more significantly. Site 4 in BB10A varies between tyrosine, isoleucine, and aspartic acid, yet there is only slight preference (<5% fractional abundance) for the former two at the expense of the latter. Some trends appear to be general; for example, cysteine, histidine, and methionine residues appear to hinder identification. In the case of cysteine and histidine, oxidation arising either during the electrospray ionization or as a result of drying during split-and-mix steps of the synthesis was evaluated to determine if it contributes to this observation. Variable modification of methionine by oxidation was included in all searches, so other than spreading the signal from methionine-containing peptides into multiple MS peaks, which may be significant, this modification is addressed. Database searches with oxidation as a variable modification for cysteine and histidine increased peptide identifications by as much as 10%, though typical levels appear to be only 2% (data not shown). Thus, we conclude that oxidation of cysteine and/or histidine is not the main cause of their disfavor. Histidine may potentially be disfavored because it introduces a basic site in the peptide, increasing the charge state from two to three. The tendency of doubly-charged peptide ions to produce fragmentation spectra with higher Mascot scores might explain the detrimental effect of histidine on identification. Some mutations are preferred in some contexts while disfavored in others. Proline, for instance, is disfavored in competition with alanine at site 5 in BB9A, but is preferred over isoleucine at site 7 in BB10A. Still, little if any preference for proline is observed over serine at site 6 in BB11A. These cases are expected to be the result of more complex mechanisms, such as pair-wise interactions with other amino acids or altered fragmentation pathways. Lastly, it is worth noting that although trends observed in these data might be specific to these libraries, systematic design and analysis of a sufficient number of libraries could elucidate more general interpretations.
Conclusions
We have described our approach to design combinatorial libraries of peptides as a robust and reproducible standard to model the analytical complexity of biological samples. Four libraries of different chain lengths, each containing a few thousand peptides, were adjusted to closely resemble the hydrophobicity distribution and amino acid composition of a typical proteome. Preliminary data from an LCQ ion trap mass spectrometer suggest this sample is sufficiently complex to reproduce some features of a proteome digest sample. When analyzed individually, each library appears to contain a subset of peptides that are repeatedly detected in every replicate analysis, as would the peptides from abundant proteins in a biological sample. Upon combining these four libraries at equal abundance, we observe a chain-length dependence on peptide identification that we tentatively attribute to increased gas-phase basicity of longer peptides. Further work is aimed at determining the extent to which amino acid composition may influence this trend. As a model system, the peptide libraries presented here can be used to determine all 13 chromatography metrics, all 6 sampling metrics, 5 of the 6 ion source metrics (lack of +4 ions), all 11 MS1 signal metrics, all 7 MS2 signal metrics, and 4 of the 5 peptide identification metrics (lack of semi-tryptic peptides) described in a recent CPTAC study.9 Although not investigated in this study, other analytical platforms with different separation techniques, ionization sources, mass analyzers, and data analysis algorithms are expected to produce other limits of detection and optimal injection amounts, especially with more sensitive ion trap instruments. We demonstrate here that even with instruments of modest sensitivity and simple data analysis tools, peptide libraries are useful proteomics models.
Combinatorial libraries are also superb models for probing specific properties relevant to peptide identification (such as those regarding chromatographic retention times or fragmentation patterns) in a systematic fashion. An example of such a study is reported here, which examines the effect of amino acid composition on likelihood of detection in a complex mixture. Some effects seem to be general, such as the bias against detection of cysteine-, methionine-, or histidine-containing sequences. Other amino acid substitutions show varying effects in different contexts, which will likely require additional libraries and more sophisticated data analysis to investigate sufficiently.
Overall, it appears that synthetic peptide libraries provide an alternative or at least a complement to standard biological samples as models of proteome complexity. While biological standards allow evaluation of sample handling and protease digestion protocols, the abundance of individual proteins and peptides in these samples is difficult to characterize. Analytical platform performance can be readily evaluated using well-defined peptide libraries whose complexity and abundance can be carefully controlled and whose sequences are known.
Supplementary Material
Acknowledgments
The authors wish to thank William Running for help in the preparation of the Deinococcus raidiodurans sample, Fred Regnier for insightful comments and discussion, and Jay Levy for assistance with HF cleavage of the synthetic libraries and informative discussions. This work is supported by grants from the National Institutes of Health (R01 RR024236-01A1) and the National Cancer Institute (U24 CA126480-01).
References
- 1.Picotti P, Bodenmiller B, Mueller LN, Domon B, Aebersold R. Cell. 2009;138:795–806. doi: 10.1016/j.cell.2009.05.051. [DOI] [PMC free article] [PubMed] [Google Scholar]
- 2.Anderson NL, Anderson NG. Mol Cell Proteomics. 2002;1:845–867. doi: 10.1074/mcp.r200007-mcp200. [DOI] [PubMed] [Google Scholar]
- 3.Issaq HJ, Xiao Z, Veenstra TD. Chem Rev. 2007;107:3601–3620. doi: 10.1021/cr068287r. [DOI] [PubMed] [Google Scholar]
- 4.Holzmann J, Pichler P, Madalinski M, Kurzbauer R, Mechtler K. Anal Chem. 2009;81:10254–10261. doi: 10.1021/ac902286m. [DOI] [PubMed] [Google Scholar]
- 5.For an example study using the ISB Standard 18 Protein Mixture, see Klimek, J., Eddes, J. S., Hohmann, L., Jackson, J., Peterson, A., Letarte, S., Gafken, P. R., Katz, J. E., Mallick, P., et al. J. Proteome Res. 2008, 7, 96–103.
- 6.For an example study using the Universal Proteomics Standard (Sigma-Aldrich, St. Louis, MO), see Matthiesen, R. Proteomics 2007, 7, 2815–2832.
- 7.Purvine S, Picone AF, Kolker E. OMICS. 2004;8:79–92. doi: 10.1089/153623104773547507. [DOI] [PubMed] [Google Scholar]
- 8.Paulovich AG, Billheimer D, Ham AL, Vega-Montoto LJ, Rudnick PA, Tabb DL, Wang P, Blackman RK, Bunk DM, et al. Mol Cell Proteomics. 2010;9:242–254. doi: 10.1074/mcp.M900222-MCP200. [DOI] [PMC free article] [PubMed] [Google Scholar]
- 9.Rudnick PA, Clauser KR, Kilpatrick LE, Tchekhovskoi DV, Neta P, Blonder N, Billheimer DD, Blackman RK, Bunk DM, et al. Mol Cell Proteomics. 2010;9:225–241. doi: 10.1074/mcp.M900223-MCP200. [DOI] [PMC free article] [PubMed] [Google Scholar]
- 10.Tang H, Arnold RJ, Alves P, Xun Z, Clemmer DE, Novotny MV, Reilly JP, Radivojac P. Bioinformatics. 2006;22:481–488. doi: 10.1093/bioinformatics/btl237. [DOI] [PubMed] [Google Scholar]
- 11.Merenbloom SI, Bohrer BC, Koeniger SL, Clemmer DE. Anal Chem. 2007;79:515–522. doi: 10.1021/ac061567m. [DOI] [PMC free article] [PubMed] [Google Scholar]
- 12.Liu X, Valentine SJ, Plasencia MD, Trimpin S, Naylor S, Clemmer DE. J Am Soc Mass Spectrom. 2007;18:1249–1264. doi: 10.1016/j.jasms.2007.04.012. [DOI] [PMC free article] [PubMed] [Google Scholar]
- 13.http://www.expasy.uniprot.org/database/knowledgebase.shtml.
- 14.Fasman GD, editor. Prediction of Protein Structure and the Principles of Protein Conformation. Plenum Press; New York: 1989. [Google Scholar]
- 15.Lebl M, Krchnak V. Methods Enzymol. 1997;289:336–392. doi: 10.1016/s0076-6879(97)89055-6. [DOI] [PubMed] [Google Scholar]
- 16.Eisenberg D, Schwarz E, Komarony M, Wall R. J Mol Biol. 1984;179:125–142. doi: 10.1016/0022-2836(84)90309-7. [DOI] [PubMed] [Google Scholar]
- 17.Lipton MS, Pasa-Tolic L, Anderson GA, Anderson DJ, Auberry DL, Battista JR, Daly MJ, Fredrickson J, Hixson KK, et al. Proc Natl Acad Sci USA. 2002;99:11049–11054. doi: 10.1073/pnas.172170199. [DOI] [PMC free article] [PubMed] [Google Scholar]
- 18.Wang H, Chang-Wong T, Tang HY, Speicher DW. J Proteome Res. 2010;9:1032–1040. doi: 10.1021/pr900927y. [DOI] [PMC free article] [PubMed] [Google Scholar]
- 19.Gross DS, Williams ER. J Am Chem Soc. 1995;117:883–890. [Google Scholar]
- 20.Petrie S, Javahery G, Bohme DK. Int J Mass Spectrom Ion Processes. 1993;124:145–156. [Google Scholar]
- 21.Petrie S, Javahery G, Wincel H, Bohme DK. J Am Chem Soc. 1993;115:6290–6294. [Google Scholar]
- 22.Petrie S, Javahery G, Wang J, Bohme DK. J Phys Chem. 1992;96:6121–6123. [Google Scholar]
Associated Data
This section collects any data citations, data availability statements, or supplementary materials included in this article.


