Abstract
Background
Community-acquired methicillin-resistant Staphylococcus aureus (CA- MRSA), a novel strain of MRSA, has recently emerged and rapidly spread in the community. Invasion into the hospital setting with replacement of the hospital-acquired MRSA (HA-MRSA) has also been documented. Co-colonization with both CA-MRSA and HA-MRSA would have important clinical implications given differences in antimicrobial susceptibility profiles and the potential for exchange of genetic information.
Methods
A deterministic mathematical model was developed to characterize the transmission dynamics of HA-MRSA and CA-MRSA in the hospital setting and to quantify the emergence of co-colonization with both strains
Results
The model analysis shows that the state of co-colonization becomes endemic over time and that typically there is no competitive exclusion of either strain. Increasing the length of stay or rate of hospital entry among patients colonized with CA-MRSA leads to a rapid increase in the co-colonized state. Compared to MRSA decolonization strategy, improving hand hygiene compliance has the greatest impact on decreasing the prevalence of HA-MRSA, CA-MRSA and the co-colonized state.
Conclusions
The model predicts that with the expanding community reservoir of CA-MRSA, the majority of hospitalized patients will become colonized with both CA-MRSA and HA-MRSA.
Keywords: methicillin resistance, Staphylococcus aureus, community, hospital, co-colonization
1. Background
Methicillin-resistant Staphylococcus aureus (MRSA) has been traditionally considered a hospital-acquired bacteria and is implicated in the great majority of infections acquired in the hospital [15]. The documentation of a novel MRSA strain, which has emerged in the community and has subsequently spread into the hospital, has led to a re-evaluation of the transmission dynamics of MRSA in the healthcare setting [2, 11, 25]. Several population-based surveillance studies have documented that the community-acquired MRSA (CA-MRSA) may be replacing the hospital-acquired MRSA (HA-MRSA) [21, 8, 22]. Mathematical models corroborate these findings and predict that there will be competitive exclusion of HA-MRSA strains by CA-MRSA over time [7].
Previous studies have assumed that individuals can only be colonized or infected with either HA-MRSA or CA-MRSA [14, 7, 18]. Data suggest however, that individual colonization with multiple Staphylococcus aureus strains occurs [3]. Co-colonization with multiple strains of other bacterial species has also been documented [16]. Understanding the emergence and spread of co-colonization with both CA-MRSA and HA-MRSA would have important clinical implications given differences in antimicrobial susceptibility profiles and virulence properties between these two strains [17]. Co-colonization can also result in the horizontal transfer of mobile genetic elements between strains, such as antimicrobial-resistance or virulence determinants. These events may lead to the emergence of MRSA strains with novel biological properties.
We develop here a mathematical model to understand the emergence and spread of co-colonization with both CA-MRSA and HA-MRSA among hospitalized individuals. This model extends a previous model characterizing the transmission dynamics of CA-MRSA into the hospital setting, which assumed that patients could only be colonized or infected with either CA- or HA-MRSA [7]. Key factors, which contribute to the spread of antibiotic-resistant bacteria and their impact on the emergence of a co-colonized state in the hospital setting, are analyzed through model simulations. The impact of an increased influx of patients harboring CA-MRSA into the hospital is quantified using data from population-based surveillance studies, which document an expanding community reservoir of CA-MRSA. Differences in length of stay (LOS) among patients harboring CA-MRSA are also analyzed since patients infected with CA-MRSA can be present with severe infections leading to longer LOS. Infection control strategies aimed at limiting the spread of MRSA and their effect on the emergence of the co-colonized state are evaluated.
2. Methods
A deterministic model is developed to characterize the transmission dynamics of HA-MRSA and CA-MRSA in the hospital setting and to quantify the emergence of co-colonization with both CA-MRSA and HA-MRSA among hospitalized patients. In an accompanying paper, complete mathematical formulations and proofs of the results for the baseline model are presented [23].
D'Agata et al. [7] developed a model which included both CA-MRSA and HA-MRSA. The model did not allow a single patient to be co-colonized with both strains. This model exhibited competitive exclusion. The model tracked changes in five possible states: susceptible patients, patients colonized with CA-MRSA, patients colonized with HA-MRSA, patients infected with CA-MRSA, and patients infected with HA-MRSA. Using linear analysis, local results showed that the strain with the larger basic reproduction number would become endemic in the hospital while the other was extinguished.
For the current study, we first develop a reduced version of D'Agata et al. [7], which only considers colonization and not infection. Colonization precedes infection and therefore to fully understand the transmission of resistant bacteria, focusing on colonization is important. The patient population is therefore split into three compartments: susceptible patients (S), patients colonized with CA-MRSA (C) and patients colonized with HA-MRSA (H). Assuming the hospital is always full, the total number of patients can be conserved at size N = 400. This conservation condition allows us to reduce the model by one dimension, tracking the change in compartments C and H, and letting S = N − C − H (the model is analyzed without this assumption in the accompanying paper, and the local results are qualitatively the same [23]). The reduced version of the model also exhibits competitive exclusion. Since the model is dimension two, we are able to show that the competitive exclusion results are global, meaning not dependent on the number of patients initially in each compartment. Thus, over time and independent of initial conditions, one of the two strains dominates and the other is extinguished.
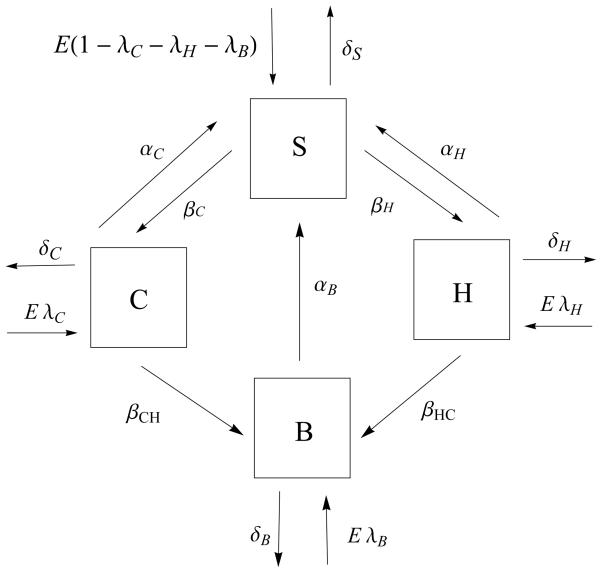
Next, we extend the model to include the possibility of a single patient being co-colonized. Thereby, individuals in the hospital can exist in four exclusive states: susceptible (S), colonized with either CA-MRSA (C), HA-MRSA (H) or both CA- and HA-MRSA (B). Patients enter the hospital as S, C or H. To understand the emergence of the co-colonized state, the model assumes that there is no co-colonization initially and that patients do not enter the hospital in the B state. Patients leave the hospital via death or hospital discharge in all four states. Through contact with a contaminated healthcare workers (HCW), susceptible patients becomes colonized with either CA- MRSA at a rate (1 − η)βC or HA-MRSA at a rate of rate (1 − η)βH. Here, η signifies compliance with hand hygiene measures with 0 ≤η≤ 1, η = 0 corresponds to no compliance and η = 1 corresponds to perfect compliance. Transmission rates of CA-MRSA and HA-MRSA are given by βC and βH respectively. Once in the C or H state, patients can transition to the co-colonization state, B, through contact with a HCW, contaminated with either HA-MRSA or CA-MRSA, with rates (1 −η)βCH or (1 −η)βHC, respectively (see figure 1). The rate of change of the size of the compartments due to the transmission of MRSA in the hospital is then described by the following system of three nonlinear ordinary differential equations:
with S = N−C−H−B. Parameter explanations and values are given in Table 1.
Figure 1.
A compartment model describing the transmission dynamics of CA-MRSA and HA-MRSA in a 400-bed hospital. To conserve the populations, E = δSS + δHH + δCC + δBB. The arrows and parameter values correspond to entry and exit from the 4 compartments (S-susceptible patients, C-patients colonized with CA-MRSA, H-patients colonized with HA-MRSA, and B- patients co-colonized with both strains). The percentages of patients admitted colonized with CA-MRSA, colonized with HA-MRSA, or colonized with both strains are expressed as 100λC, 100λH, and 100λB, respectively. Discharge and death rates from the compartments are expressed as follows: δS, δC, δH, and δB for susceptible patients, patients colonized with CA-MRSA, patients colonized with HA-MRSA, and patients co-colonized with both strains, respectively (with mean length of stays defined as 1/δS, 1/δC, 1/δH, and 1/δB). The colonization rates of susceptible patients to the CA-MRSA compartment is (1 −η)βC and to the HA-MRSA compartment is (1 η)βH. The co-colonization rate from C to the co-colonized compartment (B) is (1 − η)βCH and from H to B is (1 − η)βHC, where 100η signifies the percentage of hand-hygiene compliance (where η = 0 corresponds to 0% compliance and η = 1 corresponds to 100% compliance). The rates of decolonization of patients with CA-MRSA, HA-MRSA, or both strains are given by αC, αH, and αB, respectively.
Table 1.
Parameter values for the transmission dynamics of community-acquired and hospital-acquired methicillin-resistant Staphylococcus aureus colonization (CA-MRSA and HA-MRSA).
| Parameter | Symbol | Baseline Value | Source |
|---|---|---|---|
| Total number of patients | N | 400 | |
|
Percent of admissions per day Colonized CA-MRSA Colonized HA-MRSA |
100 λC 100 λH |
3 7 |
11, 12 BI, 11, 12 |
|
Length of stay Susceptible Colonized CA-MRSA Colonized HA-MRSA Co-colonized |
1/δS 1/δC 1/δH 1/δB |
5 days 5 days 7 days 7 days |
BI BI 7 |
| Hand-hygiene compliance efficacy (as %) | 100 η | 50% | |
|
Transmission rate per susceptible patient to Colonized CA-MRSA per colonized CA-MRSA Colonized HA-MRSA per colonized HA-MRSA |
βC βH |
0.4 per day 0.4 per day |
1, 17 1, 17 |
|
Transmission rate per patient colonized with CA-MRSA to Co-colonized per colonized CA-MRSA |
βCH |
0.4 per day |
1, 17 |
|
Transmission rate per patient colonized with HA-MRSA to Co-colonized per colonized HA-MRSA |
βHC |
0.4 per day |
1, 17 |
|
Decolonization rate per colonized patient per day per length of stay (as %) CA-MRSA HA-MRSA Co-Colonized |
100 αC 100 αH 100 αB |
0% 0% 0% |
8, 22 |
BI: data obtained from the Beth Israel Deaconess Medical Center
The LOS among CA-MRSA colonized patients is assumed to equal to the LOS of susceptible patients in the baseline model (section 2.1.). The LOS for the co-colonized compartment starts after acquisition of the second strain and, as a simplification, is set equal to the larger of the LOS for patients colonized with CA-MRSA or the LOS for patients colonized with HA-MRSA. Since patients colonized with MRSA can develop an infection during their hospitalization, thereby substantially prolonging their LOS, simulations are performed to quantify the impact of an increasing LOS on the transmission dynamics of HA-MRSA, CA-MRSA and the emergence of the co-colonization state. Simulations are also performed to determine the impact of an increase in the percent of patients entering the hospital already colonized with CA-MRSA. Model simulations evaluating the impact of hand-hygiene and decolonization of MRSA colonized patients, two key infection control strategies, are also performed. Since several different decolonization strategies are available with varying efficacy, the decolonization parameters of patients colonized with CA-MRSA (αC), HA-MRSA (αH), or co-colonized (αB) range from 0% efficacy (no decolonization) to 100% efficacy.
The mathematical model assumes that the likelihood of transmission of CA-MRSA and HA-MRSA are equal (βC = βH). In vitro data suggest that the growth rate of CA-MRSA is faster than that of HA-MRSA for certain CA-MRSA strains. This biological difference may allow CA-MRSA to have an advantage towards colonization and subsequent transmission compared to HA-MRSA [20, 1]. To understand the implications of a greater transmission potential among CA-MRSA strains, the baseline model and above simulations are re-analyzed with βC > βH.
Parameter estimates were obtained from infection control data, microbiology data, and patient data from a 400-bed tertiary care hospital with approximately 25,000 admissions per year (see Table 1). Estimates were also obtained from published studies focusing on the epidemiology of CA-MRSA or HA-MRSA (Table 1) [8, 20, 1, 12, 13, 9, 26]. All numerical simulations were performed using Mathematica (Wolfram Research, Inc).
2.1. Baseline model
Here we review the model and summarize the findings of the baseline model [23].
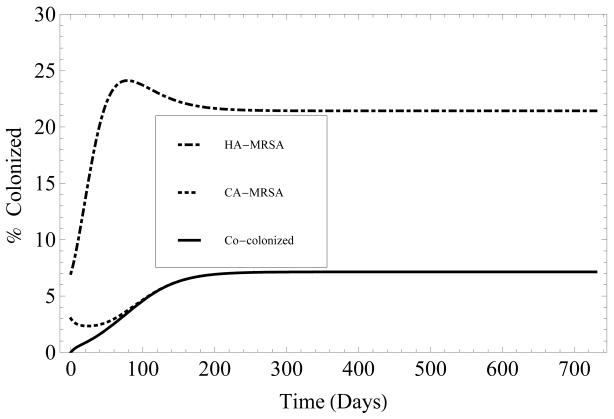
To understand the underlying transmission dynamics of HA- and CA-MRSA and the emergence of co-colonization with both strains, the baseline model first assumes that there is no entry of patients who are already colonized with MRSA into the hospital (λC = λH = λB = 0). Math-ematical analysis shows that when the basic reproduction numbers, for HA-MRSA and for CA-MRSA, satisfy , both HA-MRSA and CA-MRSA are endemic over time. Over time, the prevalence of patients colonized with HA-MRSA exceeds the prevalence of patients colonized with CA-MRSA, since . The greater R0 value associated with HA-MRSA compared to the R0 value associated with CA-MRSA reflects the longer LOS among HA-MRSA patients, which results in greater opportunities for HAMRSA transmission (figure 2). Assuming β = βC = βH = βHC = βCH and α = αC = αH = αB, the analysis also demonstrates that there is no competitive exclusion of either strain, when both and .
Figure 2.
Time evolution, over two years, of the percentage of patients colonized with HA-MRSA (dashed), CA-MRSA (dotted) or both (solid). Length of stay for HA-MRSA and both is 7 days, and 5 days for CA-MRSA. Initially the patient population consists of 90% susceptible patients, 3% of patients colonized with CA-MRSA, 7% of patients colonized with HA-MRSA, and 0% co-colonized. See Table 1 for parameter values.
Additionally, under the preceding assumptions, there exists a disease free equilibrium (DFE) of the system, where all patients are susceptible, S = N and (C, H, B) = (0, 0, 0). By linearizing the system and evaluating the eigenvalues of the Jacobian matrix, we find that the DFE exists for all parameters and is locally asymptotically stable if . This means that if , both strains of MRSA will be extinguished over time.
In addition to the DFE, there are two other analytically known equilibria, EH and EC which describe states where one strain is endemic while the other extinguished over time:
| (2.1) |
| (2.2) |
When EH is stable, HA-MRSA will be endemic in the hospital and CA-MRSA will be extinguished over time. Therefore, the size of the compartments S and H will be positive and the size of compartments C and B will be zero. Symmetrically, when EC is stable, CA-MRSA will be endemic and HA-MRSA will be extinguished over time. A fourth equilibrium, in which the size of every compartment is positive, does not, under these assumptions, have a known analytic form but is consistently found in numerical simulations.
The invasion reproduction numbers [5, 27] IH and IC are threshold parameters which determine the stability of the equilibria EH and EC. When IH > 1 (see equation (2.3)), EH is unstable, CA-MRSA invades, or becomes endemic, and both strains become prevalent in the hospital over time. Conversely, if IH < 1, EH is stable and only HA-MRSA will be endemic in the hospital over time. Symmetrically, when IC > 1, EC is unstable and both strains become endemic over time. Conversely, if IC < 1, EC is stable and only CA-MRSA will be endemic in the hospital.
Using linearization techniques, we found the invasion reproduction number for Eh:
| (2.3) |
A symmetric form is found for IC, since the model is symmetric in C and H.
Assuming both strains are transmitted at the same rate, βC = βH = βCH = βHC and decolonization techniques affect both strains equally, αC = αH = αB, the invasion reproduction number is
| (2.4) |
Under these assumptions, we have found an analytic form for the fourth equilibrium (see Appendix for form), the co-existence equilibrium, where S, C, H and B remain positive over time. When this equilibrium is stable, both strains will be endemic in the hospital.
Finally, if , then IH > 1, and the boundary equilibrium EH is unstable. Also, under these conditions the boundary equilibrium IC > 1 and EC is unstable. Therefore, competitive exclusion does not occur. Numerical simulations confirm these results, showing that over time both strains remain endemic.
Additional analysis shows that, IH > 1, even for some values where . Therefore, under conditions where CA-MRSA would usually become extinct, co-colonization can cause CA-MRSA to remain endemic in the hospital. Symmetric results hold for IC. Thus, neither endemic equilibrium is stable when and , and there is never competitive exclusion.
We note here, that if patients continually enter the hospital colonized with CA-MRSA or HA- MRSA, then neither strain can be completely extinguished.
3. Results of Numerical Simulations
In this section, we study how varying the transmission rate, percentage of patients entering colonized, the length of stay of patients colonized with CA-MRSA, and treatment efficacy, affect the long-term behavior of the model.
3.1. Numerical simulation 1: increased transmission of CA-MRSA and HA- MRSA
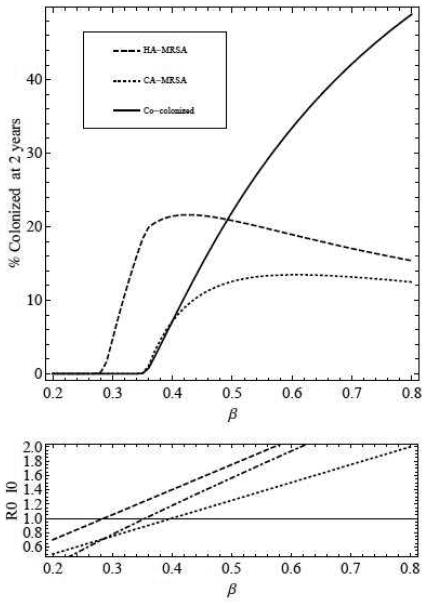
Increasing patient-to-patient transmission through patient contact with HCW contaminated with either HA-MRSA or CA-MRSA results in a substantial increase in the percent of co-colonized patients. As transmission increases, more patients are colonized with MRSA and less are susceptible, and as a result more patients that are colonized with individual strains become co-colonized. Above a threshold value of β, the percent of patients co-colonized with both strains exceeds those colonized with either CA-MRSA or HA-MRSA (figure 3).
Figure 3.
Top - percentage of patients colonized with HA-MRSA (dashed), CA-MRSA (dotted), and both (solid) after 2 years, as transmission (β = βC = βH = βCH = βHC) is increased. Bottom - (dashed) and (dotted) as transmission is increased. The invasion reproduction number I0Eh is plotted with the dash-dotted line (see equation (2.3) for formula for IH).
3.2. Numerical simulation 2: increasing the influx of patients colonized with CA-MRSA into the hospital and their LOS
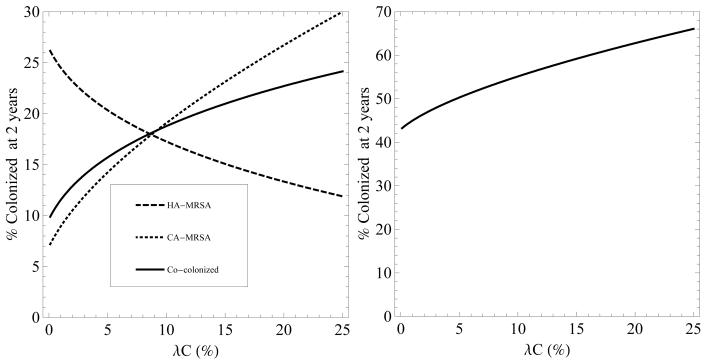
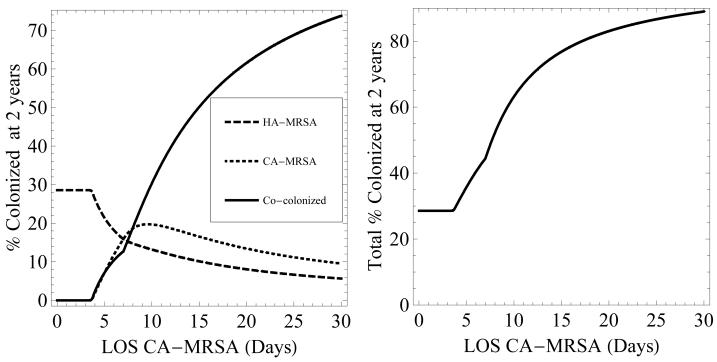
Increasing the rate of admission of patients colonized with CA-MRSA or increasing their LOS results in an increase in the co-colonized state (figures 4 and 5). LOS has a substantially greater impact on the prevalence of co-colonization compared to rate of admission. Even a minimal increase in LOS from the baseline value of 5 days to 8 days leads to the majority of colonized patients represented by the co-colonized state. The predominance of the co-colonization state when LOS increases is explained by the increased opportunity for HA-MRSA colonized patients to become colonized with CA-MRSA and become colonized with both strains. An increase in the number of patients entering the hospital already co-colonized also increases the growth in the number of co-colonized patients over time (results not shown).
Figure 4.
Left - percentage of patients colonized with HA-MRSA (dashed), CA-MRSA (dotted), and both (solid) after two years, as the percentage of patients entering the hospital already colonized with CA-MRSA (λC) is increased. Right - the total percentage of patients colonized with MRSA after 2 years as λC is increased. In both figures, 100λH = 7% and 100λB = 0%.
Figure 5.
Left - percentage of patients colonized with HA-MRSA (dashed), CA-MRSA (dotted), and both (solid) after 2 years, as the length of stay of patients colonized with CA-MRSA is increased. Right - the total percentage of patients colonized with MRSA after 2 years as LOS is increased. LOS of patients with HA-MRSA is 7 days. LOS of patients colonized with both strains equals the greater of the LOS of patients colonized with CA-MRSA or HA-MRSA.
3.3. Numerical simulation 3: interventions to prevent transmission
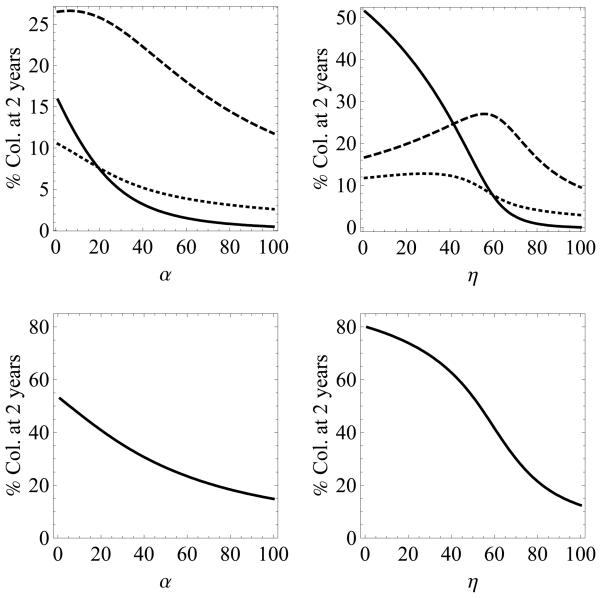
The effect of two standard interventions aimed at preventing the transmission of MRSA, improving compliance with hand-hygiene and maximizing the efficacy of decolonization of patients with MRSA, were evaluated in simulations which included an influx of patients harboring HA-MRSA or CA-MRSA. Both interventions decrease the percentage of colonized patients in all three states. Compared to decolonization, improving hand-hygiene has the greater impact with even small increases in compliance having a substantial effect in the overall prevalence of MRSA. Since there is a constant influx of colonized patients into the hospital setting, CA- and HA-MRSA are never eradicated from the hospital even at 100% hand-hygiene compliance or 100% decolonization efficacy. In contrast, the absence of an influx of patients who are co-colonized into the hospital explains the extinction of the B state when these two interventions are at 100% compliance or efficacy. As hand-hygiene compliance increases, the total percentage of patients colonized decreases monotonically. However, simulations show that after 2 years, the percentage of patients who only have HA-MRSA increases until hand-hygiene reaches about 45% (figure 6).
Figure 6.
Top - percentage of patients colonized with HA-MRSA (dashed), CA-MRSA (dotted), and both (solid) after 2 years, versus two interventions: left - decolonization (α) and right - hand-hygiene compliance (η). Bottom - sum of percentages of patients colonized with either or both strains of MRSA. The admission percentages are 100λC = 3%, 100λH = 7%, 100λB = 0%.
The explanation for this finding is as follows. Susceptible patients move to the single colonized state with a rate (1 −η)β and from the single colonized state to the both state with a rate (1 η)β. Therefore, there is a quadratic effect of hygiene on transmission to the co-colonized state. When hand-hygiene compliance is low (and the co-colonized compartment is large), the quadratic effect of increasing hand-hygiene compliance, causes a rapid reduction of the co-colonized compartment, and increases the population of susceptible patients in the equilibrium. Transmission to the single colonization compartments (C and H) is dependent on both η and S by the term (1 − η)βS/N. Until hand-hygiene reaches about 45%, the rise in S due to the quadratic effect on the co-colonization state is stronger than the reduction in transmission due to increasing η. Ergo, the sizes of the C and H compartments increase.
3.4. Numerical simulations assuming greater transmission potential for CA-MRSA compared to HA-MRSA
The overall results of simulations with βC = 1.33βH were similar to those with βC = βH except for a greater and more rapid increase in CA-MRSA and co-colonized patients (data not shown).
4. Discussion
The transmission dynamics of MRSA in the hospital setting are complex and require the analysis of numerous interrelated and dynamic factors. The emergence of CA-MRSA and its invasion into the hospital setting has led to further complexities in understanding not only the spread of MRSA, but also the selection of effective antimicrobial therapies and preventive strategies. Since epidemiological studies cannot fully address these complexities, a mathematical model was developed to specifically quantify the emergence of individuals co-colonized with both CA-MRSA and HA-MRSA strains.
The deterministic model shows that over time, there will typically be no competitive exclusion of either strain but that both CA-MRSA and HA-MRSA will co-exist in the hospital setting. The model also shows that individuals co-colonized with both strains will increase in prevalence over time and will predominate over individuals who are colonized with either CA-MRSA or HA-MRSA. These findings have important implications. First, clinical cultures will usually identify only one strain, either CA-MRSA or HA-MRSA. Mathematical models have shown that 20 colonies per patient need to be sampled to reliably estimate the occurrence of multiple strains [4]. Since sampling of multiple colonies is not feasible, co-colonization and polyclonal infections will therefore not be routinely detected. The different antimicrobial susceptibility profiles of CA-MRSA and HA-MRSA and identification of only one strain may therefore lead to incorrect antimicrobial therapy. The emergence of multidrug-resistant strains of CA-MRSA, with susceptibility profiles similar to HA-MRSA, will allow selection of antimicrobials that are effective against both strains [10].
Factors which increase the reservoir of CA-MRSA in the hospital setting were shown to have substantial effects on the magnitude of the co-colonized patient population. Increasing the influx of patients harboring CA-MRSA into the hospital and increasing their LOS resulted in a rapid increase in the number of co-colonized patients. Previous mathematical models have also demonstrated that these two factors are central to the dissemination of antimicrobial-resistant bacteria [7, 6]. Our model illustrates that even small increases in LOS of only few days from a conservative baseline estimate of 5 days among CA-MRSA patients resulted in the rapid predominance of patients colonized with both strains. CA-MRSA is associated with severe infections and several studies have documented that CA-MRSA has become the predominant MRSA strain implicated in the great majority of nosocomial blood stream infections and surgical site infections [21, 19, 24]. These nosocomial infections would thus substantially extend the LOS of patients harboring CA- MRSA.
Our model revealed the effects of two interventions targeting the prevention of MRSA spread: improving compliance with hand-hygiene and decolonization strategies. Both interventions decreased the prevalence of HA-MRSA, CA-MRSA and co-colonization. As shown in previous models, improving hand-hygiene compliance had the greatest effect with even small improvements in compliance [7].
Several assumptions were made to simplify the model. First, antibiotic pressure, exposure to antibiotics which eradicates the antimicrobial-susceptible flora allowing the resistant flora to overgrow and predominate, and its effect on the transmission dynamics of CA-MRSA and emergence of co-colonization were not assessed. Given the different susceptibility profiles between HA-MRSA and CA-MRSA, selective antibiotic pressure may alter the transmission dynamics between HA-MRSA and CA-MRSA. We also assumed that decolonization measures would affect both strains equally. It is possible that antimicrobial agents will affect the strains differently, allowing a patient that is co-colonized to return to a single disease state directly, but currently there is no evidence of this. Second, environmental contamination was not included since there is a paucity of data regarding differences in contamination of inanimate surfaces between CA-MRSA and HA-MRSA. Future models will need to include these factors. Our main model assumed that the likelihood of transmission between CA-MRSA and HA-MRSA from HCW to patient and vice versa was equal. In vitro studies have shown that the growth rate of certain CA-MRSA strains is faster compared to HA-MRSA strains, suggesting that CA-MRSA may have an advantage towards colonization and therefore greater transmissibility [20, 1]. Model simulations using greater transmission parameters for CA-MRSA showed similar conclusions to the baseline model except for more rapid dynamics of CA-MRSA spread and emergence of co-colonization. Lastly, a deterministic model was used which compartmentalized patients into homogeneous groups and so individual-level behavior was not addressed. Although stochastic individual-based models can simulate the heterogeneity of patients and HCW interactions, the increase in behavioral details provided by these models may result in greater difficulty in interpretation of findings.
Colonization with different strains and species of bacteria is common [16]. This study quantified the emergence and spread of co-colonization with both CA-MRSA and HA-MRSA. The study demonstrated that the expanding community reservoir of CA-MRSA resulting in an increase influx of CA-MRSA patients into the hospital setting coupled with prolonged LOS associated with severe CA-MRSA infections will rapidly lead to a predominance of patients who are colonized with both strains. The impact of these findings on patient outcomes, and the potential for transfer of genetic information between these strains will require ongoing evaluation.
5. Conclusion
As the community reservoir of CA-MRSA grows, the majority of hospitalized patients will be co-colonized. Converse to previous models which exhibited competitive exclusion, the model presented in this paper shows that competitive exclusion is lost when patients can be co-colonized with both CA-MRSA and HA-MRSA.
Acknowledgements
This work was supported in part by the joint DMS/NIGMS Initiative through the National Institute of Health Grant R01GM083607 (EMCD, GFW, JP).
Appendix
We analyze a perfect screening model where λC = λH = λB = 0. Then we assume that all transmission rates and decolonization rates are equal (β = βC = βH = βCH = βHC and α = αC = αH = αB). To simplify analysis, we absorb (1 − η)/N into the transmission term, so that β̄ = (1 −η)β/N. The transmission dynamics are then represented by
and the co-existence equilibrium is given by
Footnotes
AMS subject classification: 34B60, 37N25, 46N60, 62P10
Competing Interests
Potential Conflicts of interest: EMCD, GFW, JP no conflicts.
References
- 1.Baba T, Takeuchi F, Kuroda M, Yuzawa H, Aoki K, Oguchi A, Nagai Y, Iwama N, Asano K, Naimi T. Genome and virulence determinants of high virulence community-acquired MRSA. Lancet. 2002;359(No. 9320):1819–1827. doi: 10.1016/s0140-6736(02)08713-5. [DOI] [PubMed] [Google Scholar]
- 2.Bassetti M, Nicco E, Mikulska M. Why is community-associated MRSA spreading across the world and how will it change clinical practice? International Journal of Antimicrobial Agents. 2009;34(No. S1):S15–S19. doi: 10.1016/S0924-8579(09)70544-8. [DOI] [PubMed] [Google Scholar]
- 3.Cespedes C, Saïd-Salim B, Miller M, Lo SH, Kreiswirth BN, Gordon RJ, Vavagiakis P, Klein RS, Lowy FD. The clonality of Staphylococcus aureus nasal carriage. J. Infect. Dis. 2005;191:444–452. doi: 10.1086/427240. [DOI] [PubMed] [Google Scholar]
- 4.Coen PG, Wilks M, Dall'Antonia M, Millar M. Detection of multiple-strain carriers: the value of re-sampling. J. Theor. Biol. 2006;240(No. 1):98–103. doi: 10.1016/j.jtbi.2005.08.031. [DOI] [PubMed] [Google Scholar]
- 5.Crawford B, Kribs Zaleta CM. The impact of vaccination and coinfection on HPV and cervical cancer. Discrete and Continuous Dynamical Systems Series B. 2009;12(No. 2):279–304. [Google Scholar]
- 6.D'Agata EMC, Webb GF, Horn M. A mathematical model quantifying the impact of antibiotic exposure and other interventions on the endemic prevalence of vancomycin-resistant Enterococci. J. Infect. Dis. 2005;192:2004–2011. doi: 10.1086/498041. [DOI] [PubMed] [Google Scholar]
- 7.D'Agata EMC, Webb GF, Horn MA, Moellering RC, Ruan S. Modeling the invasion of community-acquired methicillin-resistant Staphylococcus aureus into hospitals. Clin. Infect. Dis. 2009;48(No. 3):274–284. doi: 10.1086/595844. [DOI] [PMC free article] [PubMed] [Google Scholar]
- 8.Davis SL, Rybak MJ, Amjad M, Kaatz GW, McKinnon PS. Characteristics of patients with healthcare-associated infection due of SCCmec Type IV methcillin-resistant Staphylococcus aureus. Infect. Control Hosp. Epidemiol. 2006;27:1025–1031. doi: 10.1086/507918. [DOI] [PubMed] [Google Scholar]
- 9.Diekema DJ, Climo M. Preventing MRSA infections: finding it is not enough. JAMA. 2008;299(No. 10):1190–1192. doi: 10.1001/jama.299.10.1190. [DOI] [PubMed] [Google Scholar]
- 10.Diep BA, Chambers HF, Graber CJ, Szumowski JD, Miller LG, Han LL, Chen JH, Lin F, Lin J, Phan TH, Carleton HA, McDougal LK, Tenover FC, Cohen DE, Mayer KH, Sensabaugh GF, Perdreau-Remington F. Emergence of multidrug-resistant, community-associated methicillin-resistant Staphylococcus aureus clone USA300 in men who have sex with men. Ann. Intern. Med. 2008;148(No. 4):249–257. doi: 10.7326/0003-4819-148-4-200802190-00204. [DOI] [PubMed] [Google Scholar]
- 11.Herold BC, Immergluck LC, Maranan LC, Lauderdale D, Gaskin R, Boyle-Vavra S, Leitch CD, Daum RS. Community-acquired methicillin-resistant Staphylococcus aureus in children with no identified predisposing risk. JAMA. 1998;279(No. 8):593–508. doi: 10.1001/jama.279.8.593. [DOI] [PubMed] [Google Scholar]
- 12.Hidron AI, Kourbatova EV, Halvosa JS, Terrell BJ, McDougal LK, Tenover HM, King MD. Risk factors for colonization with methicillin-resistant Staphylococcus aureus (MRSA) in patients admitted to an urban hospital: emergence of community-associated MRSA nasal carriage. Clin. Infect. Dis. 2005;15:159–166. doi: 10.1086/430910. [DOI] [PubMed] [Google Scholar]
- 13.Jarvis WR, Schlosser J, Chinn RY, Tweeten S, Jackson M. National prevalence of methicillin-resistant Staphylococcus aureus in inpatients at US health care facilities. Am. J. Infect. Control. 2007;35(No. 10):631–637. doi: 10.1016/j.ajic.2007.10.009. [DOI] [PubMed] [Google Scholar]
- 14.Kajita E, Okano JT, Bodine EN, Layne SP, Blower S. Modelling an outbreak of an emerging pathogen. Nat. Rev. Microbiol. 2007;5:700–709. doi: 10.1038/nrmicro1660. [DOI] [PubMed] [Google Scholar]
- 15.Klevens RM, Morrison MA, Nadle J, Petit S, Gershman K, Ray S, Harrison M, Lynfield R, Dumyati G, Townes JM, Craig AS, Zell ER, Fosheim GE, McDougal LK, Carey RB, Fridkin SK. Invasive methicillin-resistant Staphylococcus aureus infections in the United States. JAMA. 2007;298:1763–1771. doi: 10.1001/jama.298.15.1763. [DOI] [PubMed] [Google Scholar]
- 16.Lautenbach E, Tolomeo P, Black N, Maslow J. Risk factors for fecal colonization with multiple distinct strains of Escherichia coli among long-term care facility residents. Infect. Control Hosp. Epidemiol. 2009;30:491–493. doi: 10.1086/597234. [DOI] [PMC free article] [PubMed] [Google Scholar]
- 17.Li J, Zhien M, Blythe SP, Castillo-Chavez C. Coexistence of pathogens in sexually-transmitted disease models. J. Math. Biol. 2003;47(No. 6):547–568. doi: 10.1007/s00285-003-0235-5. [DOI] [PubMed] [Google Scholar]
- 18.McBryde ES, Pettitt AN, McElwain DLS. A stochastic mathematical model of methicillin resistant Staphylococcus aureus transmission in an intensive care unit: predicting the impact of interventions. J. Theor. Biol. 2007;245(No. 3):470–481. doi: 10.1016/j.jtbi.2006.11.008. [DOI] [PubMed] [Google Scholar]
- 19.Miller LG, Perdreau-Remington F, Rieg G, Mehdi S, Perlroth J, Bayer AS, Tang AW, Phung TO, Spellberg B. Necrotizing fasciitis caused by community-associated methicillin-resistant Staphylococcus aureus in Los Angeles. New Engl. J. Med. 2005;352(No. 14):1445–1453. doi: 10.1056/NEJMoa042683. [DOI] [PubMed] [Google Scholar]
- 20.Okuma K, Iwakawa K, Turnidge JD, Grubb WB, Bell JM, O'Brien FG, Coombs GW, Pearman JW, Tenover FC, Kapi M, Tiensasitorn C, Ito T, Hiramatsu K. Dissemination of new methicillin-resistant Staphylococcus aureus clones in the community. J. Clin. Microbiol. 2002;40(No. 11):4289–4294. doi: 10.1128/JCM.40.11.4289-4294.2002. [DOI] [PMC free article] [PubMed] [Google Scholar]
- 21.Patel M, Waites KB, Hoesley CJ, Stamm AM, Canupp KC, Moser SA. Emergence of USA 300 MRSA in a tertiary medical centre: implications for epidemiological studies. J. Hosp. Infect. 2008;68(No. 3):208–213. doi: 10.1016/j.jhin.2007.12.010. [DOI] [PubMed] [Google Scholar]
- 22.Popovich KJ, Weinstein RA, Hota B. Are community-associated methicillin-resistant Staphylococcus aureus (MRSA) strains replacing traditional nosocomial MRSA strains? Clin. Infect. Dis. 2008;46:787–794. doi: 10.1086/528716. [DOI] [PubMed] [Google Scholar]
- 23.Pressley J, D'Agata EMC, Webb GF. The effect of co-colonization with community-acquired and hospital-acquired methicillin-resistant Staphylococcus aureus strains on competitive exclusion. doi: 10.1016/j.jtbi.2010.03.036. To appear. [DOI] [PMC free article] [PubMed] [Google Scholar]
- 24.Seybold U, Kourbatova EV, Johnson JG, Halvosa SJ, Wang YF, King MD, Ray SM, Blumberg HM. Emergence of community-associated methicillin-resistant Staphylococcus aureus USA 300 genotype as a major cause of health care-associated blood stream infections. Clin. Infect. Dis. 2006;42:647–666. doi: 10.1086/499815. [DOI] [PubMed] [Google Scholar]
- 25.Tristan A, Bes M, Meugnier H, Lina G, Bozdogan B, Courvalin P, Reverdy M, Enright M, Vandenesch F, Etienne J. Global distribution of Panton-Valentine Leukocidin-positive methicillin-resistant Staphylococcus aureus. Emerg. Infect. Dis. 2007;13(No. 4):594–600. doi: 10.3201/eid1304.061316. [DOI] [PMC free article] [PubMed] [Google Scholar]
- 26.Wertheim HF, Verveer J, Boelens HA, Belkum van A., Verbrugh HA, Vos MC. Effect of mupirocin treatment on nasal, pharyngeal, and perineal carriage of Staphylococcus aureus in healthy adults. Antimicrob. Agents Chemother. 2005;49(No. 4):1465–1467. doi: 10.1128/AAC.49.4.1465-1467.2005. [DOI] [PMC free article] [PubMed] [Google Scholar]
- 27.Xiridou M, Borkent-Raven B, Hulshof J, Wallinga J. How hepatitis D virus can hinder the control of hepatitis B virus. PLoS ONE. 2009;4:e5247. doi: 10.1371/journal.pone.0005247. 4. [DOI] [PMC free article] [PubMed] [Google Scholar]


