

1. Introduction
It is often useful to measure a number of variables in the same tissue. However, in some cases the procedures for sample preparation involve incompatible methods. For example, one compound might require homogenization in a neutral buffer, another a harsher detergent designed to break up the tissue structure, while a third requires acid homogenization or microwave irradiation to protect the compound of interest. Yet, by requiring different starting conditions for sample preparation, one significantly increases the number of samples or even the number of animals required. In addition to added cost and time, this inevitably introduces biological variability, since comparisons then also include additional variability between distinct biological samples.
The goal of this study was to develop and validate assays of several different compounds from a single tissue sample despite the need for different preparation conditions. We accomplished this in two ways. First, we demonstrate that sonicating samples in water followed by aliquoting into acid or lysis buffers can be followed by high performance liquid chromatography (HPLC) or western immunoblotting, respectively. Second, we show that cardiac perfusion with the serine/threonine phosphatase inhibitor NaF preserves the phosphorylation state of several phosphoproteins. Some molecules are adversely affected by these treatments, but can still be measured. Because of our interest in Parkinson's disease, we use as examples the biogenic amines dopamine (DA) and serotonin (5-hydroxytryptamine; 5-HT) and their metabolites homovanillic acid (HVA), dihydroxyphenyl acetic acid (DOPAC) and 5-hydroxyindoleacetic acid (5-HIAA), as well as several specific proteins, including the high affinity dopamine transporter (DAT), phospho- and total forms of the enzyme for DA biosynthesis tyrosine hydroxylase (TH), and the phosphokinases ERK1/2 and Akt. ERK1/2 and Akt are of broad interest as they play integral roles in cell fate decisions, both centrally and peripherally (Anjum and Blenis 2008; Liu et al. 2009).
2. Methods
2.1. Animals
All comparisons were made between animals killed on the same day and from tissue processed and assayed in side-by-side fashion. Adult male Sprague-Dawley rats (200-300 gm) purchased from Hilltop Lab Animals Inc. (Scottsdale PA) were pair-housed in microisolator-style polypropylene cages in a 12:12 light:dark cycle and provided with water and Purina Rat Chow ad libitum. All treatments were approved by the Institutional Animal Care and Use Committee of the University of Pittsburgh and were in accord with guidelines for animal welfare provided by the National Institutes of Health. Following a minimum 2-day acclimatization period to the animal facility, all animals were anesthetized with intraperitoneal sodium pentobarbital (100mg/kg). To enhance phosphorylation signal, some animals were also perfused with 50ml of 10mM NaF, a Ser/Thr phosphatase inhibitor (Chabre 1990) in 0.1M phosphate buffered saline (4°C, pH 7.2). This concentration has low cytotoxicity, even after 2 hr treatments of live cells (Cheng et al. 1998). In perfused rats, an 18-gauge needle was inserted through the left ventricle into the aortic arch and attached to a peristaltic pump delivering 40 ml/min (Series 913 Mity-Flex, Anko Products, Northbrook IL). The right auricle was cut to let perfusate circulate. Unperfused animals were sacrificed at the same time. Striata were removed in a sterile dish on wet ice and tissue was frozen on Dry Ice within an average of 8 min for perfused rats and 4 min for unperfused rats. Tissue was stored at -80°C until weighing (see below).
2.2. Materials and Tissue Preparation
All reagents were of the highest purity available and purchased from Sigma-Aldrich (St. Louis, MO) unless specified otherwise. All tubes (1.5ml, Fisher Scientific Cat.No 05-408-129, Pittsburgh PA) were chilled on ice before use (tube interior at 5°C) and ice-chilled solutions (see below) were added to the still-frozen tissue punches immediately after weighing. Using the standard method, samples were sonicated in an ice-cold water bath in a volume proportional to weight in one of two solutions: (1) 0.1N HClO4 for HPLC or (2) a lysis buffer solution for Western blotting (Cell Signaling Technologies, Cat.No. 9803), reconstituted in 0.1% SDS and with 1× protease inhibitor cocktail (Sigma-Aldrich, Cat.No. 8340). Thus, every 1mg of wet tissue was sonicated in 20μl of these solutions (Omni-Ruptor 400, Omni International, Kennesaw GA). We compared this simultaneously to an experimental method designed to use single samples for multiple procedures. In this case, we sonicated striatal tissue in double-processed Tissue Culture Water (deionized and double-distilled; Sigma-Aldrich, Cat.No. W3500), followed by mixing into an equal volume of twice the normal concentration of HClO4 (0.2N, for analysis by HPLC) or twice the normal concentration of lysis buffer (for Western blotting, see above). Thus, every 1mg of tissue was sonicated in 10μl of water followed by addition of 10μl of the concentrated stock solutions.
Immediately before water sonication the measured pH of the water registered at 5.27 at 10°C, whereas after water sonication the pH of the sample in water was 7.16 at 13°C. The lysis buffer pH was originally at 7.83 at 5°C. After addition of 2× lysis buffer the final pH of the sample was 7.18 at 7°C. HClO4 was originally at a pH of 1.24 at 5°C. After addition of 2× HClO4 the final pH of the sample was 1.72 at 7°C. When samples were directly sonicated in 1× lysis buffer, the final pH was 7.18 at 13°C. When samples were directly sonicated in 1× HClO4 the final pH was 1.53 at 14°C. Sonication lasted 17-45 sec and the aliquoting procedure required 5-8 sec. Final homogenates were frozen on Dry Ice and stored at -80°C within 1-2 min from weighing until assay.
2.3. Western blotting
Samples were separated on standard SDS acrylamide gels and transferred to Immobilon FL PVDF membranes (BioRad Laboratories, Hercules CA). Blots were blocked in 3% bovine serum albumin in Tris-buffered saline with 0.1% tween (TBS-tween) or a blocking serum (Li-Cor Biosciences, Cat. No. 927-40000, Lincoln NE) for 1 hr prior to incubation overnight at 4°C in primary antibody made in the same blocking solution. Antibodies included rabbit anti-phospho-ERK1/2 (Cell Signaling Cat.No. 9101, Beverly MA), mouse anti-phospho-ERK1/2 (Sigma-Aldrich Cat.No. M8159), rabbit anti-total ERK1/2 (Cell Signaling Cat.No. 9102), mouse anti-total ERK1/2 (Millipore Cat.No. 05-1152), rabbit anti-phospho-Akt (Cell Signaling Cat.No. 9271), mouse anti-total Akt (Cell Signaling Cat.No. 2920), rabbit anti-phospho-Ser31 TH (Millipore Cat.No. AB5423, Temecula CA), rabbit anti-phospho-Ser19 TH (Millipore Cat.No. AB5425), mouse anti-total TH (Millipore Cat.No. MAB318), and goat anti-DAT (Santa Cruz C-20, Cat.No. sc-1433, Santa Cruz CA). Mouse anti-β-actin (Sigma-Aldrich Cat.No. A5441), rabbit anti-GAPDH (Novus Cat.No. ab9485, Littleton CO), or mouse anti α-tubulin (Sigma-Aldrich Cat.No. T5168) were used to control for differences in protein loading. After incubation with primary antibody, blots were washed in TBS-tween and incubated with donkey or goat secondary antibodies raised against the appropriate IgG (700 and 800nm, Li-Cor Biosciences) for 1hr at room temperature. After washing, protein bands were visualized on an Odyssey Infrared Imager and quantified with Odyssey software (Li-Cor). Immunostained bands were at the expected molecular weight for the protein of interest and omission of primary resulted in loss of signal.
2.4. HPLC
The concentration of DA, 5-HT, and their metabolites were measured by HPLC-EC using minor modifications of methods described previously (Smith et al. 2002). Tissue was sonicated as above, suspended in 0.1N HClO4, and centrifuged at 16,000×g for 15 min at 4°C. The supernatant was assayed by injecting a 10μl aliquot onto a reverse phase column (2.0 × 150 mm, ESA Inc. Chelmsford, MA). The mobile phase consisted of 50mM H2NaPO4, 0.72mM sodium octyl sulfate, 0.075mM Na2EDTA and 10% methanol (v/v), pH 2.7. The mobile phase was pumped through the system at 0.3 ml/min using an ESA 580 pump (ESA Inc). Analyses were performed using an ESA Coulochem Model 4100A detector, an ESA Model 5010 conditioning cell, and an ESA Model 5014B microdialysis cell (ESA, Inc). Settings for detection were E1=-75mV, E2=+220mV, and guard cell=+350mV.
2.5. Statistical analyses
All comparisons were made using the Student's two-tailed t-test with significance set at p≦0.05. Sample sizes were as follows: n=4 sonicated in buffer, n=3 sonicated in HClO4, n=8 sonicated in water, n=4-7 unperfused, n=5-7 NaF perfused rats.
3. Results
3.1 Effect of water sonication on biogenic amines and their metabolites
Sonicating striatal tissue in water and then aliquoting into HClO4 resulted in the same values for DA, HVA, 5-HT, and 5-HIAA levels as were obtained when samples were sonicated directly into HClO4. DA, HVA, and DOPAC levels are shown in Figure 1. Only DOPAC was differentially affected, being 66% higher when samples were first sonicated in water (two-tailed t-test). Supplemental Figure 1 illustrates the lack of effect on 5-HT and 5-HIAA levels.
Figure 1.

Levels of dopamine (DA), homovanillic acid (HVA), dihydroxyphenyl acetic acid (DOPAC), tyrosine hydroxylase (TH), phosphorylation of TH at Ser 31, the dopamine transporter (DAT), and phosphokinases ERK1/2 and Akt with sonication in water (dark gray bars) prior to immersion in a concentrated stock of HClO4 acid (perchloric acid or PCA) or of lysis buffer, contrasted with direct sonication in PCA or lysis buffer (light gray bars). DOPAC was raised by water sonication. No effects of water sonication were observed on phenotypic proteins TH and DAT. A trend towards a drop in pERK1 and pERK2 levels and a slight but significant effect on pAkt was seen, expressed as a fraction of total ERK and Akt levels (see Supplemental Figure 1). Multiple representative cases on fluorescent immunoblots are shown for each molecule. Protein loading was assessed with β-actin, α-tubulin, and glyceraldehyde 3-phosphate dehydrogenase (GAPDH). All graphs depict means + SEM. P values are from two-tailed t-test.
3.2 Effect of water sonication on TH, DAT, ERK, and Akt
Phenotypic markers of DA neurons were compared in samples first sonicated in water and then aliquoted into lysis buffer with those sonicated directly in lysis buffer. There was no significant difference in total TH enzyme protein (Figure 1) or its phospho-forms pSer 19 (not shown) and pSer 31 or in levels of DAT (Figure 1). Total ERK1 and ERK2 levels also were unaffected by sonication in water (Supplemental Figure 1), though there was a trend toward a fall in pERK1 (-28%) and pERK2 (-39%), when expressed as a ratio of total ERKs (Figure 1). In addition, there was no effect on total Akt levels (Supplemental Figure 1), although a small but significant reduction in pAkt / total Akt was observed (-16%) (Figure 1).
3.3. Impact of NaF perfusions on HPLC measurements
No change was observed in DA levels with NaF perfusions relative to unperfused control animals (Figure 2). DOPAC levels were raised significantly (+32%), and there was a trend towards a rise in HVA (29%). No effect of NaF on 5-HT or 5-HIAA was seen (not shown).
Figure 2.
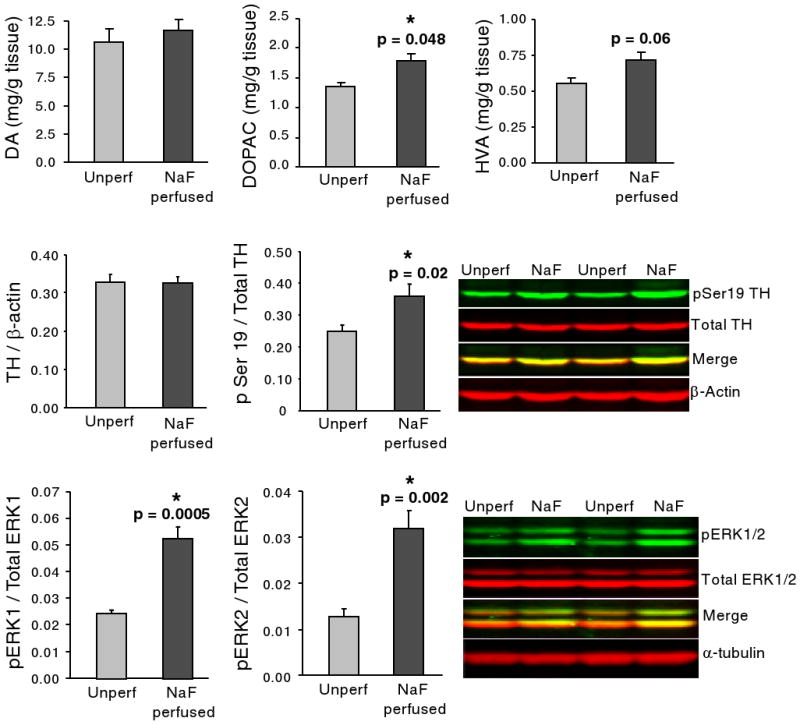
Effect of NaF perfusion (dark gray bars) on DA, DOPAC, HVA, TH, pSer19 TH, and pERK1/2 relative to rapidly decapitated animals that were not perfused (light gray bars). A significant rise in DOPAC and a trend towards a rise in HVA were observed in NaF perfused rats. A significant rise in pSer19 TH and pERK1/2 was also observed, with no alteration in total TH or ERK1/2. Protein loading was assessed with β-actin and α-tubulin. All graphs depict means + SEM. P values are from two-tailed t-test.
3.4. Impact of NaF perfusions on phosphorylation state
The effect of perfusion with NaF on phosphorylation state of TH and the kinases ERK1/2 and Akt was examined. We found that NaF perfusion increased the amount of recoverable phospho-TH Ser 19 by 46% (Figure 2), whereas there was no significant change in phospho-TH Ser31 (not shown). Total TH levels were also unaffected (Figure 2), as were levels of DAT (not shown). Although the amount of pAkt was unaffected by NaF perfusions (not shown), we found that pERK1 levels were increased by 117% and pERK2 levels by 148% (Figure 2) with no concomitant change in total ERKs or total Akt (Supplemental Figure 1).
4. Discussion
We have carefully examined the use of sonication in water before splitting tissue into different solutions as a means to (a) reduce biological variability, (b) minimize preparation time, and (c) lower animal number and costs. We found that the concentrations of most, but not all, of the molecules were unaffected. In addition, we observed a rise in phosphorylation levels of several proteins when we perfused animals with a NaF-containing buffer.
4.1. Effect of water sonication and NaF perfusions on HPLC measures
The results suggest that DA values are unaffected by sonication in water or by NaF perfusions. However, DOPAC levels were raised by both treatments, and HVA levels were slightly raised by NaF perfusion. 5HT and 5HIAA remained unchanged, suggesting that the lack of effect is not specific to DA and that not all metabolites are raised. Our techniques would have to be validated for other transmitters, such as norepinephrine, and their metabolites. The metabolite changes might be explained by slower inactivation of enzymes such as monoamine oxidase and aldehyde dehydrogenase involved in the conversion of DA to DOPAC during water sonications relative to direct HClO4 sonication. Although perfusion of the rat before brain removal raised the post-mortem interval by 4 min and could also have allowed better access of degradative enzymes to DA, we found no correlation between DOPAC levels and postmortem interval (R2=0.08, n=10). The rise in metabolites did not lead to measurable reductions in DA, presumably because metabolites are so much lower in abundance. Other variables that differ between perfused and unperfused rats include less blood in the perfused brain, rapid chilling of the brain with ice-cold perfusate, and different traumas with the two approaches. Our intent was not to control for each difference, but to report how a few important markers are affected by the total sum of contrasts in real-life, practical situations. Investigators using other sources of water for sonication, for example, should first validate their techniques, as varying parameters such as pH and sonication temperature may affect degradation differently than reported here. We anticipate that if all tissues are treated in precisely the same fashion during water sonication or NaF perfusions, such effects would be uniform across experimental groups and allow for valid comparisons to the control group.
4.2. Effect of water sonication and NaF perfusions on protein levels
Total levels of the proteins examined by Westerns were unaffected by either approach. However, some phosphorylation sites as assessed with phospho-specific antibodies were affected. TH phosphorylation at Ser31 was unaffected by either water sonication or NaF perfusions. TH phosphorylation on the Ser19 site was unaffected by the sonication medium, but the level of TH phosphorylated at this site was raised by NaF. We also observed that water sonication reduced pERK1/2 and pAkt levels, with no net change in total levels. NaF perfusions raised pERK1/2 levels considerably. Lack of effect of NaF perfusion on phosphorylation levels of Akt may indicate that the relevant phosphatases were not effectively inhibited or that there was not much degradation of this particular molecule in the postmortem interval relative to phospho-ERK1/2. We see no effect of NaF perfusions on total protein levels, and no effect on either RNA concentration or quality as assessed by native agarose gels (Leak, unpublished, n=5 unperfused, n=6 NaF perfused).
Raising levels of phosphoproteins became a concern when we observed that postmortem interval of 30 minutes or more in primate studies has a detrimental impact. We were not able to raise phosphorylation levels in immunoblots by retroactively adding NaF to the blocking, washing, and antibody solutions, as reported previously (Sharma and Carew 2002); it was only perfusions with NaF that had an effect in our hands. Other researchers may consider adding sodium orthovanadate or other inhibitors to their perfusion solution if they are interested in inhibiting tyrosine phosphatases. Some have also effectively used focused microwave irradiation to deal with the concern of stabilizing phosphoproteins (O'Callaghan and Sriram 2004).
In summary, we describe a simple and inexpensive way to assess multiple compounds from the same original tissue sample despite the need to use different methods of sample preparation. Minimizing animal use in this manner is in accord with Russell and Burch's principles of “Replacement, Reduction, and Refinement” (Flecknell 2002). Water sonication becomes an even more efficient use of tissue when working with smaller-brained transgenic mice or with smaller regions such as the substantia nigra and accumbens. Taking adjacent samples from anatomically heterogenous regions such as the substantia nigra in both normal and disease states (Damier et al. 1999a; Damier et al. 1999b) may also result in greater variability than sonicating the whole nigra in water before splitting into concentrated stocks. Finally, we also examined how perfusing animals with a phosphatase inhibitor affects the phosphorylation state of some phosphoproteins. Our results show water sonication-induced or NaF perfusion-induced changes in some molecules, but also demonstrate that it is possible to measure several compounds from the same tissue sample even when the tissue must be dissolved in different solutions for the assay itself. In addition to significant cost- and time-saving, this will eliminate the variability that arises from assaying different biological samples.
Supplementary Material
Supplemental Figure 1: Levels of serotonin (5-hydroxytryptamine or 5-HT) and metabolite 5-hydroxyindoleacetic acid (5-HIAA), total ERK1/2, and total Akt with sonication in water (dark gray bars) prior to immersion in a concentrated stock of HClO4 acid (PCA) and lysis buffer, or direct sonication in PCA and lysis buffer (light gray bars). Levels of total Akt and ERKs with and without NaF perfusion are also shown to illustrate both the lack of effect as well as the degree of variability. All graphs depict means + SEM.
Acknowledgments
This work was supported by NIH grants P50 NS019608 and R01 TW008040 to MJZ at the University of Pittsburgh and a startup award to RKL at Duquesne University.
Footnotes
Publisher's Disclaimer: This is a PDF file of an unedited manuscript that has been accepted for publication. As a service to our customers we are providing this early version of the manuscript. The manuscript will undergo copyediting, typesetting, and review of the resulting proof before it is published in its final citable form. Please note that during the production process errors may be discovered which could affect the content, and all legal disclaimers that apply to the journal pertain.
References
- Anjum R, Blenis J. The RSK family of kinases: emerging roles in cellular signalling. Nat Rev Mol Cell Biol. 2008;9(10):747–758. doi: 10.1038/nrm2509. [DOI] [PubMed] [Google Scholar]
- Chabre M. Aluminofluoride and beryllofluoride complexes: a new phosphate analogs in enzymology. Trends Biochem Sci. 1990;15(1):6–10. doi: 10.1016/0968-0004(90)90117-t. [DOI] [PubMed] [Google Scholar]
- Cheng TJ, Chen TM, Chen CH, Lai YK. Induction of stress response and differential expression of 70 kDa stress proteins by sodium fluoride in HeLa and rat brain tumor 9L cells. J Cell Biochem. 1998;69(2):221–231. doi: 10.1002/(sici)1097-4644(19980501)69:2<221::aid-jcb12>3.0.co;2-h. [DOI] [PubMed] [Google Scholar]
- Damier P, Hirsch EC, Agid Y, Graybiel AM. The substantia nigra of the human brain. I. Nigrosomes and the nigral matrix, a compartmental organization based on calbindin D(28K) immunohistochemistry. Brain. 1999a;122(Pt 8):1421–1436. doi: 10.1093/brain/122.8.1421. [DOI] [PubMed] [Google Scholar]
- Damier P, Hirsch EC, Agid Y, Graybiel AM. The substantia nigra of the human brain. II. Patterns of loss of dopamine-containing neurons in Parkinson's disease. Brain. 1999b;122(Pt 8):1437–1448. doi: 10.1093/brain/122.8.1437. [DOI] [PubMed] [Google Scholar]
- Flecknell P. Replacement, reduction and refinement. Altex. 2002;19(2):73–78. [PubMed] [Google Scholar]
- Liu P, Cheng H, Roberts TM, Zhao JJ. Targeting the phosphoinositide 3-kinase pathway in cancer. Nat Rev Drug Discov. 2009;8(8):627–644. doi: 10.1038/nrd2926. [DOI] [PMC free article] [PubMed] [Google Scholar]
- O'Callaghan JP, Sriram K. Focused microwave irradiation of the brain preserves in vivo protein phosphorylation: comparison with other methods of sacrifice and analysis of multiple phosphoproteins. J Neurosci Methods. 2004;135(1-2):159–168. doi: 10.1016/j.jneumeth.2003.12.006. [DOI] [PubMed] [Google Scholar]
- Sharma SK, Carew TJ. Inclusion of phosphatase inhibitors during Western blotting enhances signal detection with phospho-specific antibodies. Analytical biochemistry. 2002;307(1):187–189. doi: 10.1016/s0003-2697(02)00008-8. [DOI] [PubMed] [Google Scholar]
- Smith AD, Amalric M, Koob GF, Zigmond MJ. Effect of bilateral 6-hydroxydopamine lesions of the medial forebrain bundle on reaction time. Neuropsychopharmacology. 2002;26(6):756–764. doi: 10.1016/S0893-133X(01)00420-1. [DOI] [PubMed] [Google Scholar]
Associated Data
This section collects any data citations, data availability statements, or supplementary materials included in this article.
Supplementary Materials
Supplemental Figure 1: Levels of serotonin (5-hydroxytryptamine or 5-HT) and metabolite 5-hydroxyindoleacetic acid (5-HIAA), total ERK1/2, and total Akt with sonication in water (dark gray bars) prior to immersion in a concentrated stock of HClO4 acid (PCA) and lysis buffer, or direct sonication in PCA and lysis buffer (light gray bars). Levels of total Akt and ERKs with and without NaF perfusion are also shown to illustrate both the lack of effect as well as the degree of variability. All graphs depict means + SEM.