Abstract
Purpose: Predicting complex patterns of respiration can benefit the management of the respiratory motion for radiation therapy of lung cancer. The purpose of the present work was to develop a patient-specific, physiologically relevant respiratory motion model which is capable of predicting lung tumor motion over a complete normal breathing cycle.
Methods: Currently employed techniques for generating the lung geometry from four-dimensional computed tomography data tend to lose details of mesh topology due to excessive surface smoothening. Some of the existing models apply displacement boundary conditions instead of the intrapleural pressure as the actual motive force for respiration, while others ignore the nonlinearity of lung tissues or the mechanics of pleural sliding. An intermediate nonuniform rational basis spline surface representation is used to avoid multiple geometric smoothing procedures used in the computational mesh preparation. Measured chest pressure-volume relationships are used to simulate pressure loading on the surface of the model for a given lung volume, as in actual breathing. A hyperelastic model, developed from experimental observations, has been used to model the lung tissue material. Pleural sliding on the inside of the ribcage has also been considered.
Results: The finite-element model has been validated using landmarks from four patient CT data sets over 34 breathing phases. The average differences of end-inspiration in position between the landmarks and those predicted by the model are observed to be 0.450±0.330 cm for Patient P1, 0.387±0.169 cm for Patient P2, 0.319±0.186 cm for Patient P3, and 0.204±0.102 cm for Patient P4 in the magnitude of error vector, respectively. The average errors of prediction at landmarks over multiple breathing phases in superior-inferior direction are less than 3 mm.
Conclusions: The prediction capability of pressure-volume curve driven nonlinear finite-element model is consistent over the entire breathing cycle. The biomechanical parameters in the model are physiologically measurable, so that the results can be extended to other patients and additional neighboring organs affected by respiratory motion.
Keywords: 4DCT, FEM, NURBS surface reconstruction, respiratory motion, lung model
INTRODUCTION
In external beam radiation treatment, the goal to deliver a lethal radiation dose through external beams conformed to the tumor while sparing adjacent healthy tissues may be compromised by organ motions.1, 2, 3, 4, 5, 6, 7, 8, 9, 10, 11, 12 The current radiation treatment paradigm, for the most part, is still based on an assumption that both the tumor location and shape are known and remain unchanged during the course of radiation delivery. This assumption fails in anatomical sites such as the thoracic cavity and the abdomen, owing predominantly to respiratory motions.2, 3, 4, 5, 6 In the lungs, for example, respiration related deformation13 can be as much as 4 cm. As a result, although higher radiation doses have shown better local tumor control, less aggressive treatment strategies with various degrees of dose margin have been adopted to accommodate for potential targeting errors.14, 15, 16, 17 Based on four-dimensional computed tomography (4DCT),18, 19, 20, 21, 22, 23 the motion margin can be estimated more accurately by overlapping information from all the phases. However, patient breathing pattern changes from time to time; the estimated margin from 4DCT may not represent the real margin for the delivery. Modeling of respiratory motion presents a unique multidisciplinary challenge. Although such research was reported as early as the 1940s,24 dynamic modeling was not considered owing to past limitations in computer and medical imaging technologies. The challenge is especially interesting in the context of biomechanical modeling because the lung motion has uniquely complex spatial and temporal patterns. In space, the different lung lobes have varying ranges of deformation.3, 6, 7 In time, the respiratory cycle can be unstable and patient dependent.25, 26 To predict the lung motion, one must take into account of nonlinear elasticity of lung tissue,27, 28 pleural sliding,29, 30 regional differences in lung response, and the motion of adjacent structures such as the heart.31, 32
Although deformable image registration models33 and nonmodel heuristic approaches25 incorporating surrogates have provided information on tumor displacement caused by respiration, advanced finite-element methods (FEMs) can address limitations associated with these methods, including prediction of localized deformation of tumor34 and interorgan interactions such as the pleural sliding.35 Finite-element lung models have also been used to evaluate the effect of gravity on respiratory physiology36 and to find surface matching of organs in two images in deformable image registration techniques.37, 38, 39, 40 Recently, finite-element lung models for tumor tracking at the end of inhalation incorporating contact conditions have been proposed.35, 34 In FEM, the effectiveness of the model and its accuracy in predicting tumor motion depend on several important issues including the quality of the patient geometric model and the regularity and accuracy of the finite-element mesh. In previous works by Brock et al.,38 Werner et al.,34 and Villard et al.,41 multistep procedures such as isosurface construction, multiple iterative mesh smoothing, relaxing, and decimation may result in undue simplification and artifacts in the modeling as pointed out in Sec. 3A of this paper. Additionally, the idea of using a projected displacement boundary condition by Brock et al.38 and Al-Mayah et al.35, 42 on the surface of the lungs may misrepresent the physiology and incorrectly represent contact conditions with adjacent tissues.
The biomechanical engineering community has been studying the deformation mechanics of the lungs for many years. The first continuum-based FE model of a dome shaped lung was proposed by West and Matthews43 in 1972. Linear and nonlinear elastic material models, obtained from experiments by Radford44 on strips of tissue excised from canine lungs, were used in the model. Zhang et al.37 proposed a lung model with pleural sliding which was driven by pressure forces applied on the surface of the lungs. This model was implicitly validated by overlaying the CT lung image at inhalation and a reconstructed image of the lung at exhalation without quantitative comparisons. Villard et al.40 described a 3D deformable continuum-based lung model with pleural sliding. They showed that the simulation of pleural sliding produce results which are in closer agreement with clinical data. In an extension of this work, Didier et al.39 used the same FEM model and investigated the kinematic effects of the ribs on the motion during a breathing cycle by using a finite helical axis (FHA) method. Extending the work of Zhang et al.,37 Werner et al.34, 45 recently proposed a respiratory lung motion model incorporating contact mechanics. Instead of using contact elements, an augmented Lagrangian algorithm was used for the contact formulation in the FEM software COMSOL MULTIPHYSICS (COMSOL AB, Sweden). Brock et al.38 developed a FE model driven by displacement fields obtained from CT images. This approach is capable of handling multiple organs. The initial and final states of the lungs and the other organs are obtained from the CT scans from the end of expiration (EE) and end of inspiration (EI), respectively. None of these FEM models discussed above considered the nonlinear elastic property associated with lung motion. Recently, Al-Mayah et al.35, 42 has improved the FEM-based 3D lung model in Brock et al.38 by including contact conditions and nonlinear material properties. Prescribed displacement boundary conditions, similar to that in Brock et al.,38 have been applied and the interaction between the walls of the lungs and the chest has been modeled using frictionless surface-based elements. However, the lung motion in their study was simulated using displacement boundary conditions which are not physiologically relevant.36
Although the previous studies offer insights into continuum-based lung modeling, none has presented results of tumor tracking over the entire breathing cycle as these studies lack one or more of the following three key features: Physiologically correct boundary conditions, physically realistic contact-friction modeling of pleural sliding, and empirically derived nonlinear mechanical properties of lung tissue. The necessity of including all three features is dictated by the mechanics of lung motion and the biomechanics of the lung tissue as explained in Sec. 2B.
In this paper, we present a physics-based modeling method of respiratory motion that was based on 4DCT data of four patients. An intermediate nonunifrom rational B-spline (NURBS) surface representation was used to avoid multiple geometric smoothing procedures employed in previous work.34, 38, 46 A nonlinear hyperelastic material model is used together with physiologically relevant boundary conditions based on pressure-volume (P-V) curves and pleural sliding. The FE model has been validated using 48 landmarks from the CT data. No tuning of FE modeling parameters including material properties,34 contact stiffness,37 or friction coefficients42 was employed. In II, we present our modeling methodology, followed by a discussion of results in Sec. 3 and conclusions in Sec. 4.
METHODS AND MATERIALS
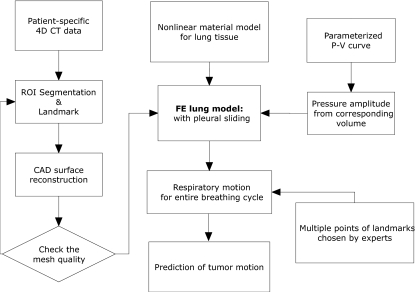
A flow diagram of our modeling scheme is presented in Fig. 1 which shows the procedure for creating the geometric model from patient-specific 4DCT data (Sec. 2A) and our technique of physiologically based lung motion modeling (Sec. 2B)
Figure 1.
A flow diagram of the modeling scheme showing the steps to convert 4DCT images to FE models with boundary conditions.
Patient specified geometric modeling
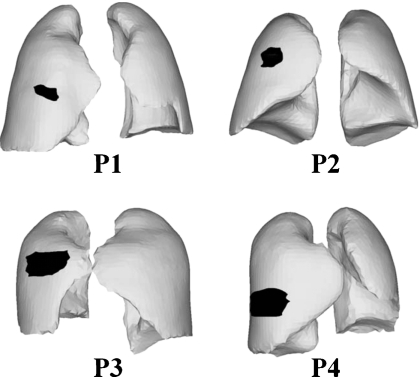
The first step in respiratory motion modeling is to develop FE models of the lungs and associated structures from 4DCT data. As shown in Fig. 2, four patient 4DCT data set were used; one was publicly available 4D respiratory-gated CT image data set, a point-validated pixel-based breathing thorax model,47 and the other three were acquired at the center of collaborator. Each image slice has a resolution of 0.98×0.98 mm2 with a slice thickness of 2 mm, resulting in a 512×512×141 voxel matrix. For each patient data set, ten breathing phases in the 4DCT DICOM data were segmented48 into different regions of interest (ROIs) using the Pinnacle system (Version 8.0 m, Medical systems, Milpitas, CA).
Figure 2.
Geometry and tumor location of all four patients (P1–P4).
According to the computed lung volume of each phase, the EE state, the EI state, and states in between were selected for modeling. The ROIs at the EE from this procedure are used as lung geometry (inner pleural surface) and the ROIs at the EI are used as ribcage (outer pleural surface). Though image data set were captured along breathing signal, real-time position management system (Varian Medical System, Palo Alto, CA), the volume of corresponding phases were used to sort the actual order of breathing phases. The volume change over time is monotonic function during either inhalation or exhalation; this means that the volume of lungs only increases during inhalation and decrease during exhalation. For example, Patient P1 has originally ten 4DCT phases per each patient data set. But two inconsistent breathing phases which have increasing volume exist during exhalation. So these two inconsistent breathing phases are excluded in the modeling. The finally chosen breathing phase of each patient are presented in Sec. 3D.
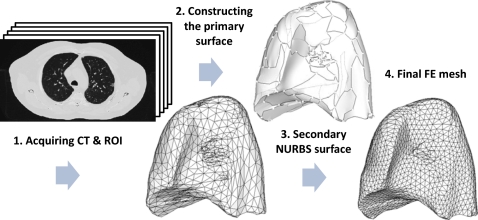
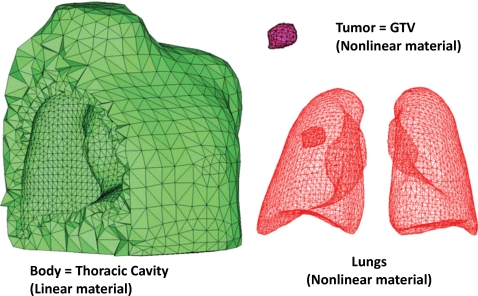
For accurate simulations, a uniform “good quality” mesh with elements that have small aspect ratios and include angles must be used.49 However, mesh models generated from patient-specific CT images tend to have a dense arrangement of elements with highly irregular geometries, which cannot be directly used for FE analysis. In previous studies,34, 38, 41 multiple iterations38 of mesh decimation and Laplacian smoothing were used to reduce the number of elements and generate a more uniform mesh acceptable in FE simulations. The problem of this procedure is that the detail of the mesh topology may be lost since Laplacian smoothing focuses on moving point locations to improve triangulation while neglecting the preservation of the original geometric features. Also, the procedure is not interactive as multiple steps are involved. In this study, we have used a NURBS surface reconstruction approach to convert the ROIs into FE meshes as shown in Fig. 3. Primary surfaces are generated from ROI contour lines in Rhinoceros 3D (Robert McNeel & Associates, Seattle, WA). NURBS surfaces were then reconstructed and converted into suitable FE meshes using HYPERMESH (Altair Engineering, Troy, MI). This approach greatly simplified the procedure of FE mesh generation from CT scanned image data without losing the geometric details. In Sec. 3, we will compare the NURBS surface reconstruction technique with Laplacian smoothing. The each FE model is composed of the thoracic cavity and the lungs with an embedded tumor in the right lung as seen in Fig. 4.
Figure 3.
Sequence of steps in converting 4DCT image data into a FE mesh through an intermediate NURBS representation in P2.
Figure 4.
FE models including a thoracic cavity, a tumor (gross target volume for radiation treatment purposes), and lungs for P2.
Physiological respiratory motion modeling
In this work we have developed a physics-based lung model using FEM, which takes into account the physiology of respiratory motion, the biomechanics of the lung tissue, and the sliding of the lungs on the inside of the ribcage. Since the lung itself is a passive organ, its deformation is driven primarily by the intrapleural pressure changes caused by relative motion of other anatomical structures such as the ribcage and the diaphragm.36 So-called “P-V” curves50, 51 are plotted to represent the relationship between the lung volume (V) and transmural pressure (P) changes. We have used the P-V data to apply pressure boundary conditions to the surface of the lung model based on its instantaneous volume so that the relationship between lung volume and pressure is maintained. We believe that this is an advantage of our modeling approach compared to models that apply displacement boundary conditions35, 38 to drive lung motion.
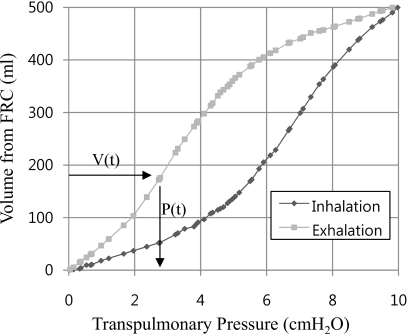
The features of our FE model are summarized in Table 1. A distributed time-varying pressure load was applied to the surface of the FE lung model. Pressure amplitudes at each breathing phase were evaluated from the parametrized P-V curve52 and the mean P-V curve53 shown in Fig. 5. The in situ lung volumes over multiple breathing phases were computed from the segmented 4DCT data between the EE and the EI and the volume difference at corresponding breathing phases lead the corresponding pressure, which was read off from the P-V curve. Though in Fig. 5, the value of volume of tidal volume (TV) and pressure was used as 500 ml and 10 cm H2O for illustration, the pressures at EI are evaluated by the mean P-V curve53 and the change of scaled pressure over volume are fitted by the parameterized P-V curve.52
Table 1.
| Features | |
|---|---|
| Geometric model | ROIs of multiple consistent breathing phase of 4 patients |
| FE mesh | Four-noded linear tetrahedral elements (C3D4) in ABAQUS∕Standarda |
| Material properties | Lung tissue:b Homogeneous isotropic, hyperelastic model with strain energy per unit volume (ρ0W), , where c=11.8 g∕cm, a1=0.43, a2=0.56, a4=0.32, and Exx, Exy etc., are the components of the Green strain |
| Ribcage:c Homogeneous isotropic, elastic model | |
| Young’s modulus (E)=6.0 kPa, Poisson’s ratio (ν)=0.4 | |
| Contact model | Augmented Lagrange multiplier with artificial damping for stabilization |
| Surface based master-slave frictionless contact condition:d e, e Visceral pleural surface (lung side) as slave and parietal pleural surface (ribcage side) as master surface | |
| Load and boundary conditions | Uniform intrapleural pressure assumptione f, f over the lung surface: Pressure amplitude history from computed volumes of 4DCT at multiple breathing phases and parameterized P-V curve data.g Fixed displacement boundary condition at root of lunge (trachea-lung junction chosen from CT) |
Figure 5.
Pressure-volume relationship from the parameterized P-V curve (Ref. 52) (TV=500 ml and transpulmonary pressure=10 cm H2O).
A tumor-bearing lung is modeled as an elastic medium Ω consisting of N homogeneous isotropic subdomains in the finite-element model of ABAQUS. The external surface of lung ∂Ω is decomposed in ∂Ωd, where the displacements are prescribed by the anatomical facts (root of lung), and ∂Ωt where distributed surface traction are applied. The locally uniform elastic regions ΩI(I=1,…,N) are implanted into the lung Ω. The boundary of local region ΩI is called an internal boundary ∂ΩI. The elastic properties in a region ΩI are assumed to be isotropic hyperelastic modulus in term of strain energy potential WI. In the medium, the deformation gradient F=I+∂u∕∂X is described from the displacement u(X) in Lagrangian coordinate system and the Green strain is E=(FTF−I)∕2. The strain energy WI of local region ΩI introduces the second Piola–Kirchoff stress S=∂WI∕∂E, which is energy conjugate to the Green strain. The governing equation and boundary conditions for finding u(X) are defined as
| (1) |
where b is body force and n is normal on ∂Ωt. For each breathing phase, corresponding intrapleural pressure change determines distributed surface traction in quasistatic problem49 of Eq. 1 and resultant algebraic equations of each loading step were solved by Newton iterative algorithm in ABAQUS.
It is essential to use empirically derived stress-strain constitutive relationships. Such constitutive equations of human lung tissue have been rarely reported.55, 56 Some existing models represent lung tissue as a linear elastic material.34, 37, 38 However, nonlinear hyperelastic constitutive models have been presented by Zeng et al.55 based on excised cadaver lung parenchyma, which is used in this study. The parameters of this model are presented in Table 1.
Another important feature of physics-based lung modeling is that the motion of the lungs is asymmetric due, in part, to the sliding of the pleural membrane on the inside of the chest wall. The surface area of the pleura that comes in contact with the chest wall is a function of deformation and cannot be determined a priori.36 This introduces nonlinearities known as “contact nonlinearities.”44 Hence, we have included pleural sliding in our model. The pleural membrane can slide against the chest wall at velocities up to 20 cm∕s during vigorous respiration. Lubrication is provided by a thin layer of fluid, typically 20 μm thick in the pleural space.50 Experimental friction data between the pleura and the inner chest wall do not exist. Hence, in this paper, we have assumed frictionless contact conditions.
RESULTS AND DISCUSSION
Comparison of Laplacian smoothing vs NURBS surface reconstruction
To evaluate the NURBS surface reconstruction procedure tested against conventional mesh preparation using multiple Laplacian smoothing and decimating,38, 46 we compared the geometric quality of the elements. Four mesh quality indices, commonly used in computer sided engineering49 are considered in this study.
-
(a)
Aspect ratio: This is the ratio of the longest edge of an element to its shortest edge.
-
(b)
Maximum and minimum interior angles: These maximum and minimum values are evaluated independently for triangle facet.
-
(c)
Jacobian: The determinant of the Jacobian matrix measures the deviation of an element from its ideal or “perfect” shape, such as a triangle’s deviation from equilateral. In HYPERMESH, a ratio of the maximum to the minimum value of this determinant at all the Gauss points is available for each element. A value of this ratio closer to 1.0 indicates less distortion, whereas a value closer to 0.0 signifies a highly distorted element.
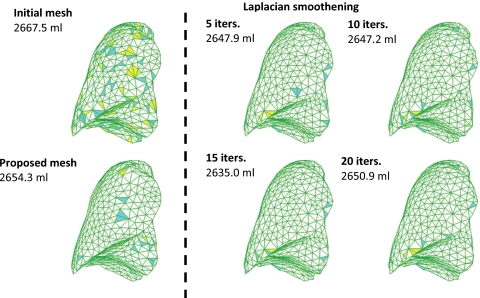
In Fig. 6, elements which violate the mesh quality indices for each approach are color-coded. The results show that the threshold for violation is 0.9 for the Jacobian, 2.0 for the aspect ratio, and 80° and 50° for the maximum and minimum interior angle, respectively. The volume change indicates loss of geometric features. It is clear that the proposed geometric modeling procedure preserves initial geometry of the CT scan data. Laplacian smoothing is an algorithm to smooth a polygonal mesh. For each vertex in the mesh, a new position is chosen based on local information (such as the position of neighbors) and then the vertex is moved. Laplacian smoothing focuses on moving point locations to improve triangulation without any guarantees on the preservation of the original geometric features.
Figure 6.
Comparison of relaxing (Laplacian smoothing) vs proposed NURBS surface reconstruction procedure in P2 showing changes in mesh volume and elements that are close to or violating the quality indices.
In studies reported by Refs. 38, 41, 10, iterations of Laplacian smoothing and additional ten smoothing iterations with decimation were used to prepare the computational mesh. Table 2 shows that ten cycles of smoothing iterations can reduce the original volume by 20.3 ml and the relaxing operations failed to enhance the mesh quality indices, while our proposed approach achieved higher quality meshes with 13.2 ml of volume loss.
Table 2.
Comparison of mesh quality indices in the percentage of elements violating threshold criteria.
| Mesh | Jacobian (<0.9) | Aspect ratio (>2.0) | Maximum angle (>80°) | Minimum angle (<50°) |
|---|---|---|---|---|
| Initial | 21.1% | 0.2% | 49.9% | 83.7% |
| Laplacian smoothing | ||||
| Five iterations | 4.2% | 0.2% | 28.3% | 66.9% |
| Ten iterations | 4.1% | 0.2% | 27.7% | 66.0% |
| 15 iterations | 3.4% | 0.2% | 24.7% | 63.7% |
| 20 iterations | 3.9% | 0.2% | 27.6% | 66.2% |
| Proposed model | 3.0% | 0.0% | 21.3% | 59.3% |
Evaluating modeling accuracy based on landmarks for multiple patients
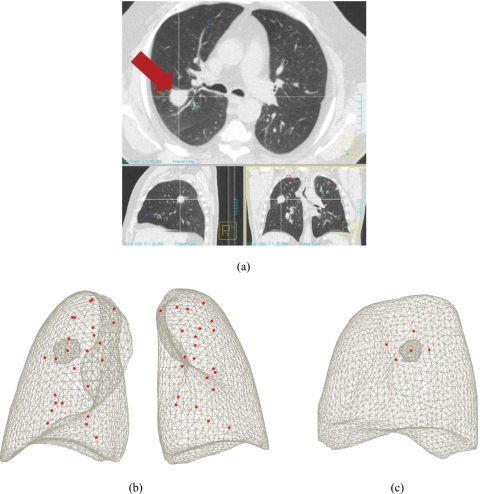
The procedure in this study to evaluate the modeling accuracy was based on the patient-specific models and 4DCT image data. As shown in Fig. 7, anatomical points that represent the bifurcation of vessels and airways were chosen on the exhale and inhale images. For each patient data set, 39–48 such landmarks were chosen from the 4DCT images over multiple breathing phases. For obtaining the landmarks, we followed the procedure described by Sarrut et al.57 The motion patterns of these points in the 4DCT images were compared to the motion of the corresponding points in the FE model to evaluate the modeling accuracy.
Figure 7.
Landmark positions of P2; bifurcation of vessels and airway were determined by radiologists (a) locating landmarks at anatomical points of bifurcations and at the center of the tumor (tumor, arrow; LR-AP, sectional view on top; AP-SI, sectional view on bottom left; LR-SI, sectional view on bottom right); (b) 48 points of landmarks; and (c) five points of landmarks close to the tumor.
Table 3 summarizes the details of each patient FE model. The commercial FE software package ABAQUS (Dassault Systèmes, Providence, RI) was used to simulate the model on an Intel Core2 Quadcore 2.83 GHz CPU machine with 8 GB RAM. Each computation runs till each finite-element model is subjected to the pressure loading history according to the volume change in Table 4. Due to its nonlinearity from lung tissue property and contact procedure, the computation time of each model is independent from its number of unknowns.
Table 3.
Characteristics of the finite-element model of each patient.
| Name | Number of phases | Total landmarks | Avg. volume of tetrahedral (ml) | Node∕elements | Computation time |
|---|---|---|---|---|---|
| P 1 | 8 | 48 | 0.111 | 7274∕30 320 | 1 hr 30 min |
| P 2 | 8 | 48 | 0.165 | 6184∕25 212 | 2 hr |
| P 3 | 10 | 46 | 0.081 | 5797∕24 938 | 2 hr 45 min |
| P 4 | 8 | 39 | 0.101 | 7748∕35 830 | 2 hr 20 min |
Table 4.
The different breathing phases are distinguished by volume change from EE (ml) and provided unique identifiers.
| Breathing phase identifier | Volume change (V−VEE) (ml) | |||
|---|---|---|---|---|
| P1 | P2 | P3 | P4 | |
| EE | 0 | 0 | 0 | 0 |
| IN-1 | 43.47 | 189.16 | 5.59 | 68.6 |
| IN-2 | 51.15 | 252.03 | 70.21 | 175.98 |
| IN-3 | ⋯ | 412.67 | 273.13 | ⋯ |
| IN-4 | ⋯ | 443.62 | 354.26 | ⋯ |
| IN-5 | ⋯ | ⋯ | 403.51 | ⋯ |
| EI | 244.5 | 453.97 | 404.86 | 354.92 |
| EX-1 | 243.58 | 303.41 | 301.52 | 354.02 |
| EX-2 | 130.76 | 237.82 | 170.54 | 342.35 |
| EX-3 | 60.47 | ⋯ | 55.2 | 69.6 |
| EX-4 | 57.72 | ⋯ | ⋯ | 16.15 |
The model developed in this study can predict motion at multiple respiratory phases; each breathing phase is distinguished by its volume change of the segmented 4DCT data from EE (breathing phase with minimum volume) and is provided a unique identifier in Table 4.
Prediction of lung motion between EE and EI
The average of the position error and standard deviation in each direction are used as metrics of comparison in this study. If x4DCT is the position of landmark in 4DCT and xFEM is the position of landmark in the corresponding FEM model, then we define the prediction error as in Al-Mayah et al.35
| (2) |
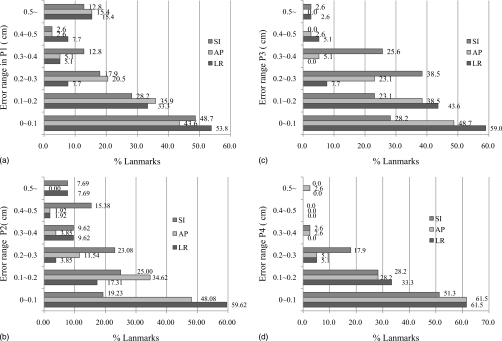
Figure 8 plots a histogram of the absolute values of the prediction error between EE and EI. The average difference of end-inspiration in position between the landmarks and those predicted by the model, are observed to be 0.450±0.330 cm (average±standard deviation) for Patient P1, 0.387±0.169 cm for Patient P2, 0.319±0.186 cm for Patient P3, and 0.204±0.102 cm for Patient P4 in the magnitude of error vector, respectively. In the lungs, the superior-inferior (SI) direction is the predominant motion direction compared to the anterior-posterior (AP) or left-right (LR). For the majority of the landmarks, the displacement errors are less than 3 mm. It should be noted that the landmarks are located at the bifurcations of vessel or airway where effects of heterogeneity of the lung tissue are significant. Also, note that all 3D CT images have slice spacing of 2 mm and that, consequently, landmark identification can induce an error of up to 2 mm in superior-inferior direction. A model predicative of 2 mm error may be used to reduce margin of the planning target volume. Although Patient P1 model had the smallest volume change in this study, complex geometric feature around the hilum prevented the pleural sliding along the AP and LR direction and brought more erroneous result at the lower right part of the lung.
Figure 8.
Prediction errors at landmarks between EE and EI for each patient: (a) P1, (b) P2, (c) P3, and (d) P4.
Table 5 summarizes the prediction errors in four regions of the lungs. The lower and upper part of lung are divided at the midpoint of each lung in SI direction. It is interesting to note that there are significant regional differences in prediction error. In this table, the predictions for the lower-right regions of the lung are more accurate than the upper-right regions. These discrepancies may be caused by the assumptions in the proposed modeling method. First, the intrapleural pressure may have spatial variations on the surface of the lungs. This may be due to uneven compliance, uneven airway resistance, or the lungs sagging due to their weight. None of these effects have been considered in this model. Second, it has been reported that tumor-bearing regions have a considerably lower mobility than the corresponding tumor-free regions13 (4.1±2 vs 6.2±2.5 cm). For Patient P2, we chose five landmarks around tumor as shown as Fig. 7 and the mean deviation of this tumor region is 0.041±0.212 cm in LR, 0.061±0.152 cm in AP, 0.515±0.113 cm in SI, and 0.571±0.109 cm in magnitude. This may explain the differences in left vs right and tumor-bearing vs healthy tissue in Table 5. Additionally, geometric misalignment between ROIs and landmarks or the surface of EE and EI may exist during geometric modeling.
Table 5.
Mean deviation of FE model prediction from 4DCT data at four different lung regions: P1–P4 (the numbers of landmarks in each region are within parentheses).
| Region (number of landmark) | Mean deviation of FEM prediction at bifurcation points at EI (cm) | |||
|---|---|---|---|---|
| LR | AP | SI | Magnitude | |
| (a) Patient P1 | ||||
| Whole model (48) | −0.003±0.346 | 0.130±0.271 | 0.013±0.272 | 0.450±0.330 |
| Upper left(7) | −0.043±0.112 | 0.013±0.074 | −0.027±0.046 | 0.131±0.058 |
| Upper right(5) | 0.134±0.097 | 0.083±0.066 | −0.163±0.114 | 0.242±0.135 |
| Lower left(16) | 0.173±0.352 | 0.172±0.289 | 0.065±0.320 | 0.490±0.350 |
| Lower right (20) | −0.165±0.580 | 0.149±0.326 | 0.030±0.296 | 0.585±0.472 |
| (b) Patient P2 | ||||
| Whole model (48) | 0.073±0.221 | 0.066±0.146 | 0.245±0.200 | 0.387±0.169 |
| Upper left (15) | −0.049±0.077 | 0.085±0.119 | 0.257±0.099 | 0.307±0.098 |
| Upper right (16) | 0.289±0.247 | 0.123±0.118 | 0.347±0.193 | 0.560±0.11 |
| Lower left (8) | −0.027±0.097 | −0.06±0.110 | 0.109±0.163 | 0.224±0.098 |
| Lower right (9) | −0.013±0.116 | 0.044±0.201 | 0.168±0.278 | 0.360±0.141 |
| (c) Patient P3 | ||||
| Whole model (46) | 0.024±0.225 | −0.093±0.148 | −0.190±0.142 | 0.319±0.186 |
| Upper left (10) | −0.023±0.171 | −0.099±0.070 | −0.131±0.102 | 0.238±0.110 |
| Upper right (15) | −0.052±0.117 | −0.084±0.152 | −0.107±0.143 | 0.237±0.141 |
| Lower left (16) | 0.164±0.295 | −0.103±0.130 | −0.276±0.112 | 0.417±0.228 |
| Lower right (5) | −0.105±0.057 | −0.074±0.298 | −0.281±0.096 | 0.413±0.089 |
| (d) Patient P4 | ||||
| Whole model (39) | −0.038±0.103 | 0.036±0.136 | −0.038±0.141 | 0.204±0.102 |
| Upper left (9) | −0.014±0.064 | 0.032±0.098 | −0.020±0.142 | 0.161±0.082 |
| Upper right (15) | −0.060±0.134 | 0.091±0.066 | −0.104±0.076 | 0.216±0.050 |
| Lower left (8) | 0.014±0.073 | 0.062±0.077 | 0.044±0.154 | 0.177±0.076 |
| Lower right (7) | −0.079±0.078 | −0.108±0.233 | −0.014±0.192 | 0.266±0.190 |
Table 6 lists the prediction error of the previous physically based respiratory models found in the literature. As reported, parametric studies involving linear elastic parameters (Young’s modulus and Poisson’s ratio) have been conducted by Werner et al.34 Villard et al.,40 whereas a parametric study of friction coefficients has been performed in Al-Mayah et al.42 However, it is noted that these parameters should have been empirically obtained in the context of biomechanics. In comparison, our model involved no tuning of FE modeling parameters including material properties,34 contact stiffness,37 or friction coefficients,42 and contains the respiratory motion corresponding to the complete breathing cycle with positional accuracy better than 3 mm, on average.
Table 6.
EE-EI prediction errors between for models in the literature.
| Author | Model accuracy |
|---|---|
| Didier et al. (2007)a | Average displacement error measured by landmarks is between 2.14 and 5.16 mm for different subjects |
| Brock et al. (2005)b | Average displacement error measured by landmarks is 4.4 mm in vector magnitude, 1.9 mm in LR, 2.8 mm in AP, and 1.7 mm in SI direction |
| Al-Mayah et al. (2008)c | Average displacement errors measured by landmarks |
| Linear elastic model: −2.0 mm in LR, −1.0 mm in AP, and 7.1 mm in SI | |
| Hyperelastic model: −1.2 mm in LR, 0.0 mm in AP, and −0.3 mm in SI | |
| Hyperelastic∕contact model: 1.4 mm in LR, 0.6 mm in AP, and 0.8 mm in SI | |
| Al-Mayah et al. (2008)d | Average absolute error in the SI direction of hyperelastic∕frictionless contact model: 2.1 mm (Poisson’s ratio=0.35 and 0.4) |
| Werner et al.(2008)e | Displacement errors measured by landmarks at trachea bifurcation are between 2 and 7 mm |
Prediction of lung motion at multiple breathing phases
The mean errors, i.e., deviations of our model predictions from the landmark data at multiple breathing phases are presented in Table 7. It is noteworthy that the average error in the superior-inferior direction is less than 3 mm, which suggests that our modeling approach is consistent in accuracy over the entire breathing cycle. Contrary to previously reported studies,58 which indicate that greater lung expansion is associated with greater prediction error, the result shows that the prediction error in the superior-inferior direction is not the greatest at EI. What may be observed from Table 7 is that the prediction error does, in most cases, exhibit a cyclical behavior with the location of the peak error being determined by factors including location of the tumor and interactions of the lungs with the ribcage through pleural sliding. Deviation from this behavior may be observed in Patient P4, and the error is not cyclic possibly because the tumor of P4 is located on the pleural surface which alters its sliding response compared to other patients.
Table 7.
Mean errors of the FE model prediction from the 4DCT data at different breathing phases for (a) P1, (b) P2, (c) P3 and (d) P4.
| Breathing phase | Mean error of FE prediction at landmark points (cm) | |||
|---|---|---|---|---|
| LR | AP | SI | Magnitude | |
| (a) Patient P1 | ||||
| IN-1 | −0.018±0.257 | 0.007±0.200 | −0.012±0.198 | 0.235±0.252 |
| IN-2 | 0.045±0.347 | 0.082±0.288 | −0.048±0.260 | 0.375±0.320 |
| EI | −0.003±0.346 | 0.130±0.271 | 0.013±0.272 | 0.450±0.330 |
| EX-1 | 0.037±0.435 | 0.270±0.268 | −0.111±0.319 | 0.554±0.319 |
| EX-2 | 0.043±0.421 | 0.260±0.252 | −0.165±0.350 | 0.599±0.268 |
| EX-3 | −0.006±0.431 | 0.297±0.246 | −0.173±0.313 | 0.613±0.282 |
| EX-4 | −0.033±0.372 | 0.215±0.263 | −0.142±0.295 | 0.531±0.285 |
| (b) Patient P2 | ||||
| IN-1 | −0.003±0.187 | 0.115±0.163 | 0.004±0.239 | 0.333±0.145 |
| IN-2 | 0.028±0.259 | 0.213±0.209 | 0.036±0.283 | 0.442±0.201 |
| IN-3 | 0.054±0.246 | 0.114±0.137 | 0.259±0.198 | 0.415±0.167 |
| IN-4 | 0.064±0.235 | 0.100±0.130 | 0.260±0.194 | 0.405±0.161 |
| EI | 0.073±0.221 | 0.066±0.146 | 0.245±0.200 | 0.387±0.169 |
| EX-1 | −0.008±0.123 | 0.001±0.126 | 0.003±0.230 | 0.230±0.108 |
| EX-2 | −0.014±0.102 | −0.001±0.123 | 0.007±0.235 | 0.191±0.085 |
| (c) Patient P3 | ||||
| IN-1 | −0.006±0.127 | 0.054±0.140 | 0.034±0.104 | 0.199±0.101 |
| IN-2 | −0.010±0.157 | 0.112±0.174 | 0.000±0.143 | 0.274±0.108 |
| IN-3 | 0.001±0.247 | 0.057±0.195 | −0.098±0.185 | 0.318±0.207 |
| IN-4 | 0.016±0.231 | −0.018±0.131 | −0.188±0.160 | 0.310±0.187 |
| IN-5 | 0.050±0.232 | −0.094±0.134 | −0.197±0.144 | 0.320±0.197 |
| EI | 0.024±0.225 | −0.093±0.148 | −0.190±0.142 | 0.319±0.186 |
| EX-1 | 0.025±0.234 | −0.070±0.139 | −0.116±0.144 | 0.283±0.180 |
| EX-2 | 0.019±0.159 | −0.102±0.125 | −0.131±0.132 | 0.265±0.122 |
| EX-3 | 0.152±−0.014 | −0.133±−0.062 | −0.032±−0.038 | 0.205±0.165 |
| (d) Patient P4 | ||||
| IN-1 | −0.034±0.128 | 0.018±0.107 | −0.050±0.107 | 0.179±0.103 |
| IN-2 | −0.008±0.117 | 0.041±0.124 | −0.065±0.127 | 0.198±0.106 |
| EI | −0.038±0.103 | 0.036±0.136 | −0.038±0.141 | 0.204±0.102 |
| EX-1 | −0.029±0.110 | 0.018±0.112 | −0.075±0.123 | 0.187±0.105 |
| EX-2 | 0.021±0.171 | 0.002±0.142 | −0.035±0.129 | 0.225±0.126 |
| EX-3 | 0.008±0.154 | −0.018±0.130 | 0.021±0.146 | 0.208±0.134 |
| EX-4 | 0.036±0.137 | −0.004±0.150 | 0.064±0.145 | 0.202±0.161 |
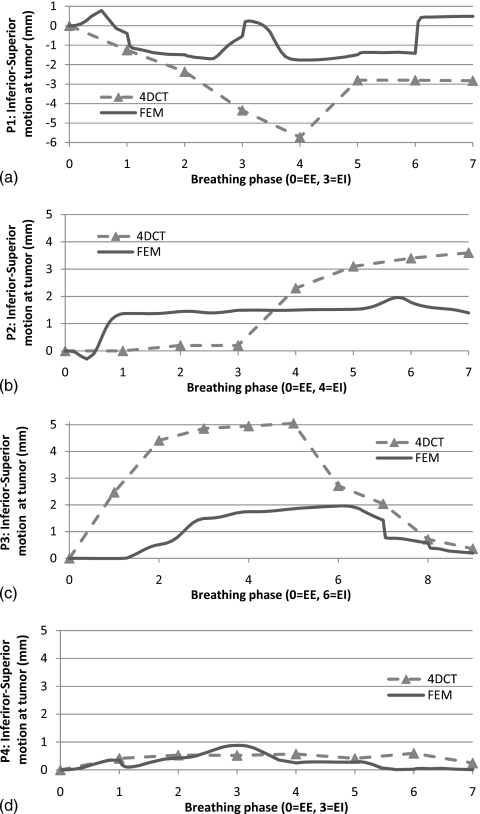
To check the temporal prediction capability of proposed mode, Fig. 9 shows that the inferior-superior motion of the landmark at tumor centroid (positive is the downward direction in figure). As shown in Sec. 3C, Patient P1 has more error in the other breathing phases as in EI. In this study, we used same biomechanical properties and pressure loading history for all four patients. This may show a temporal physiological modeling factor which can address the each patient’s pathological conditions such as breathing patterns and elastic property of the lesion and healthy tissue. It is noteworthy that smaller tumor motion in 4DCT gives the smaller discrepancy in the proposed FEM model in P4. Some of the major simplifying assumptions in our model include neglecting the complex alveolar structure of the lungs and modeling them as homogeneous structures, using a parameterized P-V curve52 and assuming the tumor tissue to have the same mechanical properties as the healthy lung tissue. We show that in spite of these simplifications, the model is predictive and reasonably accurate. Prediction of tumor motion may be improved by assuming a different material model for the tumor. However, biomechanical characterization of the tumor must be performed prior to such modeling.
Figure 9.
Inferior-superior motion of landmark at tumor centroid for proposed model and 4DCT over multiple breathing phases: (a) P1, (b) P2, (c) P3, and (d) P4.
Most of the existing FE models report prediction of one breathing phase at EI from EE34, 35, 37, 39 and a linear interpolation between EE-EI is used to predict the breathing motion in the middle of EE-EI.45 For comparison, we also perform the linear prediction45 through interpolation between EE and EI of Patient P2 and compare the mean errors as a result of linear prediction in Table 8 at midinspiration (IN1) and midexpiration (EX2). The magnitudes of mean error of the proposed nonlinear FEM are 0.333 and 0.191 cm at IN1 and EX2, respectively, compared to 0.405 (IN1) and 0.491 cm (EX2) for the linear model predictions, indicating better accuracy.
Table 8.
Mean error of linear prediction (Ref. 45) at IN-1 and EX-2 in Patient P2.
| Breathing phase | Patient P2: Mean error of linear prediction from EE-EI at landmark points (cm) | |||
|---|---|---|---|---|
| LR | AP | SI | Magnitude | |
| IN-1 | 0.030±0.147 | 0.123±0.132 | 0.111±0.210 | 0.405±0.130 |
| EX-2 | 0.055±0.233 | 0.220±0.199 | 0.090±0.218 | 0.491±0.215 |
CONCLUSIONS
The primary goal of this study was to develop a method of FE modeling of the lung motion for the purposes of radiation treatment planning and dosimetry evaluation. Special attention was paid to the adoption of anatomically realistic geometry, physiologically relevant boundary conditions, pleural sliding, and nonlinear constitutive model. For geometric modeling of the lungs and ribcage, an intermediate NURBS surface between 4DCT images and meshes has been constructed for FE computation. The results show that this approach avoids multiple geometric smoothing procedures used by many researchers and is more efficient while preserving geometric features of the CT data. A P-V relationship was used to provide physiologically relevant boundary conditions to the FE model over the entire breathing cycle. Expert-based validation using landmarks from 4DCT image of four patients and FE model shows that the mean position errors between our FE model and 4DCT data are within 3 mm in SI direction over the complete respiratory cycle. Furthermore, the nonlinear FE predictions show more accurate results over full breathing cycle than linear interpolation between EE and EI.
Some of the limitations of this study include the treating the complex hierarchical alveolar structure of the lungs as homogeneous structures, using a generic P-V curve, and assuming same mechanical properties of the tumor as the healthy lung tissue. In spite of these simplifications, the study demonstrated that the FE model is predictive over the entire breathing cycle with clinically acceptable accuracy. Prediction of tumor motion may be further improved when biomechanical characterization of the tumor becomes available in the future.
Unlike previous models, the parameters of the model reported here are physiologically identifiable and measurable, so that the results can be refined by patient-specific measurement of modeling parameters and extended to other patients and additional neighboring organs affected by respiratory motion. Future studies will consider multiple organs such as the diaphragm in the simulation scenario in order to gain insight into the effects of their interactions. A nonlinear viscoeleastic model of lung tissue will need to be developed in the future to more accurately represent the energy dissipation mechanisms using new data from experimental characterization of lung tissue. Finally, the model developed here is for normal breathing. For active breathing, modifications to this model would be necessary including ribcage rotation and intercostals muscle contraction and relaxation.
ACKNOWLEDGMENTS
The authors would like to gratefully acknowledge the funding support from NIH∕NLM Grant No. R01LM009362.
References
- ICRU, “Prescribing, recording and reporting photon beam therapy (supplement to ICRU Report 50),” ICRU Report No. 62 (International Commission on Radiation Units and Measurements, Bethesda, MD, 1999).
- Keall P., Mageras G., Balter J., Emery R., Forster K., Jiang S., Kapatoes J., Low D., Murphy M., and Murray B., “The management of respiratory motion in radiation oncology report of AAPM Task Group 76,” Med. Phys. 33, 3874–3900 (2006). 10.1118/1.2349696 [DOI] [PubMed] [Google Scholar]
- Korreman S., Juhler-Nottrup T., Fredberg Persson G., Navrsted Pedersen A., Enmark M., Nystrom H., and Specht L., “The role of image guidance in respiratory gated radiotherapy,” Acta Oncol. (Madr) 47, 1390–1396 (2008). 10.1080/02841860802282786 [DOI] [PubMed] [Google Scholar]
- Li G., Citrin D., Camphausen K., Mueller B., Burman C., Mychalczak B., Miller R., and Song Y., “Advances in 4D medical imaging and 4D radiation therapy,” Technol. Cancer Res. Treat. 7, 67–81 (2008). [DOI] [PubMed] [Google Scholar]
- Li X., Keall P., and Orton C., “Respiratory gating for radiation therapy is not ready for prime time,” Med. Phys. 34, 867–870 (2007). 10.1118/1.2514027 [DOI] [PubMed] [Google Scholar]
- Murphy M., “Fiducial-based targeting accuracy for external-beam radiotherapy,” Med. Phys. 29, 334–344 (2002). 10.1118/1.1448823 [DOI] [PubMed] [Google Scholar]
- Ren Q., Nishioka S., Shirato H., and Berbeco R., “Adaptive prediction of respiratory motion for motion compensation radiotherapy,” Phys. Med. Biol. 52, 6651–6661 (2007). 10.1088/0031-9155/52/22/007 [DOI] [PubMed] [Google Scholar]
- Ruan D., Fessler J., and Balter J., “Real-time prediction of respiratory motion based on local regression methods,” Phys. Med. Biol. 52, 7137–7152 (2007). 10.1088/0031-9155/52/23/024 [DOI] [PubMed] [Google Scholar]
- Sharp G., Jiang S., Shimizu S., and Shirato H., “Prediction of respiratory tumour motion for real-time image-guided radiotherapy,” Phys. Med. Biol. 49, 425–440 (2004). 10.1088/0031-9155/49/3/006 [DOI] [PubMed] [Google Scholar]
- Shirato H., Shimizu S., Kunieda T., Kitamura K., Van Herk M., Kagei K., Nishioka T., Hashimoto S., Fujita K., and Aoyama H., “Physical aspects of a real-time tumor-tracking system for gated radiotherapy,” Int. J. Radiat. Oncol., Biol., Phys. 48, 1187–1195 (2000). 10.1016/S0360-3016(00)00748-3 [DOI] [PubMed] [Google Scholar]
- Webb S., “Motion effects in (intensity modulated) radiation therapy: A review,” Phys. Med. Biol. 51, R403–R425 (2006). 10.1088/0031-9155/51/13/R23 [DOI] [PubMed] [Google Scholar]
- Xing L., Thorndyke B., Schreibmann E., Yang Y., Li T. -F., Kim G. -Y., Luxton G., and Koong A., “Overview of image-guided radiation therapy,” Med. Dosim. 31, 91–112 (2006). 10.1016/j.meddos.2005.12.004 [DOI] [PubMed] [Google Scholar]
- Plathow C., Ley S., Fink C., Puderbach M., Hosch W., Schmähl A., Debus J., and Kauczor H., “Analysis of intrathoracic tumor mobility during whole breathing cycle by dynamic MRI,” Int. J. Radiat. Oncol., Biol., Phys. 59, 952–959 (2004). 10.1016/j.ijrobp.2003.12.035 [DOI] [PubMed] [Google Scholar]
- Bortfeld T., Jiang S. B., and Rietzel E., “Effects of motion on the total dose distribution,” Semin. Radiat. Oncol. 14, 41–51 (2004). 10.1053/j.semradonc.2003.10.011 [DOI] [PubMed] [Google Scholar]
- Colgan R., McClelland J., McQuaid D., Evans P. M., Hawkes D., Brock J., Landau D., and Webb S., “Planning lung radiotherapy using 4D CT data and a motion model,” Phys. Med. Biol. 53, 5815–5830 (2008). 10.1088/0031-9155/53/20/017 [DOI] [PubMed] [Google Scholar]
- Ekberg L., Holmberg O., Wittgren L., Bjelkengren G., and Landberg T., “What margins should be added to the clinical target volume in radiotherapy treatment planning for lung cancer?,” Radiother. Oncol. 48, 71–77 (1998). 10.1016/S0167-8140(98)00046-2 [DOI] [PubMed] [Google Scholar]
- Erridge S. C., Seppenwoolde Y., Muller S. H., van Herk M., De Jaeger K., Belderbos J. S. A., Boersma L. J., and Lebesque J. V., “Portal imaging to assess set-up errors, tumor motion and tumor shrinkage during conformal radiotherapy of non-small cell lung cancer,” Radiother. Oncol. 66, 75–85 (2003). 10.1016/S0167-8140(02)00287-6 [DOI] [PubMed] [Google Scholar]
- Ford E., Mageras G., Yorke E., and Ling C., “Respiration-correlated spiral CT: A method of measuring respiratory-induced anatomic motion for radiation treatment planning,” Med. Phys. 30, 88–97 (2003). 10.1118/1.1531177 [DOI] [PubMed] [Google Scholar]
- Vedam S., Keall P., Kini V., Mostafavi H., Shukla H., and Mohan R., “Acquiring a four-dimensional computed tomography dataset using an external respiratory signal,” Phys. Med. Biol. 48, 45–62 (2003). 10.1088/0031-9155/48/1/304 [DOI] [PubMed] [Google Scholar]
- Low D., Nystrom M., Kalinin E., Parikh P., Dempsey J., Bradley J., Mutic S., Wahab S., Islam T., and Christensen G., “A method for the reconstruction of four-dimensional synchronized CT scans acquired during free breathing,” Med. Phys. 30, 1254–1263 (2003). 10.1118/1.1576230 [DOI] [PubMed] [Google Scholar]
- Keall P., Joshi S., Vedam S., Siebers J., Kini V., and Mohan R., “Four-dimensional radiotherapy planning for DMLC-based respiratory motion tracking,” Med. Phys. 32, 942–951 (2005). 10.1118/1.1879152 [DOI] [PubMed] [Google Scholar]
- Sonke J., Zijp L., Remeijer P., and van Herk M., “Respiratory correlated cone beam CT,” Med. Phys. 32, 1176–1186 (2005). 10.1118/1.1869074 [DOI] [PubMed] [Google Scholar]
- Nehmeh S., Erdi Y., Pan T., Pevsner A., Rosenzweig K., Yorke E., Mageras G., Schoder H., Vernon P., and Squire O., “Four-dimensional (4D) PET∕CT imaging of the thorax,” Med. Phys. 31, 3179–3186 (2004). 10.1118/1.1809778 [DOI] [PubMed] [Google Scholar]
- Krogh A., The Comparative Physiology of Respiratory Mechanisms (University of Pennsylvania Press, Philadelphia, 1941). [Google Scholar]
- Murphy M. J. and Pokhrel D., “Optimization of an adaptive neural network to predict breathing,” Med. Phys. 36, 40–47 (2009). 10.1118/1.3026608 [DOI] [PMC free article] [PubMed] [Google Scholar]
- Murphy M. and Dieterich S., “Comparative performance of linear and nonlinear neural networks to predict irregular breathing,” Phys. Med. Biol. 51, 5903–5914 (2006). 10.1088/0031-9155/51/22/012 [DOI] [PubMed] [Google Scholar]
- Suki B., Ito S., Stamenovic D., Lutchen K. R., and Ingenito E. P., “Biomechanics of the lung parenchyma: Critical roles of collagen and mechanical forces,” J. Appl. Physiol. 98, 1892–1899 (2005). 10.1152/japplphysiol.01087.2004 [DOI] [PubMed] [Google Scholar]
- Holzapfel G., “Biomechanics of soft tissue,” in The Handbook of Materials Behavior Models (Academic Press, San Diego, 2001), Vol. 3, pp. 1049–1063. [Google Scholar]
- Loring S., Brown R., Gouldstone A., and Butler J., “Lubrication regimes in mesothelial sliding,” J. Biomech. 38, 2390–2396 (2005). 10.1016/j.jbiomech.2004.10.012 [DOI] [PubMed] [Google Scholar]
- D’Angelo E., Loring S., Gioia M., Pecchiari M., and Moscheni C., “Friction and lubrication of pleural tissues,” Respir. Physiol. Neurobiol. 142, 55–68 (2004). 10.1016/j.resp.2004.05.006 [DOI] [PubMed] [Google Scholar]
- Guccione J. M., Costa K. D., and McCulloch A. D., “Finite element stress analysis of left ventricular mechanics in the beating dog heart,” J. Biomech. 28, 1167–1177 (1995). 10.1016/0021-9290(94)00174-3 [DOI] [PubMed] [Google Scholar]
- Seppenwoolde Y., Shirato H., Kitamura K., Shimizu S., van Herk M., Lebesque J., and Miyasaka K., “Precise and real-time measurement of 3D tumor motion in lung due to breathing and heartbeat, measured during radiotherapy,” Int. J. Radiat. Oncol., Biol., Phys. 53, 822–834 (2002). 10.1016/S0360-3016(02)02803-1 [DOI] [PubMed] [Google Scholar]
- Yang D., Lu W., Low D., Deasy J., Hope A., and El Naqa I., “4D-CT motion estimation using deformable image registration and 5D respiratory motion modeling,” Med. Phys. 35, 4577–4590 (2008). 10.1118/1.2977828 [DOI] [PMC free article] [PubMed] [Google Scholar]
- Werner R., Ehrhardt J., Schmidt R., and Handels H., “Modeling respiratory lung motion: A biophysical approach using finite element methods,” Proc. SPIE 6916, 69160N (2008). 10.1117/12.769155 [DOI] [Google Scholar]
- Al-Mayah A., Moseley J., and Brock K., “Contact surface and material nonlinearity modeling of human lungs,” Phys. Med. Biol. 53, 305–317 (2008). 10.1088/0031-9155/53/1/022 [DOI] [PubMed] [Google Scholar]
- West J. and Matthews F., “Stresses, strains, and surface pressures in the lung caused by its weight,” J. Appl. Physiol. 32, 332–345 (1972). [DOI] [PubMed] [Google Scholar]
- Zhang T., Orton N. P., Mackie T. R., and Paliwal B. R., “Technical note: A novel boundary condition using contact elements for finite element deformable image registration,” Med. Phys. 31, 2412–2415 (2004). 10.1118/1.1774131 [DOI] [PubMed] [Google Scholar]
- Brock K., Sharpe M., Dawson L., Kim S., and Jaffray D., “Accuracy of finite element model-based multi-organ deformable image registration,” Med. Phys. 32, 1647–1659 (2005). 10.1118/1.1915012 [DOI] [PubMed] [Google Scholar]
- Didier A., Villard P., Bayle J., Beuve M., Shariat B., Pradel H., and Lyon F., “Breathing thorax simulation based on pleura physiology and rib kinematics,” in Proceedings of the International Conference on Medical Information Visualisation-BioMedical Visualisation, 2007, pp. 35–42.
- Villard P., Beuve M., Shariat B., Baudet V., and Jaillet F., “Simulation of lung behaviour with finite elements: Influence of bio-mechanical parameters,” in Proceedings of the Third International Conference on Medical Information Visualisation-Biomedical Visualisation (MediVis 2005), 2005, pp. 9–14.
- Villard P., Beuve M., Shariat B., Baudet V., and Jaillet F., “Lung mesh generation to simulate breathing motion with a finite element method,” in Proceedings of the Eighth International Conference on Information Visualisation, 2004, pp. 194–199.
- Al-Mayah A., Moseley J., Velec M., and Brock K., “Effect of friction and material compressibility on deformable modeling of human lung,” in Biomedical Simulation, Lecture Notes in Computer Science (Springer, Berlin, 2008), pp. 98–106. 10.1007/978-3-540-70521-5_11 [DOI] [Google Scholar]
- Matthews F. and West J., “Finite element displacement analysis of a lung,” J. Biomech. 5, 591–600 (1972). 10.1016/0021-9290(72)90031-0 [DOI] [PubMed] [Google Scholar]
- Radford E., Tissue Elasticity (American Physiological Society, Washington, D.C., 1957), pp. 177–190. [Google Scholar]
- Werner R., Ehrhardt J., Schmidt R., and Handels H., “Patient-specific finite element modeling of respiratory lung motion using 4D CT image data,” Med. Phys. 36, 1500–1511 (2009). 10.1118/1.3101820 [DOI] [PubMed] [Google Scholar]
- Nguyen T., Moseley J., Dawson L., Jaffray D., and Brock K., “Adapting liver motion models using a navigator channel technique,” Med. Phys. 36, 1061–1073 (2009). 10.1118/1.3077923 [DOI] [PMC free article] [PubMed] [Google Scholar]
- Vandemeulebroucke J., Sarrut D., and Clarysse P., “Point-validated pixel-based breathing thorax model,” in Proceedings of the International Conference on the Use of Computers in Radiation Therapy (ICCR), 2007.
- Lin L., Shi C. T., Liu Y., Swanson G., and Papanikolaou N., “Development of a novel post-processing treatment planning platform for 4D radiotherapy,” Technol. Cancer Res. Treat. 7, 125–132 (2008). [DOI] [PMC free article] [PubMed] [Google Scholar]
- Bathe K., Finite Element Procedures (Prentice Hall, Englewood Cliffs, 1996). [Google Scholar]
- Lai-Fook S., “Pleural mechanics and fluid exchange,” Physiol. Rev. 84, 385–410 (2004). 10.1152/physrev.00026.2003 [DOI] [PubMed] [Google Scholar]
- West J., Respiratory Physiology: The Essentials, 7th ed. (Williams and Wilkins, Baltimore, 2007). [Google Scholar]
- Santhanam A., Imielinska C., Davenport P., Kupelian P., and Rolland J., “Modeling real-time 3-D lung deformations for medical visualization,” IEEE Trans. Inf. Technol. Biomed. 12, 257–270 (2008). 10.1109/TITB.2007.899489 [DOI] [PubMed] [Google Scholar]
- Salazar E. and Knowles J. H., “An analysis of pressure-volume characteristics of the lungs,” J. Appl. Physiol. 19, 97–104 (1964). [DOI] [PubMed] [Google Scholar]
- ABAQUS, ABAQUS Analysis: User’s Manual (Dassault Systemes, 2007).
- Zeng Y., Yager D., and Fung Y., “Measurement of the mechanical properties of the human lung tissue,” J. Biomech. Eng. 109, 169–174 (1987). 10.1115/1.3138661 [DOI] [PubMed] [Google Scholar]
- Gao J., Huang W., and Yen R., “Mechanical properties of human lung parenchyma,” Biomed. Sci. Instrum. 42, 172–180 (2006). [PubMed] [Google Scholar]
- Sarrut D., Boldea V., Miguet S., and Ginestet C., “Simulation of four-dimensional CT images from deformable registration between inhale and exhale breath-hold CT scans,” Med. Phys. 33, 605–617 (2006). 10.1118/1.2161409 [DOI] [PubMed] [Google Scholar]
- Sarrut D., Delhay S., Villard P., Boldea V., Beuve M., and Clarysse P., “A comparison framework for breathing motion estimation methods from 4-D imaging,” IEEE Trans. Med. Imaging 26, 1636–1648 (2007). 10.1109/TMI.2007.901006 [DOI] [PubMed] [Google Scholar]


