Abstract
A novel phenomenon has recently been reported in polymeric nanopores. This phenomenon, so-called nanoprecipitation, is characterized by the transient formation of precipitates in the nanopore lumen, producing a sequence of low and high conductance states in the ionic current through the pore. By means of all-atom molecular dynamics simulations, we studied nanoprecipitation for polyethylene terephthalate nanopore immersed in electrolytic solution containing calcium phosphate, covering a total simulation time of 1.24 microseconds. Our results suggest that protonable surface residues at the nanopore surface, namely carboxyl groups, trigger the formation of precipitates which strongly adhere to the surface, blocking the pore and producing the low conductance state. Based on the simulations, we propose a mechanism for the formation of the high conductance state; the mechanism involves detachment of the precipitate from the surface due to reprotonation of carboxyl groups and subsequent translocation of the precipitate out of the pore.
Keywords: polymer nanopore, polyethylene terephthalate, nanoprecipitation, calcium phosphate, ionic current oscillations
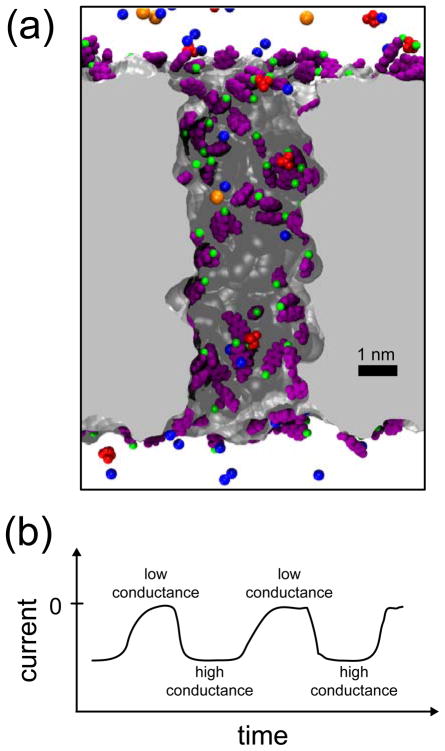
Solid-state nanopores are manufactured drilling through synthetic membranes made of silicon-based glasses,1–3 aluminium oxide,4,5 or polymeric films.6,7 Figure 1a depicts a model of a polyethylene terephthalate (PET) polymer nanopore in electrolytic solution. Because of their apertures of just a few nanometers, nanopores usually translocate a single charged biopolymer at a time;8 for example, a strand of nucleic acid. As the molecules thread their way through a nanopore, they produce electrical signals characteristic of their structure. Such signals have been used to differentiate single-stranded from double-stranded DNA,9,10 to detect hairpin formation in RNA,11 to recognize methylation in DNA,12 and to study DNA-protein complexes.13,14 Recently, researchers have started to add chemical modifications to the pore surface, opening the possibility for more complex applications, such as nanofluidic diodes that control ion flow,15,16 protein-coated channels to study cellular transport,17 and DNA-coated nanopores that switch the diameter depending on pH conditions. 18 Even though the number of nanopore applications is increasing, our understanding of the physical processes inside the nanopore is still in its early stages. In this regard, an atomic level description of the interactions with the pore surface is essential to improve technical uses of nanopores. Those interactions, due to the high surface-to-volume ratio inside nanopores, affect the selectivity of the pore as well as the dynamics of the translocating molecules.
Figure 1.
(a) Atomic model of a polyethylene terephthalate (PET) nanopore. The snapshot shows a PET nanopore in electrolyte solution, the nanopore sliced along the pore axis. PET material is shown as a gray surface; negatively charged PET residues are shown in purple; K+, Cl−, Ca2+ and ions are colored in blue, orange, green and red, respectively; water molecules are not shown. (b) Schematic representation of nanoprecipitation oscillations. When a PET nanopore is immersed in electrolyte solution containing Ca2+ and ions, an external electric field produces an oscillating ionic current through the pore, characterized by a sequence of low and high conductance states.19
In a recent study,19 Powell and colleagues described a new phenomenon occurring in polymeric PET nanopores, namely the formation of transient precipitates inside the pore lumen, so-called nanoprecipitation. This phenomenon occurs when a voltage bias is applied across a polymeric nanopore membrane immersed in phosphate buffer solution. If the solution contains monovalent cations, such as K+, the ions flow through the pore establishing a constant ionic current. However, if the solution contains sub-millimolar concentrations of divalent cations, such as Ca2+, Co2+ or Mg2+, the ionic current is not constant but oscillates, reflecting a sequence of low and high conductance states. Figure 1b shows a cartoon representation of the ionic current oscillations, i.e., it is only a schematic representation of the low-conductance/high conductance states observed in experiments.19 Powell et al. demonstrated that the oscillations are due to the formation of small precipitates containing divalent cations and phosphate ions. The low conductance state is caused by a precipitate getting clogged in the nanopore, obstructing the ion flow, while the high conductance state is caused by the dissolution of the precipitate, resetting the ion flow.
The discovery of nanoprecipitation inside nanopores provides us with a clear example of the interplay between pore surface and translocating molecules. The chemical structure of the nanopore walls plays a key role in the formation of the nanoprecipitates. As a result of the fabrication process, the pore surface is covered by PET terminal residues, which contain negatively charged carboxyl groups6,7 (see Figure 1). Using theoretical modeling based on Poisson-Nernst-Planck (PNP) equations, Powell et al. proposed that the combined effect of the negative nanopore surface and the applied voltage bias produces a high accumulation of ions inside the nanopore, leading to the formation of a nanoprecipitate blocking the pore. Even though the PNP modeling captures some physical insight regarding the phenomenon, it lacks an atomic description of the nanopore and assumes a smooth pore surface with continuous negative charge. Therefore, a molecular understanding of the nanoprecipitation mechanism is still needed.
In this paper, we investigate nanoprecipitation using atomic level molecular dynamics (MD) simulations. MD simulations provide an all-atom description of the nanopore surface, ions and solvent molecules, on time scales that can be extended up to microseconds. Indeed, MD simulations have been extensively employed in nanopore research,9,10,12,20–23 providing accurate dynamic images used to complement experiments. The paper is organized as follows: First, we discuss the formation of precipitates in solution. Second, we study the formation of precipitates inside PET nanopores, and describe the atomic events that take place during the low conductance state. Finally, we investigate the high conductance state, exploring three different scenarios for pore opening.
Results and Discussion
In order to elucidate the atomic origin of nanoprecipitation, we performed all-atom MD simulations of a PET nanopore immersed in electrolyte solution containing divalent cations and phosphate ions. Our choice of divalent cation is Ca2+, as it is also used in the experimental studies24,25 leading to the discovery of nanoprecipitation in polymeric nanopores. The Methods section contains detailed information about the atomic models, force fields, and MD protocols employed. Experimentally, nanoprecipitation oscillations take place in hundreds of milliseconds. To avoid this long time scale which is prohibitively long for MD simulations, the systems were set up in conformations where the relevant atomic events of nanoprecipitation can occur rapidly, i.e., on a time scale accessible for MD.
Below, we report the results of 23 MD simulations, covering altogether 1.24 μs. First, we focus on the formation of calcium phosphate precipitates in solution, without PET nanopore. Second, we study the calcium phosphate precipitation in nanopores. Third, we consider two proposed mechanisms for removal of the precipitates from the nanopore, namely dissolution and voltage-driven translocation of the precipitate. Finally, we suggest a new mechanism for removal of the precipitate, namely the translocation of the precipitate after reprotonation of the PET surface.
Formation of Calcium Phosphate Precipitates in Solution
Our first aim was to determine whether calcium phosphate precipitation can be observed in MD simulations. In aqueous solution, ionic salts containing weak acids or weak bases precipitate if the product of the ionic activities is higher than the solubility product (Ksp). The Ksp value for CaHPO4, at ambient conditions, is in the range of 1 × 10⁻⁷ mol2 L−2,26 which indicates that CaHPO4 is a sparingly soluble salt and precipitates when its concentration exceeds 0.3 mM. To observe precipitation, we prepared five systems containing only water, Ca2+ and ions, with CaHPO4 concentrations higher than 0.3 mM. A system with an ionic concentration close to 0.3 mM is not practical for MD studies, as it would contain just a few ions in a very large water box. The range chosen was 0.2 to 2.2 M. Since CaHPO4 acts as a buffer and the phosphate ions can change their protonation states, we decided to include systems containing Ca(H2PO4)2. The MD simulations performed are summarized in Table 1.
Table 1.
MD simulations of calcium phosphate precipitation in a solvent box. The table lists the CaHPO4 (1–4) and Ca(H2PO4)2 (5–6) concentrations used. Each simulation is labeled with a number (first column), followed by the number of ions employed. The fourth and fifth columns present the molar concentration for and ions, respectively. The systems were first equilibrated as described in Methods.
| Sim | # Ca2+ | # | # | Time (ns) | ||||
|---|---|---|---|---|---|---|---|---|
| 1 | 20 | 20 | 0 | 0.2 | 0 | 50 | ||
| 2 | 49 | 49 | 0 | 0.5 | 0 | 50 | ||
| 3 | 98 | 98 | 0 | 1.1 | 0 | 50 | ||
| 4 | 196 | 196 | 0 | 2.2 | 0 | 50 | ||
| 5 | 10 | 0 | 20 | 0 | 0.2 | 50 | ||
| 6 | 20 | 0 | 40 | 0 | 0.4 | 50 | ||
| 7 | 49 | 0 | 98 | 0 | 1.0 | 50 | ||
| 8 | 98 | 0 | 196 | 0 | 2.0 | 50 | ||
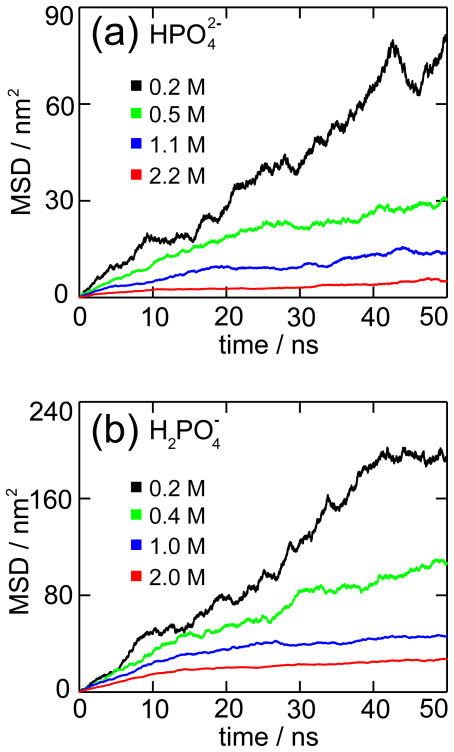
We observed the formation of precipitates for all MD simulations as listed in Table 1. The transition of the ions from bulk solution into a solid phase can be detected by calculating the mean-square-displacement (MSD) and the radial distribution function (g(r)). Figure 2 shows the MSD computed for all phosphorus (P) atoms. A linear increment in the MSD corresponds to random diffusion of solvated ions, while a constant MSD value reveals the existence of a solid phase.
Figure 2.
Mean-square displacement (MSD). The figure shows the MSD for all phosphorus atoms for (a) and (b) MD simulations listed in Table 1.
For both and ions, concentrations higher than 0.4 M (Sim 2–4, 6–8) show an initial linear increment in the MSD, which reflects the movement of the ions from their random distribution into a solid aggregate. In the last 20–25 ns, the MSD values exhibit constant horizontal slopes due to the formation of a stable precipitate. The subsequent small rises in MSD correspond to the diffusion of both the solid precipitates and of some ions still free in solution. For concentrations lower than 0.4 M (Sim 1 and 5), the MSD values show the formation of precipitates only at the end of the 50 ns MD simulations.
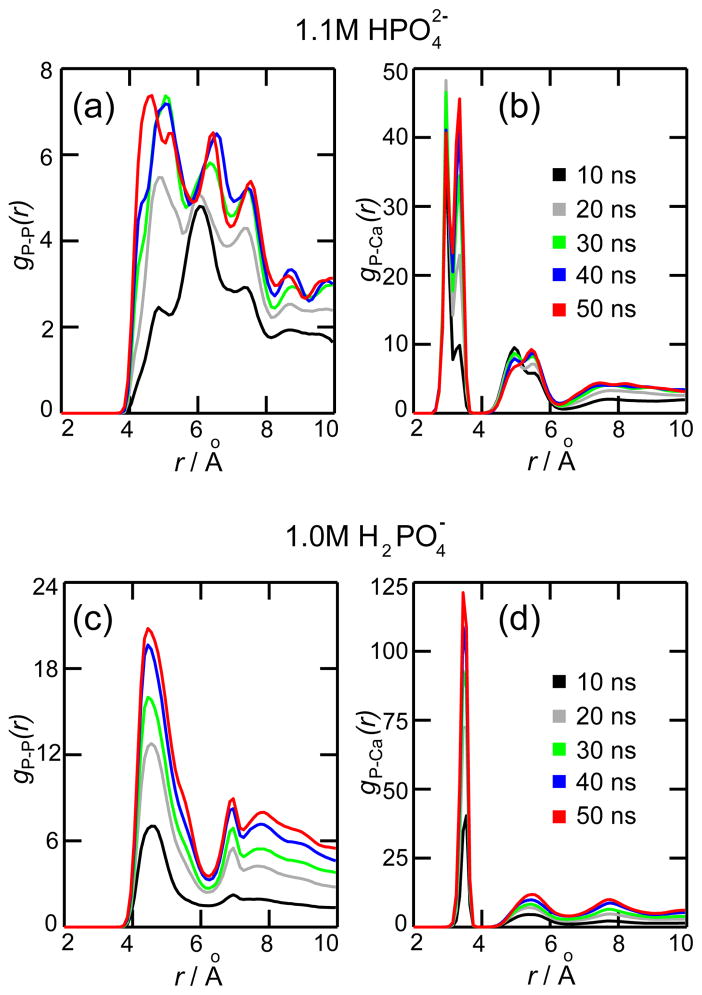
Figure 3 shows the variation of g(r) for 1 M phosphate solutions, each color line representing a 10 ns average. Similar g(r) profiles were seen for the other concentrations, only 1 M concentrations being presented. The g(r) profiles not only confirm the formation of a solid phase, but also provide information about the local structure of the precipitate. Figures 3a and 3b show g(r) for P-P and P-Ca atom pairs, respectively, for a 1.1 M concentration. As the simulation progresses in time, a P-P peak appears near 4.6 Å (Figure 3a), which is the average distance between two P-P centers capturing a common Ca2+ ion. This is followed by a sequence of P-P peaks periodically spaced, such strong correlation being characteristic of a solid crystalline structure. The g(r) for P-Ca pairs (Figure 3b) shows two sharp peaks at 3.0 and 3.4 Å. The first peak occurs when Ca2+ is in contact with two oxygens from the same , while the second peak occurs when Ca2+ is in contact with only one oxygen of . Moreover, the value of gP–Ca(r) around 4 Å is zero, Ca2+ ions being excluded from that region because it is already filled with a P atom.
Figure 3.
Radial distribution function g(r). The figures present g(r) for calcium phosphate solutions containing 1.1 M (a,b) and 1.0 M (c,d). Each line presents g(r) averaged over a 10 ns period: 0–10 ns (black), 10–20 ns (gray), 20–30 ns (green), 30–40 (blue) and 40–50 ns (red). The g(r) values were calculated for phosphorus-phosphorus atom pairs (a,c) and phosphorus-calcium atom pairs (b,d).
For 1.0 M concentration, g(r) for P-P and P-Ca atom pairs are presented in Figures 3c and 3d, respectively. A comparison between the gP–P(r) profiles for (Figure 3a) and (Figure 3c) reveals that the change in phosphate protonation state modifies the molecular arrangement of the precipitate. The overall P-P distribution in Figure 3c corresponds to a less structured amorphous solid. The gP–Ca(r) profile (Figure 3d) shows a single sharp peak at 3.5 Å, which corresponds to the P-Ca distance when Ca2+ is in contact with only one oxygen of . There are no contacts between Ca2+ and two oxygens from the same .
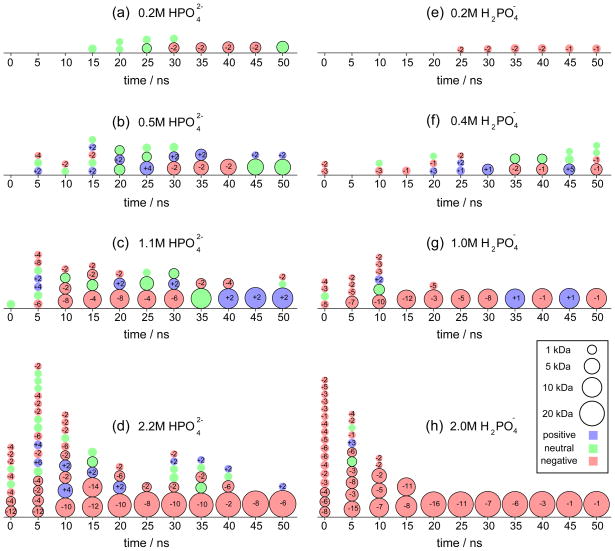
Both MSD and g(r) display clear evidence of the development of a solid phase, but do not provide information about number, size and charge of the precipitates. To address this point, we counted the precipitates as they appeared in solution. The procedure to identify a precipitate is based on the pair distances presented in Figure 3 and is described in Methods. Figure 4 provides a schematic view of each individual precipitate, its size and charge, for the entire range of concentrations. Each precipitate is represented as a circle, the radius being proportional to the cube root of the precipitate’s mass. The charge sign is color coded and the total charge is indicated in each circle. Such snowman-like representations provide a generic picture of the precipitation process. Similar plots will be used in the next subsection to present the development of precipitates inside nanopores.
Figure 4.
Variation of individual precipitates as a function of time. The figure shows schematic representations of individual precipitates for calcium phosphate solutions with different (a–d) and (e–h) concentrations. Each precipitate is represented as a circle, the radius being proportional to the cube root of the precipitate’s mass. For each given time, the precipitates are sorted based on their weight with the heavier ones at the bottom. The legend shows four reference circles, that represent masses of 1, 5, 10 and 20 kDa. Precipitates heavier than 1 kDa have black contour lines around the circle. The precipitate’s charge is color coded: blue for positive, red for negative and green for neutral. The total charge is displayed in each circle.
In Figure 4, one can identify the two stages of precipitation, namely, the initial nucleation of small precipitates and the following fusion and growth. For instance, for solutions with 0.2 M (4a) and 0.2 M (4e), nucleation started after about 15–25 ns, but there were not enough ions to observe a significant growth. For 0.5 M (4b) and 0.4 M (4f) concentrations, small precipitates appeared within the first 5–10 ns and started to aggregate at 20–30 ns. In the case of 1.1 M (4c) and 1.0 M (4g) concentrations, small precipitates appeared immediately and fusion started at about 10 ns; a movie showing the two MD simulations (Sim0307.mpg) is provided with the Supporting Information. Finally, for 2.2 M (4d) and 2.0 M (4h) concentrations, the high ionic concentrations produced a large number of small precipitates from the very beginning, and fusion started after 5 ns. As it can be discerned from Figure 4, the higher the concentration, the larger the size of the precipitates.
Formation of Calcium Phosphate Precipitates in Nanopores
The ionic current oscillations observed in PET nanopores19 have been attributed to the negative charge on the PET walls that, together with the applied voltage bias, increase the Ca2+ concentration inside the nanopore, leading to the formation of transient CaHPO4 precipitates. The precipitation of CaHPO4 should be clearly observable in MD simulations for two reasons: First, we recently reported27 that Ca2+ ions are adsorbed by negatively charged PET residues present at the nanopore surface. In that study we showed that Ca2+ adheres to PET carboxyl groups, resulting in a high local concentration of Ca2+ ions inside the pore. Second, in the previous subsection we demonstrated that MD simulations can accurately describe the formation of CaHPO4 precipitates. Therefore, it is expected that a MD model, composed of phosphate ions, a PET nanopore, and Ca2+ adsorbed at the PET surface, would display the atomic dynamics of the precipitation process.
Accordingly, we performed six simulations using a nanopore with 1 nm minimum radius, 10 nm length, and surface charge density of −1 e nm−2. The nanopore was solvated and a layer of Ca2+ ions was located next to the deprotonated carboxyl groups. The negative surface charge was neutralized by adding one Ca2+ ion for each pair of carboxyl groups. The Ca2+ ions were located based on the electrostatic potential of the nanopore (see ref.27 and Supporting Information). Six systems were created by adding phosphate ions, using two phosphate protonation states and different spatial distributions. K+ and Cl− ions were added into the solvent compartments to ensure electroneutrality, and the systems were equilibrated for 2.2 ns (see Methods). A summary of the MD simulations performed is presented in Table 2. The simulations are organized into two groups: In a first group (Sim 9 and 10), phosphate ions were arranged into two different starting conformations, either in the solvent compartments or inside the nanopore, and were allowed to freely diffuse. In a second group (Sim 11–14), phosphate ions were located at the top pore opening and their displacements were biased towards the nanopore interior.
Table 2.
MD simulations of calcium phosphate precipitation in PET nanopores. The table lists the number of ions and conditions applied to phosphate ions. For simulations 9–13, 145 Ca2+ ions were located near the deprotonated carboxyl groups. For simulation 14, instead of Ca2+ ions, 290 K+ ions were located near the negatively charged PET surface. The phosphate ions were initially arranged using three different conformations: in the solvent compartments (Sim 9), inside the nanopore region (Sim 10) and inside a cylindrical volume located at the top opening (Sim 11–14). For simulations 11–14, the movement of phosphate ions was restrained using phantom surfaces (see text). The systems were first equilibrated as described in Methods. MD simulations were performed under +1 V bias.
| Sim | # K+ | # Cl− | # Ca2+ | # | # | Initial phosphate distribution | Phantom surface | Time (ns) |
|---|---|---|---|---|---|---|---|---|
| 9 | 151 | 50 | 145 | 50 | 0 | solv. compartments. | no | 30 |
| 10 | 151 | 50 | 145 | 50 | 0 | nanopore region | no | 50 |
| 11 | 151 | 50 | 145 | 50 | 0 | top opening | yes | 150 |
| 12 | 101 | 50 | 145 | 0 | 50 | top opening | yes | 150 |
| 13 | 125 | 50 | 145 | 24 | 26 | top opening | yes | 100 |
| 14 | 441 | 50 | 0 | 50 | 0 | top opening | yes | 100 |
The purpose of the first group of MD simulations was to produce spontaneous CaHPO4 precipitation without any restraints in the system. In simulation 9, 50 ions were randomly located in the upper and lower solvent compartments. As reported before,27 Ca2+ ions remained adsorbed at the PET surface and did not diffuse into the solvent compartments. During the simulation, some ions moved close to the surface and into the nanopore, binding to the adsorbed Ca2+ ions, but the ions did not aggregate to create a precipitate large enough to block the pore opening. Figure 1a shows a snapshot of the last frame of the simulation.
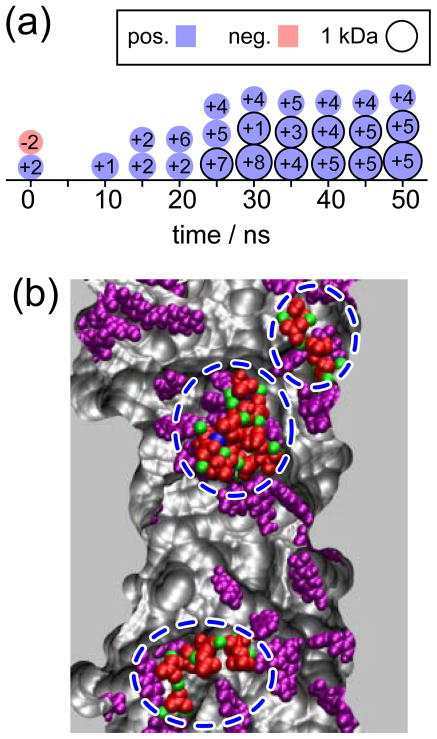
In simulation 10, 50 ions were located inside the nanopore volume, providing a high phosphate concentration near the layer of adsorbed Ca2+ ions. In this case, CaHPO4 precipitation was observed, the results being presented in Figure 5a (see also movie Sim11.mpg in Supporting Information). Within the first 25 ns, we observed the formation of three small precipitates bound to negatively charged PET residues. At the same time, some phosphates attached to Ca2+ ions, releasing them from the surface. The small growth was due to the union of these released fragments with the precipitates at the surface. An interesting result is that nucleation took place at the surface of the pore. The deprotonated carboxyl groups of PET acted as nucleation centers, providing accessible Ca2+ ions for precipitation and retaining the precipitates during their growth. Figure 5b shows a snapshot of the last frame of simulation 10; three precipitates are seen, all attached to PET carboxyl groups through Ca2+ ions. Another interesting result is that some precipitates contained K+ ions. The final compositions of the three precipitates are (0.6 kDa), (1.1 kDa), and (1.9 kDa).
Figure 5.
Precipitation in PET nanopores. Panel (a) shows a schematic representation of CaHPO4 precipitation observed in simulation 10. Each precipitate is represented as a circle; the radius is proportional to the cube root of the mass, the charge is color coded and labeled in each circle. Panel (b) shows a snapshot of the final frame of the simulation. The nanopore is shown sliced in the middle, the negatively charged PET residues are shown in purple. , Ca2+ and K+ ions are colored in red, green and blue, respectively. The three precipitates are highlighted with dashed blue lines. Water molecules and ions that are not part of precipitates are not shown. A movie showing this MD simulation is provided in Supporting Information.
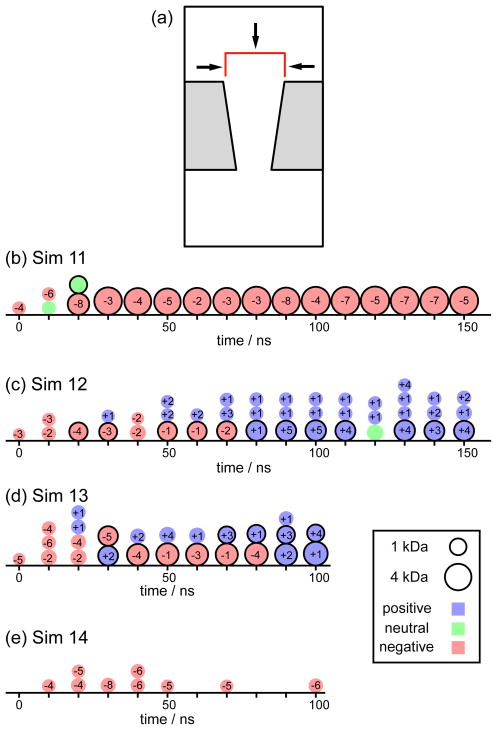
The objective of the second group of MD simulations was to create a flow of phosphate ions through the nanopore. For this purpose, the phosphates were initially placed in front of the top pore opening, their starting positions randomly assigned within a cylindrical volume of 2.2 nm radius and 3 nm height concentric with the pore axis. The displacement of the phosphate ions was restrained by the top surface and the lateral walls of the cylinder using phantom surfaces:22,28 any phosphate reaching those boundaries experienced an elastic collision toward the interior of the cylinder, as shown schematically in Figure 6a. In this way, the phosphates were forced to diffuse towards the interior of the nanopore. The restraints were removed for all phosphate ions that completely translocated the pore and crossed the periodic cell into the upper solvent compartment.
Figure 6.
Precipitation in PET nanopores using different phosphate protonation states. Panel (a) shows a schematic view of the system. Fifty phosphate ions were randomly distributed within a cylindrical volume located at the top pore opening (red lines). When a phosphate ion crosses the top or the lateral walls of the cylinder, it experiences an elastic collisions normal to the cylinder surface (black arrows). Panels (b), (c), (d) and (e) show the precipitation process for simulations 11, 12, 13, and 14, respectively. Movies for these MD simulations are provided in Supporting Information.
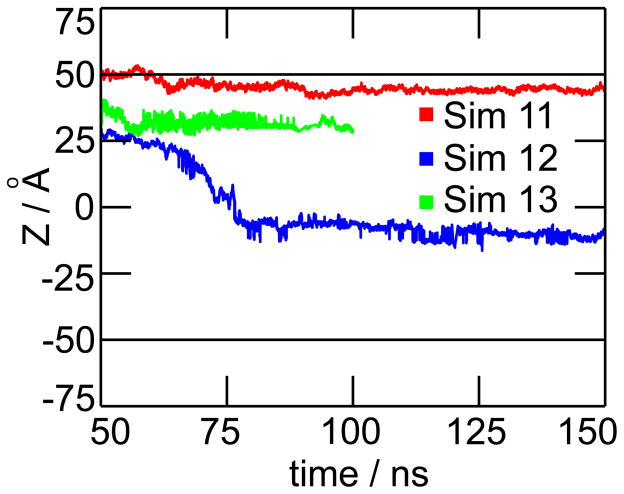
Three simulations were performed using two different protonation states: one with 50 ions (Sim 11), one with 50 ions (Sim 12), and one with a mixture of 24 and 26 ions (Sim 13). We also performed a control simulation with 50 ions but without Ca2+ ions (Sim 14). The results are summarized in Figures 6b–e. Precipitation was observed for all three simulations containing calcium and phosphate ions (Sim 11–13). For simulation 11 (Figure 6b), nucleation and growth occurred within the first 30 ns, resulting in the formation of a single massive precipitate of 4.5 kDa, which remained stable for the rest of the simulation (see movie Sim11.mpg). The red curve in Figure 7 shows the Z-position of the precipitate from 50 to 150 ns. The precipitate remained attached to the PET surface at the same location, near the pore opening. Its final composition is (4.8 kDa), covering about 37 % of the area at the top pore opening. It can be assumed that if we had provided more than 50 ions, the precipitate would keep growing until blockage of the pore is complete, hence, stopping the ion flow and producing the low conductance state. For simulation 12 (Figure 6c), the change in phosphate protonation state slowed down the aggregation, avoiding the formation of a single large precipitate. As ions moved through the nanopore, some of them were absorbed by Ca2+ ions at the surface, resulting in few small precipitates (see movie Sim12.mpg). The blue curve in Figure 7 shows the Z-coordinate of the heaviest precipitate. This precipitate was initially formed near the pore opening but loosely bound to the surface. Therefore, it was released and moved through the pore surface, until it was adsorbed below the middle of the pore. At the end of simulation 12, we observed three precipitates attached to the surface, whose compositions are (0.6 kDa), (0.8 kDa), and (1.7 kDa). For simulation 13 (Figure 6d), the presence of ions accelerated the aggregation process (movie Sim13.mpg). At 30 ns, two separate precipitates were seen, their final compositions after 100 ns were (1.1kDa) and (2.9 kDa). The green curve in Figure 7 shows that the heaviest precipitate remained attached to the pore wall. Finally, simulation 14 (Figure 6e), did not produce precipitation, which is in good agreement with experimental results.19,25 As precipitation does not occur between K+ and ions; the small circles observed in Figures 6e correspond to and K+ ions that were in close contact due to random collisions, but did not aggregate, and eventually dispersed as they diffused towards the lower solvent compartment (movie Sim14.mpg).
Figure 7.
Location of precipitate along the pore axis. Figure shows the Z-coordinate of the center of mass for the heaviest precipitates in simulations 11 (red line), 12 (blue line) and 13 (green line). Black horizontal lines indicate the location of the top and bottom openings of the pore.
Dissolution and Translocation
As presented above, the low conductance state is associated with the formation of a solid precipitate in the nanopore. Naturally, a high conductance state indicates that the flow of ions has resumed (see Figure 1b); thus, high conductance has to be associated with the opening of the pore due to removal of the precipitate. In their original work, Powell et al.19 considered that pore opening can not be due to the voltage-driven translocation of the entire precipitate and the authors suggested as the most likely scenario the dissolution of the precipitate inside the nanopore. This hypothesis was supported by PNP modeling of Mg(OH)2 precipitation. The PNP model assumed that both cations and anions are mobile; therefore, the ionic concentrations inside the pore are proportional to the magnitude of the applied voltage. When the pore is blocked, the voltage drop focuses mainly on the precipitate, causing a complementary decrease in the electric field at the vicinity of the precipitate; therefore, the ionic concentrations/activities decrease at the regions near the precipitate. Due to the low ionic concentrations, the product of the ionic activities becomes lower than the Ksp value and the precipitate dissolves.
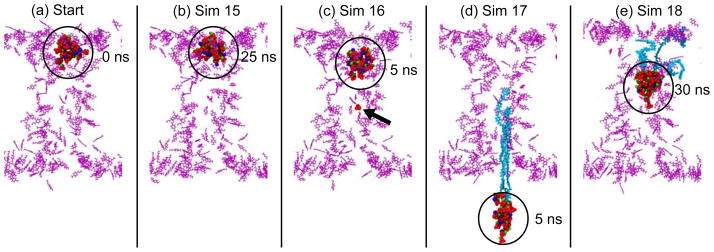
We tested both the dissolution and the voltage-driven translocation hypotheses. A summary of the MD simulations performed is presented in Table 3. For these MD simulations, the starting structure was the last frame of simulation 11, which contains the largest precipitate (Figure 8a). The dissolution hypothesis was evaluated in simulation 15. In order to mimic the proposed reduction of the electric field, no voltage bias was applied to the system. In this case, no dissolution was observed; the precipitate remained attached to the surface at the same position and its size barely changed (Figure 8b). During this simulation, the solvent compartments contained on average 9.45 ions and not a single Ca2+ ion; therefore, the Ca2+ and concentrations in the regions close to the precipitate were very low. It can be argued, though, that a 25-ns MD simulation is not long enough to observe dissolution. However, we do not expect to observe dissolution even for a longer simulation. There is a substantial difference between PNP and MD models. In PNP modeling, Ca2+ ions are able to move under the influence of the external electric field, whereas in MD simulations, most Ca2+ ions remain bound to PET carboxyl groups, resulting in a high number of Ca2+ ions available for precipitation even at zero voltage. We can not rule out the dissolution hypothesis, since the dissolution of the nanoprecipitate requires time scales that are not accessible to all-atom MD simulations. Nevertheless, the possibility of precipitate dissolution should be revised, since the PNP model considered that divalent cations are mobile, which does not seem to be the case in reality.
Table 3.
MD simulations of dissolution and translocation. The table presents the conditions applied for dissolution (Sim 15) and translocation (Sim 16–18). The type of MD simulation is listed in the second column: EQ, cv-SMD and g-SMD denote equilibration, constant velocity SMD and grid-SMD, respectively. The third column contains the number of ions under the influence of SMD forces. For simulations 16 and 17, the steering atoms are part of the precipitate. For simulation 18, all and Ca2+ ions in the system experience g-SMD forces. Details of the SMD protocols and equilibration procedures are presented in Methods.
| Sim | Type | Steering atoms | Voltage (V) | Time (ns) |
|---|---|---|---|---|
| 15 | EQ | – | 0 | 25 |
| 16 | cv-SMD | 1 | +1 | 5 |
| 17 | cv-SMD | 34 | +1 | 5 |
| 18 | g-SMD | 50 , 145 Ca2+ | +1 | 30 |
Figure 8.
Dissolution and translocation connected with pore-opening. Snapshots show the starting structure (a) and the last frames for simulations 15 (b), 16 (c), 17 (d) and 18 (e). Deprotonated PET residues are pictured as purple lines, , Ca2+, and K+ ions are colored in red, green, and blue, respectively. The location of the precipitate is highlighted with a black circle. For simulation 16 (c), the position of the pulling ion is highlighted with a black arrow. For simulations 17 (d) and 18 (e), the precipitate tore three PET chains from the pore, colored in cyan.
We also tested the voltage-driven translocation hypothesis, which was initially discarded by Powell et al. For this purpose, we performed a group of three steered molecular dynamics (SMD) simulations (Sim 16–18). Different SMD conditions were employed for each simulation (see Table 3). In a first attempt (Sim 16), we pulled the precipitate through a single phosphate ion attached to it. The precipitate did not translocate and remained attached to the surface, whereas the phosphate pulled was released from the precipitate (Figure 8c). In a second attempt (Sim 17), we pulled all phosphate ions forming the precipitate. Due to the strong attachment to the PET carboxyl groups, the precipitate tore off three PET polymer chains, damaging the pore (Figure 8d). In a third attempt, we used grid-SMD (g-SMD)29 to pull all phosphate and Ca2+ ions (Sim 17). In g-SMD, the steering forces are calculated from a potential defined on a grid; hence, it can be used to scale up the electrostatic force. As the precipitate translocated, it collected Ca2+ ions, resulting in a decrease in its negative charge. Accordingly, the steering forces acting on the precipitate also decreased, and the precipitate moved only up to the middle of the pore. Similar to simulation 17, three PET chains were torn off from the pore (Figure 8e).
The results of simulations 16–18 led us to discard voltage-driven translocation. On the one hand, the strong interactions with the PET surface can readily stop the precipitate from moving. On the other hand, the charge of the precipitate is not fixed and it can be decreased or neutralized during translocation, reducing the effect of the applied voltage.
Surface Reprotonation
We considered, therefore, an alternative scenario for pore opening, which overcomes the strong binding between nanopore and precipitate. In order to release the precipitate from the nanopore surface, deprotonated PET carboxyl groups were reprotonated. The change in protonation state was taken into consideration for two reasons: First, PET carboxyl groups are covalently joined to benzene rings, resembling the structure of benzoic acid, a weak acid that is easily protonated under mildly acidic conditions. Second, phosphate ions coexist in different protonation states and can donate protons to PET carboxyl groups. Based only on the pKa values of 4.2 for benzoic acid and 7.2 for , we should not have considered this event. However, pKa values describe the average protonation state of millions of ions in solution; the mechanism in the nanopore, with few phosphate ions in very close proximity to the PET carboxyl groups, may not be well characterized through the bulk pKa values. A previous quantum/classical molecular mechanics study30 proposed that during the crystallization of calcium phosphates, ions act as proton donors. The mechanism described for deprotonation involves the aggregation with two Ca2+ ions to assemble a ion complex. The positive net charge of the ion complex increases the acidity of the ion, releasing a proton. A similar mechanism can be formulated for reprotonation of PET carboxyl groups. The precipitate contains ions in direct contact with Ca2+ ions. Protons can be released from the precipitate and diffuse towards the PET carboxyl groups located in the near vicinity. Indeed, the PET carboxyl groups attached to the precipitate are in direct contact with water molecules (see Supporting Information), i.e., the carboxyl groups holding the precipitate are also accessible to hydrogen-bond donors from the aqueous solution. We have already reported that protonated PET residues do not adsorb Ca2+ ions;27 therefore, the precipitate should detach from the nanopore surface and would eventually abandon the pore.
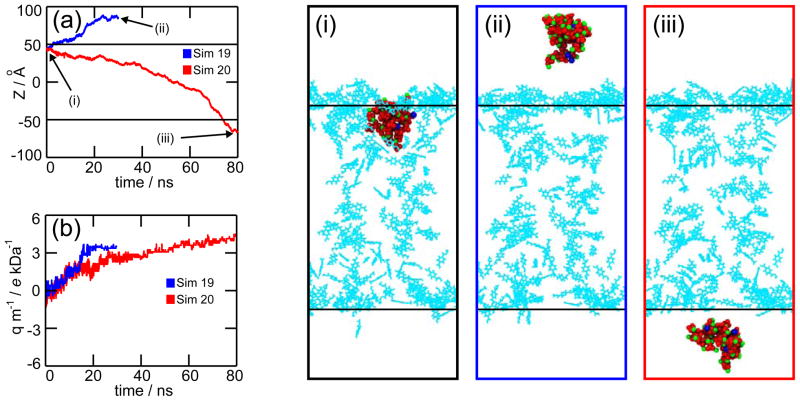
To test the stated hypothesis, we performed five MD simulations. We employed two approaches for reprotonation: in the first one, referred to as total reprotonation, all PET carboxyl groups in the nanopore were reprotonated; in the second one, referred to as gradual reprotonation, only the PET carboxyl group in contact with the precipitate were reprotonated. A summary of the MD simulations is presented in Table 4.
Table 4.
MD simulations of PET surface reprotonation. Listed are the starting structures and the number of reprotonated and deprotonated carboxyl groups for total reprotonation (19–20) and gradual reprotonation (21–23) MD simulations. For each simulation, the initial coordinates were taken from the last frame of the simulations listed in the second column (see Table 2 for Sim 11). The systems were first equilibrated as described in Methods.
| Sim | Start | # reprot. | #deprot. | Voltage (V) | Time (ns) |
|---|---|---|---|---|---|
| 19 | Sim 11 | 291 | 0 | +1 | 30 |
| 20 | Sim 11 | 291 | 0 | −1 | 80 |
| 21 | Sim 11 | 6 | 285 | +1 | 35 |
| 22 | Sim 19 | 7 | 284 | +1 | 25 |
| 23 | Sim 20 | 9 | 282 | +1 | 25 |
For the total reprotonation approach, we performed two MD simulations using +1 V (Sim 19) and −1 V (Sim 20) biases. In both MD simulations, the precipitate exited the pore (see movies Sim19.mpg and Sim20.mpg). Figure 9a shows the location of the precipitate for +1 V (blue line) and −1 V (red line) biases. As can be seen, the direction of the translocation is determined by the voltage sign. This is because after reprotonation there is an excess of Ca2+ ions inside the nanopore; these Ca2+ ions attach themselves to the precipitate, changing its charge from a low negative value to a high positive one. For a positive charge, the direction of the electrostatic force is upwards for +1 V bias and downwards for −1 V bias. Figure 9b shows the charge/mass ratio of the precipitate for simulations 19 (blue) and 20 (red). For comparison, the charge/mass ratio for K+ and are +25.6 and −10.3 e kDa−1, respectively.
Figure 9.
Total reprotonation. Plots depict the Z-coordinate of the precipitate’s center of mass (a) and its charge/mass ratio (b) for simulations 19 (blue) and 20 (red). The snapshots on the left side show: starting conformation for simulations 19 and 20 (i), and final frames for simulations 19 (ii) and 20 (iii). Reprotonated carboxyl groups are pictured as cyan lines. The black horizontal lines in panels (a), (i), (ii) and (iii) are guidelines to locate the top and bottom pore openings. Movies are provided in Supporting Information.
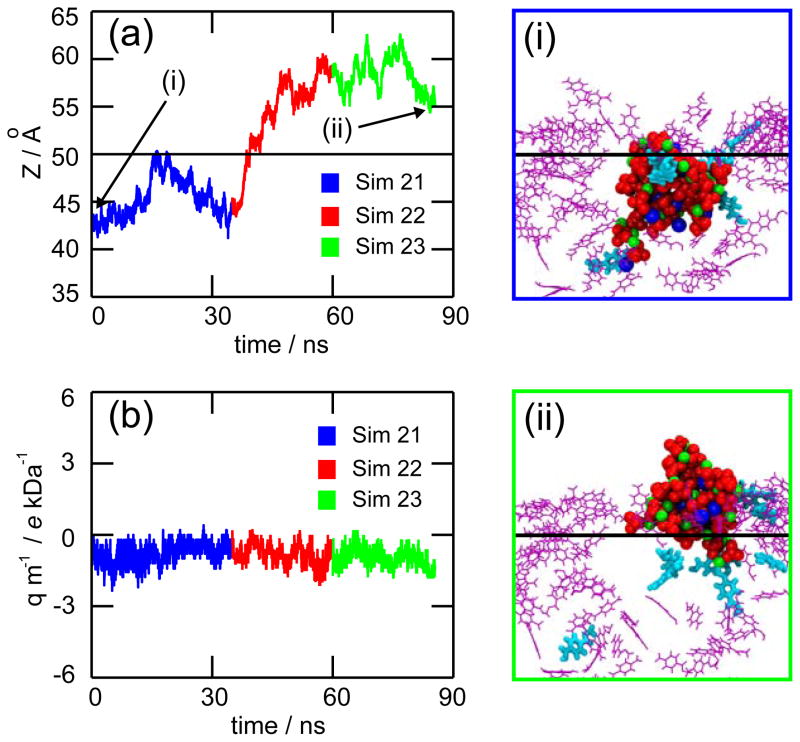
For the gradual reprotonation approach, we performed three consecutive MD simulations (Sim 21–23). In this case, we observed a partial translocation of the precipitate (see movie Sim212223.mpg). Figure 10a shows the position of the precipitate for simulations 21 (blue), 22 (red), and 23 (green). In simulation 21, the precipitate was released from the surface, but did not leave the pore. Figure 10i shows the starting conformation for simulation 21, the six PET residues shown in cyan licorice representation have their carboxyl groups reprotonated. Three of those six carboxyl groups were bound to the precipitate, as it was revealed by SMD simulations (see Figures 8d–e). The other three carboxyl groups did not bind directly, but were located within 1 nm from the precipitate. At the end of simulation 21, the precipitate attached to another deprotonated carboxyl group. Simulation 22 started from the last frame of simulation 21, but the carboxyl group binding the precipitate was reprotonated. The precipitate detached from the surface and moved upwards into the upper solvent compartment (Figure 10a - red curve), but it was caught by two carboxyl groups before complete exit. In simulation 23, the two attaching carboxyl groups were reprotonated. Once more, the precipitate was released from the surface, but did not moved further and remained in about the same position. Figure 10ii shows the final frame for simulation 23, the nine protonated carboxyl groups being highlighted. Figure 10b shows the precipitate’s charge/mass ratio for simulations 21, 22, and 23. The values registered are negative and small, i.e., the effect of the voltage sign on the direction of translocation is minimal. The overall upwards displacement was caused by collisions with K+ ions, that pushed the precipitate while exiting the pore through the top pore opening.
Figure 10.
Gradual reprotonation. On the left side, plots depict the position of the precipitate’s center of mass (a) and its charge/mass ratio (b) for simulations 21 (blue), 22 (cyan), and 23 (yellow). On the right side, snapshots show the first frame of simulation 21 (i) and the last frame of simulation 23 (ii). Deprotonated PET residues are pictured as purple lines. Reprotonated PET residues are shown in cyan licorice representation. The black horizontal lines in panels (a), (i) and (ii) indicate the location of the top pore opening. A movie is provided in Supporting Information.
The reprotonation simulations described above provide evidence that protonation of carboxyl groups is a likely scenario for the removal of the precipitate. Once the precipitate is out of the pore, the ionic current should resume the high conductance state.
Conclusions
In this article, we studied calcium phosphate precipitation in PET nanopores using all-atom MD simulations. We presented a total of 1.24 μs of MD simulations, 0.4 μs to study precipitation in bulk solution and 0.84 μs to study precipitation in PET nanopores. Overall, our results revealed a dynamic interplay between nanopore surface and translocating ions. Key players are the PET carboxyl groups exposed at the nanopore surface. When deprotonated, carboxyl groups retain Ca2+ ions and act as nucleation centers for precipitation. The precipitate grows around carboxyl groups, blocking the pore entrance and decreasing the flow of ions through the pore. Previously, it was assumed that the precipitate would dissolved inside the nanopore. We propose here an alternative mechanism, where the entire precipitate exits the pore after being released from the nanopore surface. Our MD simulations showed that the precipitate remains strongly attached to carboxyl groups. However, by reprotonation of the PET carboxyl groups exposed in the nanopore, the precipitate can detach from the PET surface and diffuse out of the pore, leaving the pore open and restoring ion flow. The proposed reprotonation mechanism can explain the resumption of the high-conductance state. However, there are still several features of the oscillations that need to be investigated: the asymmetric shape of the oscillations, the varying frequencies for different ionic species, and the precipitation threshold for negative voltages.19 The reprotonation of carboxyl groups may be part of a more complex mechanism behind nanoprecipitation oscillations.
Methods
Atomic Models
The PET force field parameters27 are based on the CHARMM force field;31 therefore it is compatible with MD models for water and ions used in biomolecular simulations. K+, Cl−, and Ca2+ parameters were taken from the CHARMM force field. parameters were taken from Yang et al.;32 parameters were obtained by homology using model compounds in the CHARMM force field and are included in Supporting Information; the TIP3P model33 was used for water.
Systems composed of water and ions without PET nanopore (Sim 1–8) comprise in our simulations about 16000 atoms; systems composed of PET nanopore, water and ions (Sim 9–23) comprise about 226000 atoms. The systems were build as follows: for simulations 1–8 (Table 1), ions were randomly distributed within a water box of 5.5 nm×5.5 nm×5.0 nm; for simulations 9–14 (Table 2), we used a previously reported conical PET nanopore structure.27 The simulated nanopore system is periodic in the X- and Y- directions, has 10.7×8.4 nm2 of horizontal area, 10 nm length, 1 nm radius at the bottom pore opening, 1.6 nm radius at the top pore opening, and a surface charge density of −1 e nm2. The final systems, containing nanopore, water and ions, have elementary cells of dimension 10.7 nm×8.4 nm×26.5 nm. For simulations 15–18 (Table 3), the starting structures were taken from the last frame of simulation 11. For simulations 19–23, the starting structures are listed in Table 4; to keep electroneutrality, for each reprotonated carboxyl group, a Cl− ion was added into the solvent compartment.
MD Protocols
MD simulations were carried out using the program NAMD 2.7.34 All MD simulations were performed under periodic boundary conditions, using 1 fs time step and particle-mesh Ewald electrostatics with a grid density of 1/Å3. Van der Waals interactions were calculated using a cutoff of 12 Å with a switching function starting at 10 Å. The temperature was maintained at 300 K using a Langevin thermostat. For MD simulations performed in the NpT ensemble, a hybrid Nosé-Hoover Langevin piston was used to maintain the pressure at 1 atm.
The systems were equilibrated as follows: Systems composed of water and ions without PET nanopore (Sim 1–8) were minimized for 1000 steps and then equilibrated for 1 ns in the NpT ensemble. Systems composed of PET nanopore, water and ions (Sim 9–23) were minimized for 2000 steps, and then equilibrated in the NpT ensemble for 0.2 ns with the PET structure constrained, and for 1 ns without any constraints; after that, the systems were equilibrated in the NVT ensemble for 1 ns. The last frames of the MD equilibrations were used as starting structures for further simulations, which were performed under NVT conditions. Simulation times are presented in the last columns of Tables 1–4.
For simulations containing PET nanopores (Sim 9–23), voltage biases were applied along the Z-direction. A positive voltage induces cations to move from the lower solvent compartment to the upper one. To prevent the PET nanopore from moving, the benzene carbons located in a toroidal volume of 4 nm height and 3 nm away from the pore axis were restrained using harmonic forces with a spring constant of 1 kcal mol−1 Å−2.
For simulations 16–18, steered molecular dynamics (SMD) was carried out to accelerate the translocation of the precipitate. In simulations 16 and 17, constant velocity SMD35 was applied on different phosphate ions (see Table 3), using a spring constant of 3 Kcal/mol/Å2. The pulling velocities for simulations 16 and 17 were 0.010 Å/ps and 0.025 Å/ps, respectively. In simulation 18, grid-SMD29 was applied to all Ca2+ and ions.
The grid was taken from a previously reported averaged electrostatic potential calculation involving the last 10 ns of a 20-ns MD simulation27 of a PET nanopore immersed in 1 M KCl and under +1 V bias. The steering forces derived from the grid were scaled up by a factor of 3, only the Z-components of the forces being applied.
Analysis
The analysis was performed using VMD36 and MatLab37 scripts. Snapshots of the MD simulations were made with VMD. For the MSD plots (Figure 2); first, the MD trajectories were unwrapped using the VMD plugin pbctools; then, the MSD was computed using:
where MSD(t) is the MSD at time t, N is the number of phosphorus (P) atoms, and ri(t) and ri(0) are the positions of Pi at times t and 0, respectively. The g(r) profiles (Figure 3) were computed using the VMD command measure gofr.
To identify individual precipitates (Figures 4–6), we performed a nearest-neighbor search for each simulation frame. First, a P atom, denoted as Pi, is added to a list, the so-called cluster list. Second, a distance search is performed around Pi and new atoms are added to the cluster list. Taking Pi as a center, we search for P, Ca2+ and K+ within distances dP–P (6 Å), dP–Ca (4 Å), and dP–K (4 Å), respectively. The cutoff distances dP–P, dP–Ca, and dP–K were obtained from the g(r) profiles (Figure 3) and locate the first shell of atoms around Pi. Third, distance searches are performed over all new elements in the cluster list. For new P atoms, we search for P, Ca2+ and K+ within distances dP–P, dP–Ca, and dP–K, respectively. For new Ca2+ and K+, we search for P atoms within distances dP–Ca and dP–K, respectively. Fourth, repeated elements are removed from the cluster list. The third and fourth steps are iteratively repeated for all new elements, until the cluster size become constant. The final cluster list contains the components of an individual precipitate; its mass and charge are calculated taking into account the hydrogens of the phosphate ions. The entire procedure is repeated for the remaining P atoms. Due to random collisions, transient aggregates containing only 2 or 3 P atoms can be formed. To avoid counting such insignificant aggregates, clusters containing less than 4 P atoms were discarded.
Supplementary Material
Acknowledgments
We thank the members of the Theoretical and Computational Biophysics Group for helpful discussions. We also thank T. Ritz and Z. Siwy for past discussions about the nanoprecipitation phenomena, and A. Aksimentiev for providing many insightful comments. This work is supported by grants from NIH (P41-RR005969) and NSF (CBET-0708459, PHY0822613). We acknowledge supercomputer time provided by Pittsburgh Supercomputing Center and the National Center for Supercomputing Applications via Large Resources Allocation Committee grant MCA93S028 and the Turing Xserve Cluster.
Footnotes
model, Ca2+ saturation procedure, water accessibility for PET carboxyl groups and movies for simulations 3, 7, 10–14, 19–23 are provided. This material is available free of charge via the Internet at http://pubs.acs.org.
References
- 1.Ho C, Qiao R, Heng JB, Chatterjee A, Timp RJ, Aluru NR, Timp G. Electrolytic Transport through a Synthetic Nanometer-Diameter Pore. Proc Natl Acad Sci US A. 2005;102:10445–10450. doi: 10.1073/pnas.0500796102. [DOI] [PMC free article] [PubMed] [Google Scholar]
- 2.Storm AJ, Chen JH, Ling XS, Zandbergen HW, Dekker C. Fabrication of Solid-State Nanopores with Single-Nanometre Precision. Nat Mater. 2003;2:537–540. doi: 10.1038/nmat941. [DOI] [PubMed] [Google Scholar]
- 3.Vlassiouk I, Apel PY, Dmitriev SN, Healy K, Siwy ZS. Versatile Ultrathin Nanoporous Silicon Nitride Membranes. Proc Natl Acad Sci US A. 2009;106:21039–21044. doi: 10.1073/pnas.0911450106. [DOI] [PMC free article] [PubMed] [Google Scholar]
- 4.Venkatesan BM, Dorvel B, Yemenicioglu S, Watkins N, Petrov I, Bashir R. Highly Sensitive, Mechanically Stable Nanopore Sensors for DNA Analysis. Adv Mater. 2009;21:2771–2776. doi: 10.1002/adma.200803786. [DOI] [PMC free article] [PubMed] [Google Scholar]
- 5.Venkatesan BM, Shah AB, Zuo J, Bashir R. DNA Sensing Using Nanocrystalline Surface-Enhanced Al2O3 Nanopore Sensors. Adv Funct Mater. 2010;20:1266–1275. doi: 10.1002/adfm.200902128. [DOI] [PMC free article] [PubMed] [Google Scholar]
- 6.Apel PY, Korchev YE, Siwy Z, Spohr R, Yoshida M. Diode-Like Single-Ion Track Membrane Prepared by Electro-Stopping. Nucl Instrum Methods Phys Res Sect B. 2001;184:337–346. [Google Scholar]
- 7.Siwy ZS. Ion-Current Rectification in Nanopores and Nanotubes with Broken Symmetry. Adv Funct Mater. 2006;16:735–746. [Google Scholar]
- 8.Dekker C. Solid-State Nanopores. Nat Nanotechnol. 2007;2:209–215. doi: 10.1038/nnano.2007.27. [DOI] [PubMed] [Google Scholar]
- 9.Heng JB, Ho C, Kim T, Timp R, Aksimentiev A, Grinkova YV, Sligar S, Schulten K, Timp G. Sizing DNA Using a Nanometer-Diameter Pore. Biophys J. 2004;87:2905–2911. doi: 10.1529/biophysj.104.041814. [DOI] [PMC free article] [PubMed] [Google Scholar]
- 10.Heng JB, Aksimentiev A, Ho C, Marks P, Grinkova YV, Sligar S, Schulten K, Timp G. The Electromechanics of DNA in a Synthetic Nanopore. Biophys J. 2006;90:1098–1106. doi: 10.1529/biophysj.105.070672. [DOI] [PMC free article] [PubMed] [Google Scholar]
- 11.Zhao Q, Comer J, Dimitrov V, Yemenicioglu S, Aksimentiev A, Timp G. Stretching and Unzipping Nucleic Acid Hairpins Using a Synthetic Nanopore. Nucleic Acids Res. 2008;36:1532–1541. doi: 10.1093/nar/gkm1017. [DOI] [PMC free article] [PubMed] [Google Scholar]
- 12.Mirsaidov U, Timp W, Zou X, Dimitrov V, Schulten K, Feinberg AP, Timp G. Nanoelec-tromechanics of Methylated DNA in a Synthetic Nanopore. Biophys J. 2009;96:L32–L34. doi: 10.1016/j.bpj.2008.12.3760. [DOI] [PMC free article] [PubMed] [Google Scholar]
- 13.Hall AR, van Dorp S, Lemay SG, Dekker C. Electrophoretic Force on a Protein-Coated DNA Molecule in a Solid-State Nanopore. Nano Lett. 2009;9:4441–4445. doi: 10.1021/nl9027318. [DOI] [PubMed] [Google Scholar]
- 14.Zhao Q, Sigalov G, Dimitrov V, Dorvel B, Mirsaidov U, Sligar S, Aksimentiev A, Timp G. Detecting SNPs Using a Synthetic Nanopore. Nano Lett. 2007;7:1680–1685. doi: 10.1021/nl070668c. [DOI] [PMC free article] [PubMed] [Google Scholar]
- 15.Karnik R, Duan C, Castelino K, Daiguji H, Majumdar A. Rectification of Ionic Current In a Nanofluidic Diode. Nano Lett. 2007;7:547–551. doi: 10.1021/nl062806o. [DOI] [PubMed] [Google Scholar]
- 16.Vlassiouk I, Siwy ZS. Nanofluidic Diode. Nano Lett. 2007;7:552–556. doi: 10.1021/nl062924b. [DOI] [PubMed] [Google Scholar]
- 17.Jovanovic-Talisman T, Tetenbaum-Novatt J, McKenney AS, Zilman A, Peters R, Rout MP, Chait BT. Artificial Nanopores that Mimic the Transport Selectivity of the Nuclear Pore Complex. Nature. 2009;457:1023–1027. doi: 10.1038/nature07600. [DOI] [PMC free article] [PubMed] [Google Scholar]
- 18.Xia F, Guo W, Mao Y, Hou X, Xue J, Xia H, Wang L, Song Y, Ji H, Ouyang Q, et al. Gating of Single Synthetic Nanopores by Proton-Driven DNA Molecular Motors. J Am Chem Soc. 2008;130:8345–8350. doi: 10.1021/ja800266p. [DOI] [PubMed] [Google Scholar]
- 19.Powell MR, Sullivan M, Vlassiouk I, Constantin D, Sudre O, Martens CC, Eisenberg RS, Siwy ZS. Nanoprecipitation-Assisted Ion Current Oscillations. Nat Nanotechnol. 2008;3:51–57. doi: 10.1038/nnano.2007.420. [DOI] [PubMed] [Google Scholar]
- 20.Aksimentiev A, Heng JB, Timp G, Schulten K. Microscopic Kinetics of DNA Translocation through Synthetic Nanopores. Biophys J. 2004;87:2086–2097. doi: 10.1529/biophysj.104.042960. [DOI] [PMC free article] [PubMed] [Google Scholar]
- 21.Heng JB, Aksimentiev A, Ho C, Marks P, Grinkova YV, Sligar S, Schulten K, Timp G. Stretching DNA Using the Electric Field in a Synthetic Nanopore. Nano Lett. 2005;5:1883–1888. doi: 10.1021/nl0510816. [DOI] [PMC free article] [PubMed] [Google Scholar]
- 22.Cruz-Chu ER, Aksimentiev A, Schulten K. Ionic Current Rectification through Silica Nanopores. J Phys Chem C. 2009;113:1850–1862. doi: 10.1021/jp804724p. [DOI] [PMC free article] [PubMed] [Google Scholar]
- 23.Aksimentiev A, Brunner R, Cruz-Chu E, Comer J, Schulten K. Modeling Transport through Synthetic Nanopores. IEEE Nanotech Magazine. 2009;3:20–28. doi: 10.1109/MNANO.2008.931112. [DOI] [PMC free article] [PubMed] [Google Scholar]
- 24.Siwy ZS, Powell MR, Kalman E, Astumian RD, Eisenberg RS. Negative Incremental Resistance Induced by Calcium in Asymmetric Nanopores. Nano Lett. 2006;6:473–477. doi: 10.1021/nl0524290. [DOI] [PubMed] [Google Scholar]
- 25.Siwy ZS, Powell MR, Petrov A, Kalman E, Trautmann C, Eisenberg RS. Calcium-Induced Voltage Gating in Single Conical Nanopores. Nano Lett. 2006;6:1729–1734. doi: 10.1021/nl061114x. [DOI] [PubMed] [Google Scholar]
- 26.Sutter JR, McDowell H, Brown WE. Solubility Study of Calcium Hydrogen Phosphate. Ion-Pair Formation. Inorg Chem. 1971;10:1638–1643. [Google Scholar]
- 27.Cruz-Chu ER, Ritz T, Siwy ZS, Schulten K. Molecular Control of Ionic Conduction in Polymer Nanopores. Faraday Discuss. 2009;143:47–62. doi: 10.1039/b906279n. [DOI] [PMC free article] [PubMed] [Google Scholar]
- 28.Mathé J, Aksimentiev A, Nelson DR, Schulten K, Meller A. Orientation Discrimination of Single-Stranded DNA Inside the α-Hemolysin Membrane Channel. Proc Natl Acad Sci US A. 2005;102:12377–12382. doi: 10.1073/pnas.0502947102. [DOI] [PMC free article] [PubMed] [Google Scholar]
- 29.Wells DB, Abramkina V, Aksimentiev A. Exploring Transmembrane Transport through α-Hemolysin with Grid-Steered Molecular Dynamics. J Chem Phys. 2007;127:125101–01–125101–10. doi: 10.1063/1.2770738. [DOI] [PMC free article] [PubMed] [Google Scholar]
- 30.Zahn D. Mechanisms of Calcium and Phosphate Ion Association in Aqueous Solution. Z Anorg Allg Chem. 2004;630:1507–1511. [Google Scholar]
- 31.MacKerell AD, Jr, Bashford D, Bellott M, Dunbrack RL, Jr, Evanseck JD, Field MJ, Fischer S, Gao J, Guo H, Ha S, et al. Dynamics Studies of Proteins. J Phys Chem B. 1998;102:3586–3616. doi: 10.1021/jp973084f. [DOI] [PubMed] [Google Scholar]
- 32.Yang W, Gao YQ, Cui Q, Ma J, Karplus M. The Missing Link Between Thermodynamics and Structure in F1-ATPase. Proc Natl Acad Sci US A. 2003;100:874–879. doi: 10.1073/pnas.0337432100. [DOI] [PMC free article] [PubMed] [Google Scholar]
- 33.Jorgensen WL, Chandrasekhar J, Madura JD, Impey RW, Klein ML. Comparison of Simple Potential Functions for Simulating Liquid Water. J Chem Phys. 1983;79:926–935. [Google Scholar]
- 34.Phillips JC, Braun R, Wang W, Gumbart J, Tajkhorshid E, Villa E, Chipot C, Skeel RD, Kále L, Schulten K. Scalable Molecular Dynamics with NAMD. J Comput Chem. 2005;26:1781–1802. doi: 10.1002/jcc.20289. [DOI] [PMC free article] [PubMed] [Google Scholar]
- 35.Sotomayor M, Schulten K. Single-Molecule Experiments in Vitro and in Silico. Science. 2007;316:1144–1148. doi: 10.1126/science.1137591. [DOI] [PubMed] [Google Scholar]
- 36.Humphrey W, Dalke A, Schulten K. VMD: Visual Molecular Dynamics. J Mol Graphics. 1996;14:33–38. doi: 10.1016/0263-7855(96)00018-5. [DOI] [PubMed] [Google Scholar]
- 37.MatLab v.6. The MathWorks, Inc; Natick, Massachusetts: 2002. [Google Scholar]
Associated Data
This section collects any data citations, data availability statements, or supplementary materials included in this article.


