Abstract
We propose a multilocus version of FST and a measure of haplotype diversity using localized haplotype clusters. Specifically, we use haplotype clusters identified with BEAGLE, which is a program implementing a hidden Markov model for localized haplotype clustering and performing several functions including inference of haplotype phase. We apply this methodology to HapMap phase 3 data. With this haplotype-cluster approach, African populations have highest diversity and lowest divergence from the ancestral population, East Asian populations have lowest diversity and highest divergence, and other populations (European, Indian, and Mexican) have intermediate levels of diversity and divergence. These relationships accord with expectation based on other studies and accepted models of human history. In contrast, the population-specific FST estimates obtained directly from single-nucleotide polymorphisms (SNPs) do not reflect such expected relationships. We show that ascertainment bias of SNPs has less impact on the proposed haplotype-cluster-based FST than on the SNP-based version, which provides a potential explanation for these results. Thus, these new measures of FST and haplotype-cluster diversity provide an important new tool for population genetic analysis of high-density SNP data.
GENOME-WIDE data sets from worldwide panels of individuals provide an outstanding opportunity to investigate the genetic structure of human populations (Conrad et al. 2006; International Hapmap Consortium 2007; Jakobsson et al. 2008; Auton et al. 2009). Populations around the globe form a continuum rather than discrete units (Serre and Paabo 2004; Weiss and Long 2009). However, notions of discrete populations can be appropriate when, for example, ancestral populations were separated by geographic distance or barriers such that little gene flow occurred.
FST (Wright 1951; Weir and Cockerham 1984; Holsinger and Weir 2009) is a measure of population divergence. It measures variation between populations vs. within populations. One can calculate a global measure, assuming that all populations are equally diverged from an ancestral population, or one can calculate FST for specific populations or for pairs of populations while utilizing data from all populations (Weir and Hill 2002). One use of FST is to test for signatures of selection (reviewed in Oleksyk et al. 2010).
FST may be calculated for single genetic markers. For multiallelic markers, such as microsatellites, this is useful, but single-nucleotide polymorphisms (SNPs) contain much less information when taken one at a time, and thus it is advantageous to calculate averages over windows of markers (Weir et al. 2005) or even over the whole genome. The advantage of windowed FST is that it can be used to find regions of the genome that show different patterns of divergence, indicative of selective forces at work during human history.
Another measure of human evolutionary history is haplotype diversity. Haplotype diversity may be measured using a count of the number of observed haplotypes in a region or by the expected haplotype heterozygosity based on haplotype frequencies in a region. Application of this regional measure to chromosomal data can be achieved by a haplotype block strategy (Patil et al. 2001) or by windowing (Conrad et al. 2006; Auton et al. 2009).
One problem with the analysis of population structure based on genome-wide panels of SNPs is that a large proportion of the SNPs were ascertained in Caucasians, potentially biasing the results of the analyses. Analysis based on haplotypes is less susceptible to such bias (Conrad et al. 2006). This is because haplotypes can be represented by multiple patterns of SNPs; thus lack of ascertainment of a particular SNP does not usually prevent observation of the haplotype. On a chromosome-wide scale, one cannot directly use entire haplotypes, because all the haplotypes in the sample will almost certainly be unique, thus providing no information on population structure. Instead one can use haplotypes on a local basis, either by using windows of adjacent markers or by using localized haplotype clusters, for example those obtained from fastPHASE (Scheet and Stephens 2006) or BEAGLE (Browning 2006; Browning and Browning 2007a).
Localized haplotype clusters are a clustering of haplotypes on a localized basis. At the position of each genetic marker, haplotypes are clustered according to their similarity in the vicinity of the position. Both fastPHASE and BEAGLE use hidden Markov modeling to perform the clustering, although the specific models used by the two programs differ.
Localized haplotype clusters derived from fastPHASE have been used to investigate haplotype diversity, to create neighbor-joining trees of populations, and to create multidimensional scaling (MDS) plots (Jakobsson et al. 2008). It was found that haplotype clusters showed different patterns of diversity to SNPs, while the neighbor-joining and MDS plots were similar between haplotype clusters and SNPs.
In this work, we apply windowed FST methods to localized haplotype clusters derived from the BEAGLE program (Browning and Browning 2007a,b, 2009). We consider population-average, population-specific, and pairwise FST estimates (Weir and Hill 2002). Population-average FST's either assume that all the populations are equally diverged from a common ancestor, which is not realistic, or represent the average of a set of population-specific values. This can be convenient in that the results are summarized by a single statistic; however, information is lost. A common procedure is to calculate FST for each pair of populations, and these values reflect the degree of divergence between the two populations. Different levels of divergence are allowed for each pair of populations but each estimate uses data from only that pair of populations. On the other hand, population-specific FST's allow unequal levels of divergence in a single analysis that makes use of all the data.
We compare results from the localized haplotype clusters to those using SNPs directly. The results of applying localized haplotype clusters to population-specific FST estimation are very striking, showing better separation of populations and a more realistic pattern of divergence than for population-specific FST estimation using SNPs directly. We also use BEAGLE's haplotype clusters in a haplotype diversity measure and investigate the relationship between this measure of haplotype-cluster diversity and the recombination rate.
METHODS
Data:
We analyzed data from phase 3 of the International HapMap Project (International Hapmap Consortium 2005, 2007). As the full analysis of these data had not been published at the time this study was performed, we restricted our attention to chromosome 22 and to two regions of interest: the lactase gene (LCT) and the 8p23 inversion (Antonacci et al. 2009). Samples from 11 populations are represented in the HapMap3 data; population labels and descriptions are given in Table 1.
TABLE 1.
HapMap3 population descriptions and chromosome 22 average values of population-specific haplotype-cluster FST and haplotype-cluster diversity
| Label | Population | Average haplotype-cluster FST | Average haplotype-cluster diversity |
|---|---|---|---|
| JPT | Japanese in Tokyo | 0.179 | 4.9 |
| CHD | Chinese in Denver | 0.177 | 5.1 |
| CHB | Han Chinese in Beijing | 0.175 | 5.1 |
| CEU | Utah residents (CEPH) with northern and western European ancestry | 0.116 | 5.5 |
| MEX | Mexican ancestry in Los Angeles | 0.110 | 5.4 |
| TSI | Toscans in Italy | 0.108 | 5.4 |
| YRI | Yoruba in Ibadan, Nigeria | 0.100 | 5.9 |
| GIH | Gujarati Indians in Houston | 0.097 | 5.4 |
| LWK | Luhya in Webuye, Kenya | 0.079 | 6.1 |
| MKK | Maasai in Kinyawa, Kenya | 0.047 | 6.3 |
| ASW | African ancestry in southwest United States | 0.030 | 6.1 |
Populations are ordered by their average population-specific haplotype-cluster FST values (highest to lowest).
We downloaded chromosomes 2, 8, and 22 of the draft 2 phase 3 HapMap in nonredundant HapMap format from www.hapmap.org in January 2009. We used only those SNPs that were genotyped in all populations (13,875 SNPs on chromosome 22). In any trio or parent–offspring pair with Mendelian inconsistency at a SNP, we set as missing all the genotypes for all individuals in the trio or pair for that marker. Genetic (centimorgan) positions were also obtained from phase II HapMap (International Hapmap Consortium 2007).
Imputation of missing genotypes and haplotype phase:
We used BEAGLE version 3.0 (Browning and Browning 2007b, 2009) to impute missing genotypes and estimate haplotype phase. For related individuals (mother–father–child trios or parent–offspring pairs), we used the pedigree information to increase the accuracy of the imputation/phasing (Browning and Browning 2009). All individuals were combined in the imputation and phasing analysis. This had two purposes. First, BEAGLE performs better with a larger sample size, although its performance in simultaneous analysis of individuals from multiple populations has not been examined in detail. Second, if the imputation and haplotype phase inference were performed separately for each population, this could bias the inferred results to further separate the populations, potentially leading to inference of differences between populations when none exist. In contrast, when all populations are analyzed simultaneously, the bias is toward the average of all populations, which is of less serious consequence. See, for example, Balding (2006) for a brief discussion of separate vs. combined phasing of cases and controls in case–control studies. On the other hand, pooling of populations for phasing could be problematic in that patterns of linkage disequilibrium (LD) differ substantially between populations, and the pooled population would not be in Hardy–Weinberg equilibrium. Thus, we also performed supplementary analyses in which each population was phased separately using BEAGLE. It will be seen that phasing the data together or separately does not have any notable effect on the results. After haplotyping, parent–offspring trios were reduced to the four parental haplotypes, parent–offspring pairs were reduced to three haplotypes (the child's two haplotypes plus the parent's nontransmitted haplotype), and unrelated individuals each contributed two haplotypes.
Haplotype clusters:
Beginning with phased haplotypes with no missing data, obtained using the methods described above, we built a localized haplotype cluster model (Browning 2006) using BEAGLE version 3.0. We do not dwell on the construction of the cluster model here; details can be found in previous work (Browning and Browning 2007a). We used the default option that gives the version of the model that we have used for multilocus association testing (Browning and Browning 2007a).
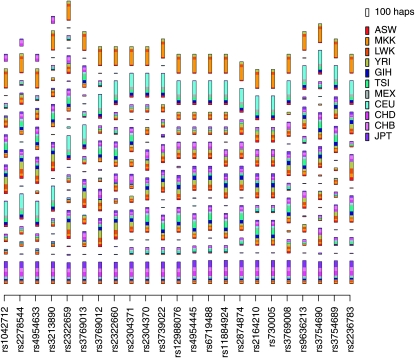
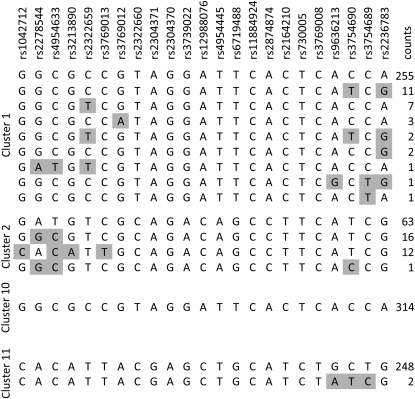
After fitting the localized haplotype cluster model, as described above, each haplotype is a member of one “localized haplotype cluster” state (Browning 2006; Browning and Browning 2007a) at each marker position. Figure 1 depicts the clusters obtained for the LCT gene. Note that the haplotypes are clustered at each marker position. Figure 2 shows the specific haplotypes contained in four of the clusters. Each haplotype within a haplotype cluster with marker position at SNP x has the same allele at SNP x; however, two haplotypes within the cluster may have differing alleles at other SNPs. In general, haplotypes within the same cluster will tend to have the same allele at SNPs near the marker position of the cluster. For example, in Figure 2, SNP 12 (rs12988076) is the SNP defining the cluster location, and all haplotypes within a cluster share the same allele at this SNP. Moreover, SNPs around SNP 12 also tend to be shared within each cluster. In cluster 1 we see that SNPs 8–19 are identical for all haplotypes, while some differences are seen at SNPs that are farther away.
Figure 1.—
Plot of haplotype clusters in the LCT gene for HapMap3 data. At every SNP the plot shows a series of rectangles, each representing a haplotype cluster, with lengths proportional to the number of haplotypes represented. The top rectangle in the key to the right of the plot shows the size of the rectangle that corresponds to 100 haplotypes. Within each rectangle, the length of each colored block is proportional to the number of haplotypes from the population with that color code. The colored rectangles in the key give the population labels. Population descriptions corresponding to the labels can be found in Table 1. The haplotype cluster model was built using a larger set of SNPs extending to either side of the gene, but only SNPs within the gene are shown. Supplementary Figure S1 gives a version of this figure with transition lines added.
Figure 2.—
Haplotype clusters in the LCT gene. Four haplotype clusters from the LCT gene are shown. These clusters correspond to haplotype clusters from Figure 1 and are all located at rs12988076 (the central SNP of the 23 SNPs shown). Cluster numbering is from the bottom of the graph in Figure 1 to the top, so cluster 1 is the bottom-most cluster, cluster 2 is the cluster above that, cluster 11 is the topmost cluster, and cluster 10 is the cluster one down from the top. Each 23-SNP haplotype seen within the four clusters is shown, along with a count of the number of times that it was seen. Within each cluster, variants differing between the majority haplotype and other observed haplotypes are shaded gray.
FST estimation:
We estimated population-average FST using the method of Weir and Cockerham (1984), as follows. Let r be the number of populations sampled, and let ni be the number of haplotypes in the sample from population i (note that in our data all missing data are imputed, so there is no dependence of this value on genetic marker l). For genetic marker l, let  be the number of copies of allele j in individuals sampled from population i, and let
  be the sample allele frequency of allele j in population i. Similarly, for haplotype clusters, at the position corresponding to genetic marker l, let
  be the number of sampled haplotypes from population i that are in haplotype cluster j, and let
  be the sample frequency of haplotype cluster j in population i.
We define the adjusted population sample size
 |
which has adjusted average
 |
We also obtain the weighted average frequency for each allele or haplotype cluster,
 |
We form mean squares among (MSA) and within (MSW) populations
 |
 |
The population-average FST is estimated by
 |
where the sums are over loci and alleles or haplotype clusters within the current window.
For SNP-based analysis, windows are defined by the chromosomal positions of the SNPs. For haplotype clusters, each haplotype cluster has a corresponding marker (SNP), the chromosomal position of which we use as the position of the haplotype cluster.
We calculated paired FST for a pair of populations by considering only the samples from the two populations and applying the population-average FST estimator  given above.
We calculated population-specific FST using the method of Weir and Hill (2002). Following the notation above, the estimated population-specific FST for population i is
 |
When calculating FST estimates for SNPs, we made use of the phased haplotype data rather than the raw genotype data. We did not utilize the phase information directly, but did make use of the imputed sporadic missing genotypes and the reduction to unrelated haplotypes from the trio and parent–offspring pair data.
RESULTS
Haplotype-cluster FST:
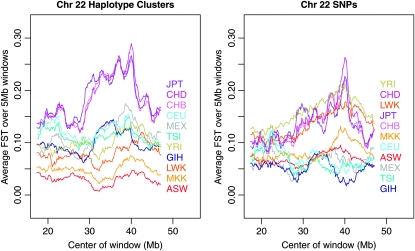
Figure 3 shows population-specific FST values for each HapMap3 population in sliding windows of 5 Mb along chromosome 22, while the third column of Table 1 shows the chromosome-averaged values of population-specific haplotype-cluster FST. The corresponding results for data phased separately by population are given in supporting information, Figure S2 and Table S1, but are virtually indistinguishable from the results for data phased together shown in Figure 3 and Table 1. The striking feature of the results is that the haplotype-cluster approach (Table 1 and left panel of Figure 3) separates the ethnicities into broad geographic origins, with Africans (Yoruba in Ibadan, Nigeria, YRI; Luhya in Webuye, Kenya, LWK; Maasai in Kinyawa, Kenya, MKK; and African ancestry in southwest United States, ASW) least diverged from the average or ancestral population; East Asians (Japanese in Tokyo, JPT; Chinese in Denver, CHD; and Han Chinese in Beijing, CHB) most diverged; and Europeans [Utah residents (CEPH) with northern and western European ancestry, CEU; Toscans in Italy, TSI], Mexicans (MEX), and Gujarati (GIH) intermediate, as we would expect from other studies of human genetic demography (Prugnolle et al. 2005). In contrast, the SNP-based estimates (right panel of Figure 3) are mixed together with no obvious meaningful pattern. The YRI, JPT/CHB, and CEU data from the right panel of Figure 3 have a similar pattern to the chromosome 22 panel of Figure 4 in Weir et al. (2005), which was based on HapMap phase I data. The East Asian populations show an increase in divergence ∼37–41 Mb. We are not aware of any known targets of selection in this region; however, a cluster of extreme integrated haplotype score (iHS) values was found at 38.0 Mb in HapMap phase I data (Voight et al. 2006).
Figure 3.—
Sliding 5-Mb windows of population-specific FST on chromosome 22 for HapMap3 data. Estimates of population-specific FST were calculated using localized haplotype clusters from BEAGLE (left) or directly from SNPs (right). Each plotted line represents one population, with the corresponding population label having the same color. Population labels are ordered by averages over the whole of chromosome 22. Population descriptions corresponding to the labels can be found in Table 1.
Figure 4.—
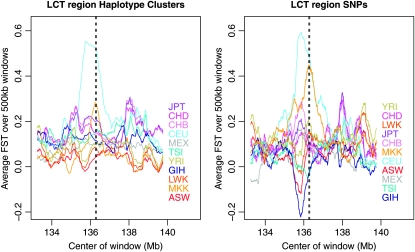
Population-specific FST estimates in the region of LCT for HapMap3 data. The location of LCT is shown with a pair of dashed lines. Haplotype-cluster-based estimates are shown on the left, while estimates based on SNPs are on the right. In both cases, the estimates are from 500-kb windows.
FST analysis of genetic markers can be affected by the marker ascertainment scheme. A high proportion of SNPs in the HapMap3 data were ascertained from Caucasian individuals. Thus, SNPs with very low minor allele frequency (MAF) in Caucasians, but high MAF in some other populations will be underrepresented. To investigate the effect that this type of ascertainment has on the FST estimates, we ran additional analyses in which we first removed all markers with MAF < 0.05 in the CHB HapMap3 sample data. On chromosome 22, this reduced the number of SNPs from 13,875 down to 12,480. We then recalculated the population-specific FST estimates, averaging over the whole of chromosome 22, and looked at the difference between these values and the original estimates. For the SNP-based results, the differences ranged from −0.021 to 0.049, with mean absolute difference (over the 11 populations) of 0.022. For the haplotype cluster results, the differences ranged from −0.012 to 0.021, with mean absolute difference of 0.009. Thus the haplotype cluster results were less changed by the added ascertainment than were the SNP-based results. Not surprisingly, for both the SNP-based and the haplotype cluster results, the African populations had the largest decreases in estimated FST resulting from the ascertainment, while the East Asian populations had the largest increases. Since the ascertainment was performed in an East Asian population (the CHB), it is biased toward SNPs that differ more between East Asians and other populations (those SNPs that have reached high frequency in East Asians but may not have reached high frequency in other populations), thus making East Asians look more different from other populations. Other populations lose some of their most differentiated SNPs in the ascertainment, particularly African populations that have the most low-frequency SNPs not shared by other populations, resulting in decreases in FST.
Variants in LCT conferring lactase persistence have been selected for in pastoralist populations, including northwestern Europeans (represented by the CEU) and Kenyans (represented by the MKK) (Swallow 2003; Tishkoff et al. 2007). The region around LCT has a signature of selection in CEU from HapMap phase I in population-specific FST analysis (Weir et al. 2005). Figure 4 shows population-specific FST analysis of the region surrounding this gene in the HapMap3 data. In both the SNP-based and the haplotype-cluster analyses, the CEU and MKK populations have increased within-population homogeneity (equivalently, increased divergence from the ancestral population) around the gene, indicating selection for a favored allele. Although the peak for MKK is less pronounced in the haplotype cluster analysis, it has better localization than in the SNP-based analysis. Figure 1 shows BEAGLE's localized haplotype clusters in this gene. It is clear that a large proportion of CEU individuals share one haplotype (cluster 10 in Figure 2), while a large proportion of MKK individuals share a different haplotype (cluster 11 in Figure 2). This is consistent with the results of a study by Tishkoff et al. (2007), which found that African and European lactase persistence arose independently on differing haplotypic backgrounds.
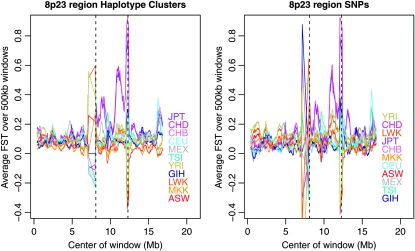
The 8p23 inversion covers the approximate region 8.1–12.3 Mb on chromosome 8 (Antonacci et al. 2009). An analysis of pairwise population FST estimates from HapMap2 data showed that East Asians (CHB and JPT) have a signature consistent with positive selection at this location. We also find this signal in the three HapMap3 East Asian populations (CHB, CHD, and JPT), as shown in Figure 5. As in Deng et al. (2008), we see this signal over the first and the last third of the region. Deng et al. conclude that the signal is likely the result of positive selection in East Asians in XKR6, located at 10.8–11.1 Mb.
Figure 5.—
Population-specific FST estimates in the region of the 8p23 inversion for HapMap3 data. The approximate breakpoints of the inversion are shown with dashed lines. Haplotype-cluster-based estimates are shown on the left, while estimates based on SNPs are on the right. In both cases, the estimates are from 500-kb windows.
We calculated paired FST estimates (see methods) for each pair of populations, averaged these over chromosome 22, and converted to distances using the formula  (Reynolds et al. 1983). Neighbor-joining trees (Saitou and Nei 1987) based on these distances are shown in Figure S3. Whereas Jakobsson et al. (2008) also constructed neighbor-joining trees based on haplotype clusters, their trees were constructed using allele-sharing distances rather than FST estimates.
Haplotype-cluster diversity:
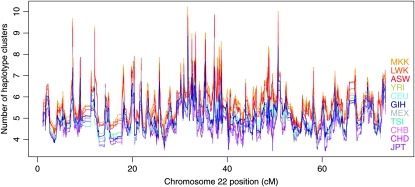
We calculated haplotype-cluster diversity, which we define to be the number of haplotype clusters at each location, in each population sample. Results for diversity by chromosomal location are shown in Figure 6, while chromosome-wide average diversity values are given in the right-hand column of Table 1. There is a clear ordering of populations, very similar to that seen with the haplotype-cluster-based FST, with African populations showing greatest diversity; East Asians showing least diversity; and Europeans, Mexicans, and Gujarati showing intermediate diversity.
Figure 6.—
Haplotype cluster diversity along chromosome 22 for sliding windows of 100 SNPs. Each plotted line represents one population, with the corresponding population label having the same color. Population labels are ordered by averages over the whole of chromosome 22 (see Table 1). Population descriptions corresponding to the labels can be found in Table 1.
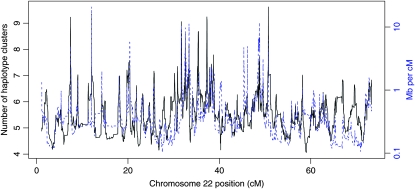
We calculated correlations between our measure of haplotype-cluster diversity, the inverse recombination rate [megabases per centimorgan; obtained from HapMap phase II estimates of genetic distance (International Hapmap Consortium 2007)], and SNP density (SNPs per kilobase) for sliding windows of 100 markers over chromosome 22. The sliding windows of diversity and inverse recombination rate have correlations between 0.45 and 0.60, depending on the population (lowest correlations for non-African populations, highest for the African populations). Figure 7 shows sliding windows of diversity and inverse recombination rate for the YRI sample (the correlation for YRI is 0.56). At positions with high recombination rate, LD is low and haplotype clusters represent small numbers of SNPs, resulting in fewer haplotype clusters and lower diversity. On the other hand, where recombination rate is low, LD is high and haplotype clusters represent large numbers of SNPs, which tends to result in more haplotype clusters and higher diversity. We also checked the correlation between diversity and the marker density. Although marker density (SNPs per kilobase) is highly correlated with recombination rate (centimorgans per megabase), with correlation 0.42, the correlation between diversity and marker density is low (range −0.004 to −0.16). Thus the number of genotyped SNPs in a region does not greatly affect haplotype-cluster diversity.
Figure 7.—
Haplotype-cluster diversity for YRI and inverse of recombination rate. Values are plotted along chromosome 22 for sliding windows of 100 SNPs. The solid black line and left y-axis show haplotype-cluster diversity; the dashed blue line and right y-axis show inverse of recombination rate.
We also investigated the use of haplotype-cluster data for visualizing individual ancestry via MDS plots. As in Jakobsson et al. (2008), we saw no obvious difference between the haplotype-cluster and standard SNP-based MDS plots (results not shown). This suggests that the use of haplotype clusters in analysis of population structure does not provide large amounts of new information not already evident in the SNP data. Rather, it seems that the use of haplotype clusters partially corrects for SNP ascertainment bias, which is important for analysis methods such as FST that assume an unbiased sample of genetic markers and are sensitive to violations of this assumption.
DISCUSSION
We have shown that haplotype-cluster FST has useful properties compared to SNP-based FST. Haplotype-cluster population-specific FST provides results that have better interpretability than results from the SNP-based version. We showed that haplotype-cluster FST is less influenced by SNP ascertainment than is SNP-based FST, which provides an explanation for the improved interpretability of the results from the haplotype-cluster-based estimator. In this work, we used haplotype clusters from BEAGLE in calculating the FST values. One could also use haplotype clusters from fastPHASE, which would likely give similar results. We did not apply fastPHASE to these data, as fastPHASE (version 1.2.3) takes unphased data from unrelated individuals and hence would not have been able to take full advantage of the HapMap3 data, which include parent–offspring pairs and trios.
The use of a haplotype-cluster-based approach avoids problems with appropriate choice of windowing when investigating properties of haplotypes (Jakobsson et al. 2008). We used haplotype clusters to measure haplotype diversity. Jakobsson et al. (2008) also used haplotype clusters to investigate diversity, but whereas they used a fixed number of clusters (from fastPHASE), we used BEAGLE's variable number of clusters. BEAGLE's variable-cluster approach has the advantage of greater flexibility for modeling regions of the chromosome with different LD patterns, compared to using a fixed number of clusters as in fastPHASE. Jakobsson et al. measured diversity by displaying sample population frequencies for each cluster and by looking for haplotype clusters that were not shared by all populations. In contrast, we measured diversity by counting numbers of observed haplotype clusters within each population sample. We found that our measure of haplotype-cluster diversity varies between populations in a manner that is consistent with the population histories and that our measure of haplotype-cluster diversity is strongly correlated with recombination rate.
Acknowledgments
The authors thank Brian Browning for helpful comments on a draft manuscript. This work was supported in part by National Institutes of Health grant GM075091.
Supporting information is available online at http://www.genetics.org/cgi/content/full/genetics.110.116681/DC1.
References
- Antonacci, F., J. M. Kidd, T. Marques-Bonet, M. Ventura, P. Siswara et al., 2009. Characterization of six human disease-associated inversion polymorphisms. Hum. Mol. Genet. 18 2555–2566. [DOI] [PMC free article] [PubMed] [Google Scholar]
- Auton, A., K. Bryc, A. R. Boyko, K. E. Lohmueller, J. Novembre et al., 2009. Global distribution of genomic diversity underscores rich complex history of continental human populations. Genome Res. 19 795–803. [DOI] [PMC free article] [PubMed] [Google Scholar]
- Balding, D. J., 2006. A tutorial on statistical methods for population association studies. Nat. Rev. Genet. 7 781–791. [DOI] [PubMed] [Google Scholar]
- Browning, B. L., and S. R. Browning, 2007. a Efficient multilocus association testing for whole genome association studies using localized haplotype clustering. Genet. Epidemiol. 31 365–375. [DOI] [PubMed] [Google Scholar]
- Browning, B. L., and S. R. Browning, 2009. A unified approach to genotype imputation and haplotype-phase inference for large data sets of trios and unrelated individuals. Am. J. Hum. Genet. 84 210–223. [DOI] [PMC free article] [PubMed] [Google Scholar]
- Browning, S. R., 2006. Multilocus association mapping using variable-length Markov chains. Am. J. Hum. Genet. 78 903–913. [DOI] [PMC free article] [PubMed] [Google Scholar]
- Browning, S. R., and B. L. Browning, 2007. b Rapid and accurate haplotype phasing and missing-data inference for whole-genome association studies by use of localized haplotype clustering. Am. J. Hum. Genet. 81 1084–1097. [DOI] [PMC free article] [PubMed] [Google Scholar]
- Conrad, D. F., M. Jakobsson, G. Coop, X. Wen, J. D. Wall et al., 2006. A worldwide survey of haplotype variation and linkage disequilibrium in the human genome. Nat. Genet. 38 1251–1260. [DOI] [PubMed] [Google Scholar]
- Deng, L., Y. Zhang, J. Kang, T. Liu, H. Zhao et al., 2008. An unusual haplotype structure on human chromosome 8p23 derived from the inversion polymorphism. Hum. Mutat. 29 1209–1216. [DOI] [PubMed] [Google Scholar]
- Holsinger, K. E., and B. S. Weir, 2009. Genetics in geographically structured populations: defining, estimating and interpreting FST. Nat. Rev. Genet. 10 639–650. [DOI] [PMC free article] [PubMed] [Google Scholar]
- International HapMap Consortium, 2005. A haplotype map of the human genome. Nature 437 1299–1320. [DOI] [PMC free article] [PubMed] [Google Scholar]
- International HapMap Consortium, 2007. A second generation human haplotype map of over 3.1 million SNPs. Nature 449 851–861. [DOI] [PMC free article] [PubMed] [Google Scholar]
- Jakobsson, M., S. W. Scholz, P. Scheet, J. R. Gibbs, J. M. VanLiere et al., 2008. Genotype, haplotype and copy-number variation in worldwide human populations. Nature 451 998–1003. [DOI] [PubMed] [Google Scholar]
- Oleksyk, T. K., M. W. Smith and S. J. O'Brien, 2010. Genome-wide scans for footprints of natural selection. Philos. Trans. R. Soc. B Biol. Sci. 365 185–205. [DOI] [PMC free article] [PubMed] [Google Scholar]
- Patil, N., A. J. Berno, D. A. Hinds, W. A. Barrett, J. M. Doshi et al., 2001. Blocks of limited haplotype diversity revealed by high-resolution scanning of human chromosome 21. Science 294 1719–1723. [DOI] [PubMed] [Google Scholar]
- Prugnolle, F., A. Manica and F. Balloux, 2005. Geography predicts neutral genetic diversity of human populations. Curr. Biol. 15 R159–R160. [DOI] [PMC free article] [PubMed] [Google Scholar]
- Reynolds, J., B. S. Weir and C. C. Cockerham, 1983. Estimation of the coancestry coefficient: basis for a short-term genetic distance. Genetics 105 767–779. [DOI] [PMC free article] [PubMed] [Google Scholar]
- Saitou, N., and M. Nei, 1987. The neighbor-joining method: a new method for reconstructing phylogenetic trees. Mol. Biol. Evol. 4 406–425. [DOI] [PubMed] [Google Scholar]
- Scheet, P., and M. Stephens, 2006. A fast and flexible statistical model for large-scale population genotype data: applications to inferring missing genotypes and haplotypic phase. Am. J. Hum. Genet. 78 629–644. [DOI] [PMC free article] [PubMed] [Google Scholar]
- Serre, D., and S. Paabo, 2004. Evidence for gradients of human genetic diversity within and among continents. Genome Res. 14 1679–1685. [DOI] [PMC free article] [PubMed] [Google Scholar]
- Swallow, D. M., 2003. Genetics of lactase persistence and lactose intolerance. Annu. Rev. Genet. 37 197–219. [DOI] [PubMed] [Google Scholar]
- Tishkoff, S. A., F. A. Reed, A. Ranciaro, B. F. Voight, C. C. Babbitt et al., 2007. Convergent adaptation of human lactase persistence in Africa and Europe. Nat. Genet. 39 31–40. [DOI] [PMC free article] [PubMed] [Google Scholar]
- Voight, B. F., S. Kudaravalli, X. Wen and J. K. Pritchard, 2006. A map of recent positive selection in the human genome. PLoS Biol. 4 e72. [DOI] [PMC free article] [PubMed] [Google Scholar]
- Weir, B. S., and C. C. Cockerham, 1984. Estimating F-statistics for the analysis of population structure. Evolution 38 1358–1370. [DOI] [PubMed] [Google Scholar]
- Weir, B. S., and W. G. Hill, 2002. Estimating F-statistics. Annu. Rev. Genet. 36 721–750. [DOI] [PubMed] [Google Scholar]
- Weir, B. S., L. R. Cardon, A. D. Anderson, D. M. Nielsen and W. G. Hill, 2005. Measures of human population structure show heterogeneity among genomic regions. Genome Res. 15 1468–1476. [DOI] [PMC free article] [PubMed] [Google Scholar]
- Weiss, K. M., and J. C. Long, 2009. Non-Darwinian estimation: my ancestors, my genes' ancestors. Genome Res. 19 703–710. [DOI] [PMC free article] [PubMed] [Google Scholar]
- Wright, S., 1951. The genetical structure of populations. Ann. Eugen. 15 323–354. [DOI] [PubMed] [Google Scholar]


