Abstract
Purpose
To determine whether an unsupervised machine learning classifier can identify patterns of visual field loss in standard visual fields consistent with typical patterns learned by decades of human experience.
Methods
Standard perimetry thresholds for 52 locations plus age from one eye of each of 156 patients with glaucomatous optic neuropathy (GON) and 189 eyes of healthy subjects were clustered with an unsupervised machine classifier, variational Bayesian mixture of factor analysis (vbMFA).
Results
The vbMFA formed five distinct clusters. Cluster 5 held 186 of 189 fields from normal eyes plus 46 from eyes with GON. These fields were then judged within normal limits by several traditional methods. Each of the other four clusters could be described by the pattern of loss found within it. Cluster 1 (71 GON + 3 normal optic discs) included early, localized defects. A purely diffuse component was rare. Cluster 2 (26 GON) exhibited primarily deep superior hemifield defects, and cluster 3 (10 GON) held deep inferior hemifield defects only or in combination with lesser superior field defects. Cluster 4 (6 GON) showed deep defects in both hemifields. In other words, visual fields within a given cluster had similar patterns of loss that differed from the predominant pattern found in other clusters. The classifier separated the data based solely on the patterns of loss within the fields, without being guided by the diagnosis, placing 98.4% of the healthy eyes within the same cluster and spreading 70.5% of the eyes with GON across the other four clusters, in good agreement with a glaucoma expert and pattern standard deviation.
Conclusions
Without training-based diagnosis (unsupervised learning), the vbMFA identified four important patterns of field loss in eyes with GON in a manner consistent with years of clinical experience.
In a previous study, we compared the ability of several classifiers to detect early field loss.1 The inputs to the classifiers in that study were raw thresholds from the most well-studied and most commonly used clinical measure of visual function in glaucoma, standard automated perimetry, plus the age from either healthy eyes or from eyes identified as glaucomatous by the presence of glaucomatous optic neuropathy (GON). Visual field results were not used to select subjects or as a gold standard to train the output. The output from each classifier was a designation of either “normal field” or “glaucomatous field.” Several machine learning classifiers representing different methods of supervised learning and reasoning2 performed well in classifying the visual fields, in comparison to both Statpac 2 (Carl Zeiss Meditec, Dublin, CA) indices3,4 and a glaucoma expert (EZB). These classifiers were equally able to identify confirmed change in a separate data set of visual fields of ocular hypertensive eyes, showing a better determination of conversion in eyes with GON than was found with the traditional methods.5
The problem with these supervised machine learning classifiers is that we do not know what patterns they are relying on to enable the accurate classification of the visual fields. In supervised learning, each participant's data are labeled with a diagnosis (GON or no GON), and the classifiers learn to make the correct diagnosis. What they learn from the training visual fields1 and exactly how they use this knowledge to reach their conclusion for another set of visual field data5 is not known.
The present study addresses these questions by using an unsupervised machine learning method to cluster visual fields from standard automated perimetry. Unsupervised learning means that the classifier had no knowledge of which diagnostic group the visual fields came from or what patterns of loss are associated with a particular diagnosis. Unsupervised learning methods, as used in this study, learn the associations in the data on their own, yielding patterns instead of diagnoses.
Fields obtained with standard perimetry were chosen because it is the best understood of all the perimetric procedures, and the patterns of glaucomatous field loss associated with it are well documented. This study differs from the previous machine learning classification studies that separated visual fields into normal or glaucomatous, because the unsupervised clustering type of classifier chosen is not restricted to two outcomes and its rules for clustering are known. In this case, the classifier provided information about several different patterns of visual field loss present in the data. Patterns that, we assume, contribute in some way to the classification and may help with our understanding of the representation of glaucoma in visual fields.
We present the patterns of visual field loss discovered by an unsupervised machine learning classifier, the relationship of these patterns to those typically associated with glaucoma and early field loss, and a discussion of the potential of this particular unsupervised learning technique, variational Bayesian mixture of factor analysis (vbMFA), to further our understanding of glaucomatous visual field loss.
Methods
Subjects
The same visual fields in 345 eyes from our initial study were used.1 These visual field data came from a 12-year longitudinal study of visual function in glaucoma, the Diagnostic Innovations in Glaucoma Study (DIGS) at the Hamilton Glaucoma Center, University of California, San Diego. Normal participants in this study were recruited from the community, staff, and spouses or friends of patients. Patients with primary open-angle glaucoma were recruited from the Glaucoma Center. Informed consent was obtained from all participants after the nature and possible consequences of the study were explained. The study was approved by the Institutional Review Board of the University of California at San Diego and adhered to the tenets of the Declaration of Helsinki.
Exclusion criteria for both groups included unreliable visual field test results (defined as fixation loss, false negative, and false positive errors ≥33%), angle abnormalities on gonioscopy, any diseases other than glaucoma that could affect the visual fields, and medications known to affect visual field sensitivity. Subjects with a best-corrected visual acuity worse than 20/40, spherical equivalent outside ±5.0 D, and cylinder correction greater than 3.0 D were excluded. Poor-quality stereoscopic photographs of the optic nerve head was also an exclusionary criterion. A family history of glaucoma was not.
The classification of an eye as glaucomatous or normal was based on the appearance of the optic disc through consensus of masked evaluations of two independent graders of a stereoscopic disc photograph and not on visual field defects. Color simultaneous stereoscopic photographs were obtained (model TRC-SS camera; Topcon Instrument Corp. of American, Paramus, NJ) after maximum pupil dilation. These photographs were taken within 6 months of the visual field in the data set. Stereoscopic disc photographs were recorded for all patients with the exception of a subset of normal subjects (95 eyes) for whom photographs were not available. These normal subjects had no evidence of optic disc damage detected by dilated slit lamp indirect ophthalmoscopy with a hand-held 78-D lens. All photograph evaluations were accomplished using a stereoscopic viewer (Pentax Stereo Viewer II; Asahi Optical Co.-Pentax, Tokyo, Japan) illuminated with color-corrected fluorescent lighting. GON was defined by evidence of any of the following: excavation, neuroretinal rim thinning or notching, nerve fiber layer defects, or an asymmetry of the vertical cup-to-disc ratio ≥ 0.2 between the two eyes. Inconsistencies between the two graders’ evaluations were resolved through adjudication by a third evaluator. Because the purpose of the study was to identify patterns of visual field loss and not to assess the effects of risk factors on the presence or absence of a field loss, no specific range of intraocular pressures was required for the patient group.
Inclusion criteria for the normal category required that subjects have normal findings in dilated eye examinations, open angles, and no visible evidence of GON. Normal optic discs had a cup-to-disc ratio asymmetry ≤ 0.2, intact rims, and no hemorrhages, notches, excavation, or nerve fiber layer defects. Normal subjects had intraocular pressures ≤ 22 mm Hg with no history of elevated IOP.
If both of the eyes met the inclusion criteria, only one of the eyes was selected at random. The final selection totaled 345 eyes, including 189 normal eyes (mean age, 50.0 ± 6.7 years; SD) and 156 eyes with GON (62.3 ± 12.4 years). We did not want to limit the algorithm to working only with certain age-matched data, and so we included age in the model as the first step in reducing it as a variable (see the Results section).
Visual Field Testing
All subjects had automated full-threshold standard visual field testing with the Humphrey Visual Field Analyzer (Carl Zeiss Meditec) with program 24-2 or 30-2. The visual field locations in program 30-2 that are not in program 24-2 were deleted from the data and display.
The input to the classifier included the absolute sensitivity in decibels of each of the 52 test locations (not including two locations near the blind spot) in the 24-2 visual field and age. These were the same input data used in our initial study.1 The 52 thresholds were extracted from the perimeter by computer (Peridata, ver. 6.2; Peridata Software GmbH, Hürth, Germany). Age was included to account for the differences in mean age between the healthy and glaucomatous eyes and because age is an important correction factor used in visual field analysis.
Cluster Analysis with vbMFA
Background
In this approach, we were interested in using machine learning classifiers that could adapt to or learn the intrinsic distribution or clustering of the data. In this way, they can identify classes of data that belong together due to their data distribution similarities. This principle is known as unsupervised learning, because the data (in our case visual fields) are not labeled with the diagnosis for the learning process.
Unsupervised learning refers to a type of algorithm or technique often used by the machine learning, adaptive filtering, and neural network research community. The main feature of unsupervised learning is that the algorithm seeks information from data without an operator instructing the algorithm about what the data are or where they originate. That is, there are no labels attached to the data points that could teach the algorithm whether it belongs to one certain class or cluster. In unsupervised learning, the algorithm is driven by an objective function (organization of the data) in which the algorithm's internal parameters are adjusted so that the objective function is maximized or minimized. There are several different objective functions or models of learning used depending on the specific learning task. These include grouping data according to similarity measures, finding data directions with maximum variance or matching the likelihood of the data with a preconceived model.
The model we chose is an enhancement of the data-generative model, a model that has received significant attention and has been used in many applications.6 The data-generative model uses a probabilistic approach for explaining how the observed data were constructed, by learning a multidimensional probabilistic model that is described by a mean vector and a covariance matrix. It is called a data-generative model because the data can be viewed as being generated by sequentially adding components of the covariance matrix (columns) to the mean vector and finally reproducing the observed data.
We extended the basic generative model to a mixture of Gaussian densities model in which each component in the mixture explains a certain grouping, classification, or clustering of the data with a Gaussian distribution. However, when all are mixed together, the overall generative model can approximate or adapt any skewed or non-Gaussian distribution necessary to fit or represent the observed data. In addition, it allows for unsupervised classification of the data. More specifically, we used the mixture of factor analyzers (MFAs)7 model, which is a specific mixture model that can account for noisy measurements (such as visual field data) and tries to find parameters that explain variations in the data to capture important components in the visual field patterns. The vbMFA is a further extension of the basic MFA algorithm. The vbMFA is able to learn any number of components of the covariance matrix and any number of classes (or clusters). For example, it is not obvious that the data would fall into two clusters (abnormal and normal) or that there are only a few important components of the covariance matrix representative in each class. All the internal parameters (mean vectors, covariance matrix, weighting of clusters, and number of clusters) are inferred by the vbMFA algorithm, making it a powerful method to extract as much information as possible from the observed data alone without overfitting the model to the data. The vbMFA provides results with the least assumptions, interventions, or additional information from the user, so that it is not overfitto training data, as it might be in a supervised model.
Method
The full details of these methods can be found in previous publications.6–8 The steps used with the vbMFA to divide the data into clusters and to characterize each by the cluster mean and variance can be simplified as follows:
The 52 visual field measurements and age form a 53 dimensional space containing the 345 subjects.
Initially, the 345 visual fields are randomly assigned into C (number of) clusters. The initial number of categories is set arbitrarily by the operator and then checked against the final result to be sure that this initial number is larger. The vbMFA removes extra clusters itself, without operator input, until it finds what it “considers” the correct number of Gaussian clusters in the data.
Visual fields belonging to the same cluster then defined that cluster's mean and covariance.
For each visual field, its cluster assignment is then recomputed according to its distance from the C cluster means (normalized by the variances).
Steps 2 and 3 are repeated until there is no further change in cluster assignment
The clustering (steps 2–5) was repeated with many different random initial partitions (approximately 200), each generated independently by the vbMFA without operator input. The results of these ~200 different initial partitions were converged to 10 final solutions with varying numbers of clusters (2–6). vbMFA, which is based on Bayesian techniques, allows computation of marginal likelihood scores.9 These scores reflect the probability of getting the generated data set, assuming the density model and the parameters chosen are correct. Bayesian techniques also compare goodness of fit to the data and an assessment of the degree of overfitting.7,10 Applying these techniques resulted in two clustering solutions with equal scoring: one with four distinct clusters and one with five. The five-cluster solution is reported herein because it removed one GON eye from the cluster containing the normal subjects and it provided an additional visual field loss pattern for assessment. If we had chosen to report the four-cluster solution instead of the five-cluster solution, four of the six eyes in cluster 4 would have moved into cluster 1 and two would move into cluster 2. This advanced-loss group would not have been separated from the other patterns.
Results
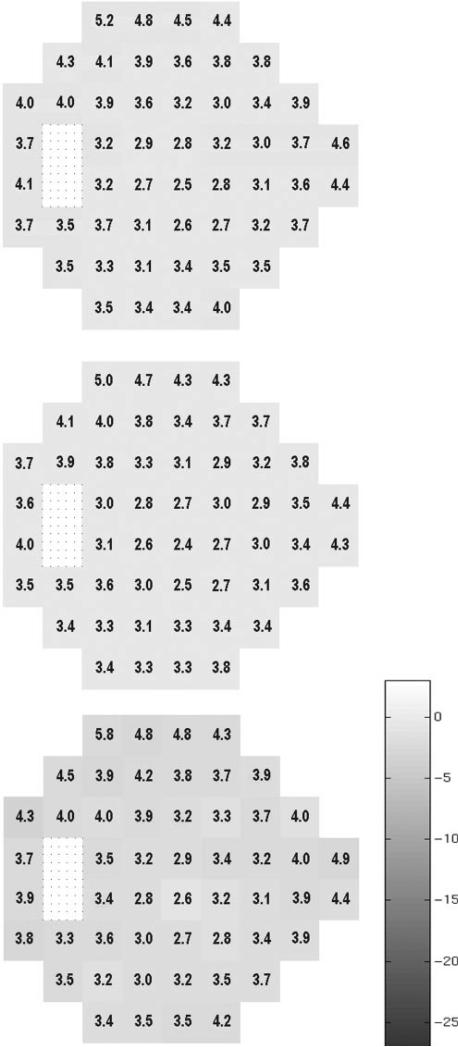
The vbMFA optimal solution produced five distinct clusters. Cluster 5 held 186 of 189 fields in normal eyes plus 46 in eyes with GON. Cluster 5 had fields that showed little evidence of any defect. Figures 1 and 2 depict the mean grayscale pattern generated by the algorithm for the individuals in each cluster relative to the 189 normal eyes. The grayscale is based on the mean difference in decibels of each visual field location from the average sensitivity of the 189 normal eyes. The numbers superimposed on each location are the standard deviations of the mean difference for all eyes in the cluster (Fig. 1, top), normal eyes only (Fig. 1, middle), and the 46 patients’ eyes (Fig. 1, bottom). By definition the grayscale in the middle of figure 1 shows very little mean difference, because these 186 eyes are part of the full 189 normal eyes on which the difference is based. A slight darkening is noted in the bottom graph that shows the 46 eyes with GON (see the Discussion section).
Figure 1.
The mean grayscale pattern generated by the algorithm for the individuals in cluster 5 relative to the 189 normal eyes. The grayscale is based on the mean difference in decibels of each visual field location from the average sensitivity of the 189 normal eyes. Each location of the visual field is represented with a box, and the appearance of each box was determined with quantification rather than interpolation as found in the grayscale field usually associated with visual field printouts (as in Fig. 3). The numbers superimposed on each location are the standard deviations of the difference in sensitivity for all eyes in the cluster (top), normal eyes only (middle), and the 46 patient eyes (bottom). The bar next to these patterns depicts the grayscale range used by the vbMFA with darker areas denoting greater loss of sensitivity. By definition the grayscale in the middle of Figure 1 shows very little mean deviation, since these 186 eyes are part of the full 189.
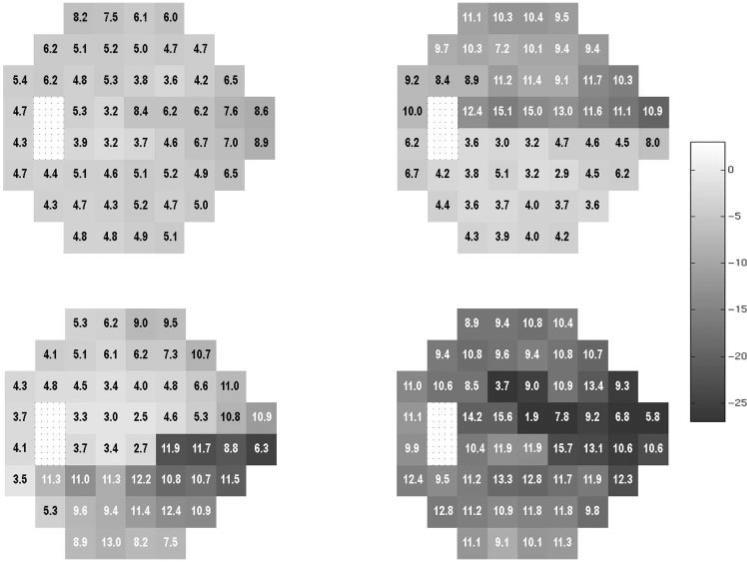
Figure 2.
The mean visual field pattern in dB shown as a grayscale with numerical values for standard deviations superimposed for each visual field location for clusters 1 through 4. The bar next to these patterns depicts the grayscale range with darker areas denoting greater loss of sensitivity. cluster 1 (top left), cluster 2 (top right), cluster 3 (bottom left), and cluster 4 (bottom right). Each location of the visual field is represented by a box and the appearance was determined with quantification rather than interpolation as found in the grayscale field usually associated with visual field printouts as in Figure 3.
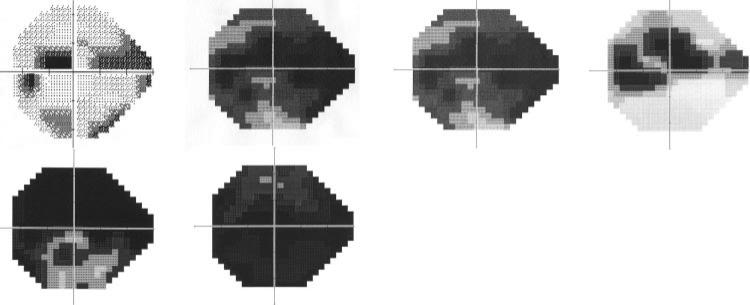
Each of the remaining four clusters could be described by the severity of defect and the pattern of loss found within it. Figure 2 gives the mean grayscale value with superimposed standard deviation for each visual field location of the other four clusters. From these mean patterns we concluded that cluster 1 (top left: 71 patient + 3 healthy eyes) held fields with predominantly a mild diffuse loss, cluster 2 (top right: 26 patients) showed predominantly superior hemifield loss, cluster 3 (lower left: 10 patients) predominantly inferior hemifield loss, and cluster 4 (lower right: 6 patients) an advanced loss affecting both hemifields.
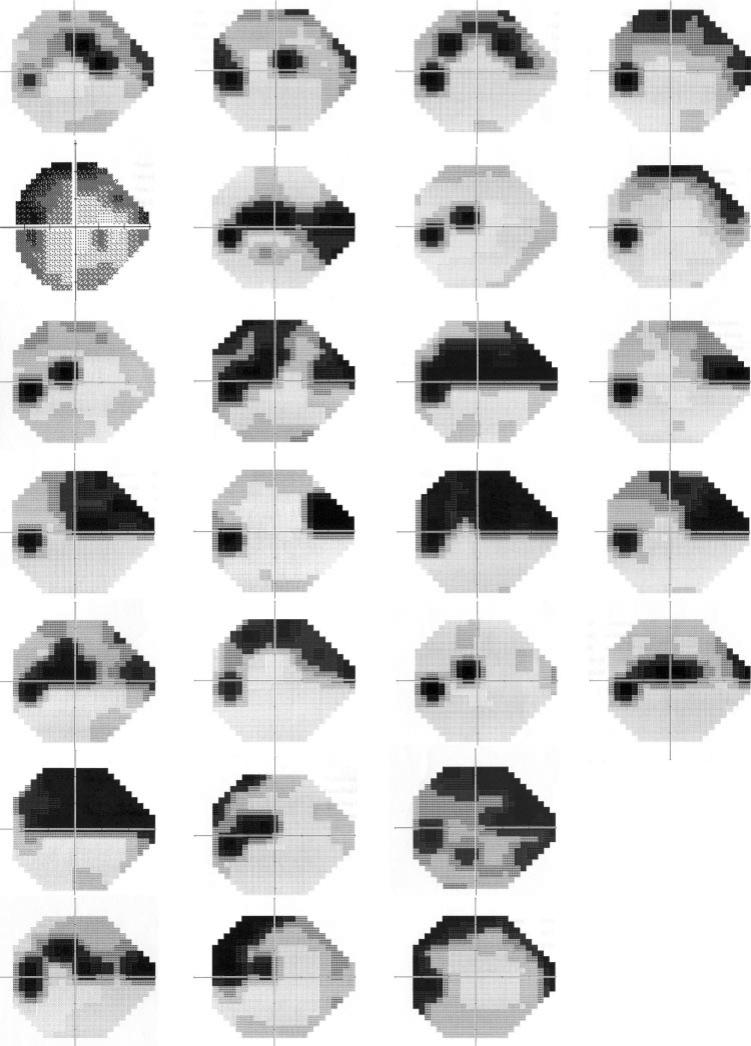
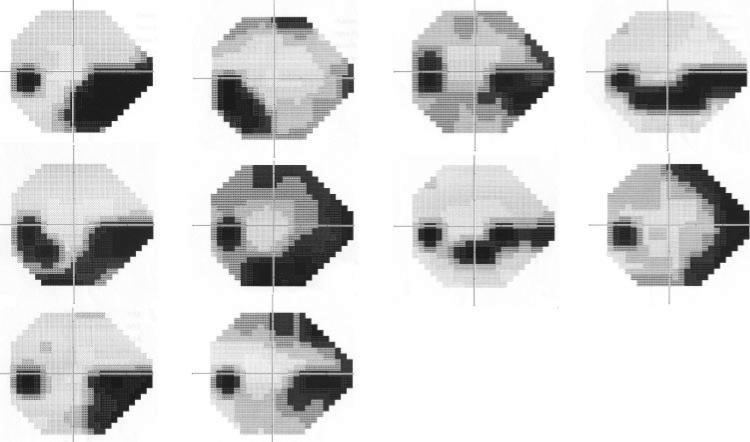
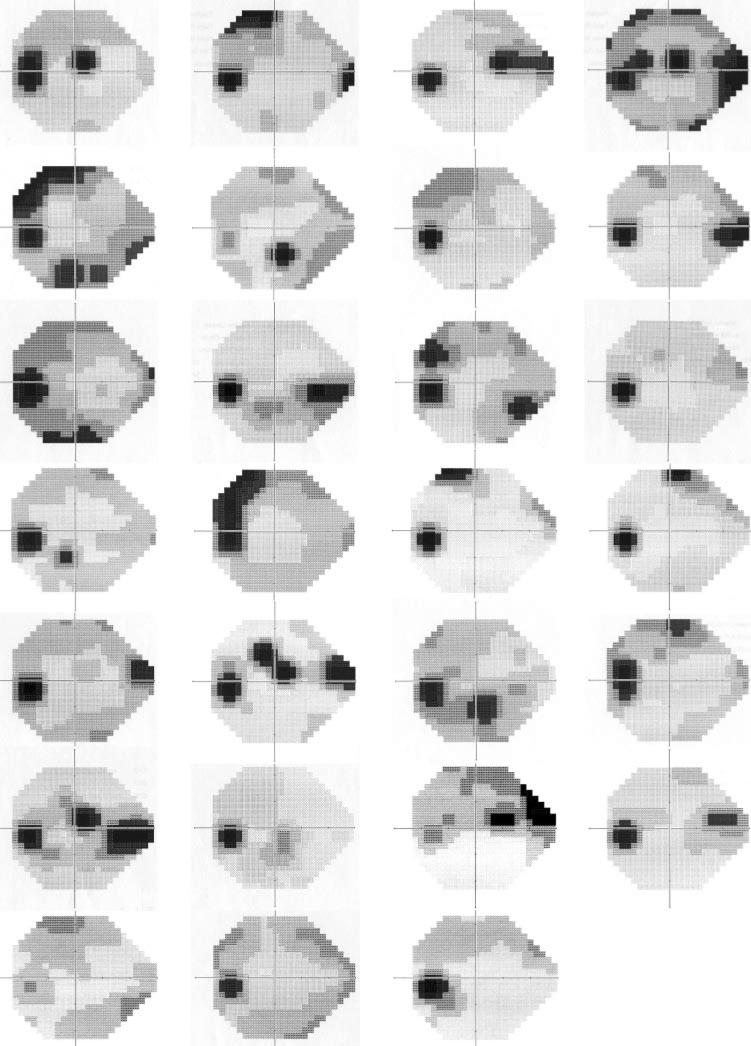
The mean grayscale for each cluster may be masking the individuality of a range of patterns within each cluster. To determine this, we visually evaluated the visual fields comprising each cluster. In cluster 2 all fields had a significant superior visual field defect, with a few also having a milder defect in the inferior field (Fig. 3). In cluster 3 the always-present inferior field defect was accompanied by a superior nasal step in 6 of the 10 fields (Fig. 4). In cluster 4, five of the six fields showed deep defects in both hemifields, the sixth showed a deep superior central defect (Fig. 5). It was in the cluster 1 group of fields that the initial conclusion, that this group represented early diffuse defects, might not have been well founded. This purely diffuse defect was present in a very small percentage of these eyes (Fig. 6) with most fields in this group exhibiting small (only a few test locations) circumscribed depressions in sensitivity. The location of this defect could be almost anywhere in the visual field, so that when the group was averaged together, it lead to the misinterpretation of a mild diffuse loss as indicative of the fields in cluster 1.
Figure 3.
Grayscale plots generated by the perimeter for all fields from cluster 2.
Figure 4.
Grayscale plots generated by the perimeter for all fields from cluster 3.
Figure 5.
Grayscale plots generated by the perimeter for all fields from cluster 4.
Figure 6.
Grayscale plots generated by the perimeter for a randomly selected subset of this largest group of fields, cluster 1. The first six rows depict eyes with GON. The final row shows the three fields from healthy eyes that were placed in this cluster.
To rule out age as a primary input for classification we did two things. First, we analyzed an age-matched subset of the data. This subset included 135 normal subjects with a mean age of 58.61 ± 11.63 years (range, 35.5–85.3) and 148 eyes with GON with a mean age of 60.39 ± 11.40 years (range, 31.3–79.2). These were not significantly different. Only three fields shifted their classification with this subgroup. Second, the model clustered fields into five groups based on clustering probabilities. We used the full data set without age-matching to test the linear dependency of those clustering probabilities against age using linear regression analysis with least squares fitting. We fit one line to each cluster. Table 1 gives the slopes, confidence intervals of the slopes, correlation coefficients, and the coefficient of the determination. The low coefficients of determination and slopes indicate that there was no linear trend with age.
Table 1.
The Linear Dependency of Cluster Placement Due to Age
| Cluster | Slope | Confidence Intervals | Correficient of Determination | Correlation Coefficient | |
|---|---|---|---|---|---|
| 1 | 0.0055 | 0.0028 | 0.0081 | 0.0461 | 0.2148 |
| 2 | 0.0024 | 0.0007 | 0.0041 | 0.0225 | 0.1501 |
| 3 | –0.0006 | –0.0017 | 0.0005 | 0.0033 | –0.0571 |
| 4 | 0.0006 | –0.0003 | 0.0015 | 0.0050 | 0.0708 |
| 5 | –0.0078 | –0.0109 | –0.0048 | 0.0711 | –0.2666 |
Post Hoc Analyses
Post Hoc Methods
In this study, the classifier used only the raw threshold values from the 52 visual field locations and age to cluster the visual fields according to the patterns it found in the data. The purpose was not to categorize the fields as normal or abnormal. However, to allow the reader to see the range of field defects included in each cluster, we did a post hoc classification of the fields. Visual fields were considered abnormal if they had either a Glaucoma Hemifield Test result of “outside normal limits” or a pattern standard deviation outside the 95% normal limits provided by the visual field analyzer's internal statistical package (Statpac 2; Carl Zeiss Meditec). The determination of abnormality by a glaucoma expert from our original study is also shown.1
As a additional post hoc analysis, we asked the vbMFA to recluster just the fields from clusters 5 and 1, thinking that this might lead to a further breakdown for the 46 GON eyes clustered with the normal subjects.
Post Hoc Results
Table 2 shows the breakdown for each of the five clusters along with the mean and SD of mean defect and pattern standard deviation for each group. Also shown is the percentage of fields in each group classified on the post hoc analysis as abnormal based on the Glaucoma Hemifield Test result, the pattern standard deviation, and the glaucoma expert. The visual fields from GON eyes with moderate to advanced loss were placed in clusters 2 to 4. The post hoc analysis showed that the fields from cluster 2 (n = 26), cluster 3(n = 10), and cluster 4 (n = 6) were all considered abnormal by the Glaucoma Hemifield Test, the pattern standard deviation, and the expert with 100% specificity and 100% sensitivity, if the presence of GON is considered the standard for abnormality. Although the fields in clusters 2 to 4 were not difficult to classify as abnormal, each of these three clusters exhibited a pattern of visual field loss distinct from each of the other clusters. The nearly always present, small, localized defects found in fields within cluster 1 explain why the pattern standard deviation and Glaucoma Hemifield Test were also successful in identifying these fields as abnormal. Of the 71 eyes in cluster 1, 68 (96%) had GON.
Table 2.
Results of vbMFA Clustering
| Global Indices |
% Abnormal |
|||||||
|---|---|---|---|---|---|---|---|---|
| Cluster | n | MD | SD | PSD | SD | PSD | GHT | Expert |
| 5 | 232 | –0.26 | 1.59 | 1.89 | 0.45 | 0.04 | 0.08 | 8 |
| Normal | 186 | –0.07 | 1.50 | 1.85 | 0.33 | 0 | 0 | 6 |
| Patient | 46 | –1.01 | 1.70 | 2.07 | 0.73 | 2 | 4 | 13 |
| 1 | 71 | –3.22 | 2.13 | 4.53 | 1.57 | 82 | 15 | 97 |
| Normal | 3 | –2.34 | 0.59 | 3.02 | 0.39 | 33 | 0 | 100 |
| Patient | 68 | –3.26 | 2.17 | 4.6 | 1.57 | 84 | 88 | 97 |
| 2 | 26 | –5.87 | 3.35 | 8.92 | 2.72 | 100 | 100 | 100 |
| 3 | 10 | –7.77 | 2.74 | 10.82 | 2.69 | 100 | 100 | 100 |
| 4 | 6 | –18.12 | 5.61 | 10.42 | 1.91 | 100 | 100 | 100 |
Shading indicates the results for all fields in a cluster. Unshaded areas separate results for fields of healthy eyes from those of eyes with GON. MD, mean deviation; PSD, pattern standard deviation; GHT, glaucoma hemifield test result.
If we consider cluster 5 the “normal” cluster and clusters 2 to 4 “abnormal” field clusters, the κ value for agreement between the vbMFA with pattern standard deviation was 0.905, with the Glaucoma Hemifield Test was 0.913, and with the expert it was 0.873.
The post hoc evaluation using only the eyes from clusters 5 and 1 did not yield any additional clusters. Forty-five of the original 46 GON eyes remained with the normal subjects, suggesting that the original clustering was close to optimal for the vbMFA. When only cluster 5 was compared with cluster 1, the κ statistic remained high, with 0.863 for pattern standard deviation, 0.875 for Glaucoma Hemifield Test, and 0.829 for the expert.
Discussion
Although there are many other methods for performing unsupervised learning—for example, self-organizing maps11 and adaptive resonance theory12—these methods are not motivated from probabilistic or statistical principles but more from concepts of cortical functions and neural networks. We chose the MFA7 for the following reasons: (1) It provides a systematic probabilistic measure that enables an understanding of how likely it is that a test point belongs to one class versus the other. (2) It assumes a linear data-generative model—that is, given the model, which includes each cluster's mean and the covariance, any new visual field can be classified according to its distance from these two parameters. (3) The mathematical description of this model is flexible and expandable. The vbMFA is actually a mixture of Gaussians not a single Gaussian. Because of this, it is able to handle data that are not normally distributed and does not require the assumption of a Gaussian distribution, which is necessary for many statistical classifiers. This makes it very flexible for handling difficult data, such as that obtained from visual fields.
Our present study differed from our previous work in the type of classifier (unsupervised versus supervised) and in the goal (identifying patterns of field loss associated with glaucoma or normal, instead of classifying the fields as belonging to an eye with glaucoma or to one that is normal).1,5 The classifier used in this study did not know the diagnosis associated with each visual field. This classifier learned, on its own, to separate the 345 visual fields into clusters. The discernible rules underlying the classification by the vbMFA in this report are that patterns of field loss considered similar are placed within the same cluster, and patterns that differ are in different clusters, each separable by its mean and covariance.
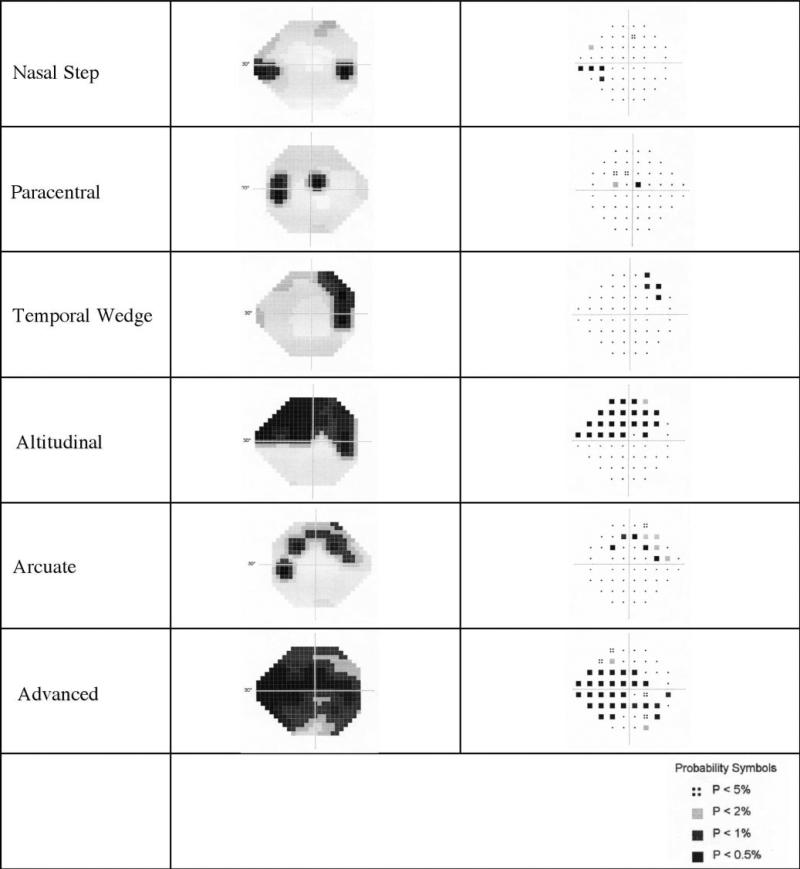
Several “typical” patterns for glaucomatous visual field loss have been described over many years, and examples of each are depicted in Figure 7.13–22 These patterns result from the pathways traversed by the axons from the retinal ganglion cells to the optic disc. The axons coming from adjacent locations on the retina tend to form bundles of optic nerve fibers, each of which enters the optic disc at specific locations around its rim. This leads to a topographical relationship between damage at the optic disc and loss of ganglion cell function measured by the visual field test. Certain locations along the optic disc are more likely to be damaged by glaucoma. Hence, certain patterns of visual field loss arise as typical to glaucoma, such as nasal steps23 where the anatomy suggests it is very unlikely that a defect within a nerve fiber bundle would cross the horizontal meridian and analysis of fields supports this.24 This fact is very useful in the interpretation of visual fields. Possibly defective areas in one hemifield can be compared to comparable normal areas in the other hemifield to help determine the probability of a true defect.4 Others patterns include isolated paracentral defects,14,15 temporal wedges,25 altitudinal defects, and arcuate scotomas.16 Combinations are also possible. Figures 3 to 6 show how the patterns in the vbMFA clusters 1 to 4 resemble classic glaucomatous patterns, identified over years of experience with standard visual fields.
Figure 7.
Examples of each of the typical patterns of glaucomatous visual field loss. Both the grayscale and pattern deviation plots are shown.
The unsupervised learning algorithm was not designed to discriminate glaucoma from normal, and yet visual field patterns in eyes with normal optic discs was segregated from visual field patterns in eyes with abnormal optic discs almost as accurately as supervised algorithms that had been trained specifically to classify fields into these two groups. The untrained vbMFA did very well using just the differences in the patterns it found in the visual fields between these two groups to place 98% (186/189) of the healthy eyes in one cluster and to spread 71% (110/156) of the eyes with GON across the other four clusters. This may mean that pattern identification is an accurate method for analyzing visual fields, with the additional advantage that it provides identifiable patterns of visual field loss in each of the derived clusters.
The results also support the notion that a high percentage of standard visual fields remain normal in eyes showing optic nerve damage. This has been shown before with anatomic assessment of nerve fiber number in donor eyes26 and in studies comparing optic disc and nerve fiber layer with visual fields.27–31 In this study, fields in 46 eyes with GON were placed in the same cluster as those in healthy eyes. On post hoc analysis the majority of these fields were also designated as normal by pattern standard deviation (98%), the Glaucoma Hemifield Test (96%), and the expert (87%). Their mean deviations and pattern standard deviations were slightly poorer than those of the healthy eyes in this cluster, but were still well within what is considered the normal range (Table 2). This may mean that some individuals within the normal range on global and local indices have vision loss that might be discernible if we could only go back in time and collect baseline data for the fields before vision was affected by glaucoma. This is consistent with findings from the Ocular Hypertension Treatment Study (OHTS), which found that pattern standard deviations from normal baseline visual fields were predictive of future visual field loss in both univariate and multivariate models.32
The analyses presented herein also have a direct bearing on an ongoing argument in the perimetric literature: whether the earliest visual field deficits associated with glaucoma are localized, diffuse, or some combination of the two.14,33–40 In the early-stage glaucoma group, cluster 1 (Fig. 2, top left), a localized component was present in nearly all fields, with 90% (64/71) abnormal on pattern standard deviation and/or the Glaucoma Hemifield Test, both measures of local deviation in visual field sensitivity. This suggests that even with some diffuse component in the field, these eyes could have been identified as abnormal based solely on the localized pattern of visual field loss. This does not mean a diffuse component may not be useful for identifying particular subtypes of glaucomatous damage. However, we did not find a purely diffuse component leading to a separate cluster of fields for any subjects included in this study, even though these subjects covered a range of glaucomatous damage from early to moderately advanced.
The impressive performance of the vbMFA with standard perimetry, the current clinical standard, suggests that it may be very useful for identifying visual field patterns associated with glaucoma in the newer and more sensitive visual-function–specific tests without the need for years of clinical experience. These tests include frequency-doubling technology perimetry (Carl Zeiss Meditec and Welch-Allyn, Skaneateles, NY) or short-wavelength automated perimetry (Carl Zeiss Meditec and Interzeag, Zurich, Switzerland). These tests target a subset of the retinal ganglion cells, which are sparse and have different temporal and spatial summation properties.41 For example, the most commonly used version of the frequency doubling test for glaucoma, program N-30, has only 18 locations in the peripheral visual field measured with targets 10° of visual angle. For these reasons, it is likely that the patterns associated with GON differs for this test and for short-wavelength perimetry, although this remains to be tested. Two more potential applications for this machine classifier would be to determine whether visual fields in different ocular diseases can be separated based on their typical patterns of loss, as has been suggested with subjective classifications, and to group visual field locations into sectors that are optimum for analysis of visual field data for glaucoma. Finally, this machine classifier may be of some use for training ophthalmologists to differentiate the typical patterns found in various eye diseases.
In summary, we found that certain features were common to all fields within a given cluster and the patterns of visual field loss found within each cluster were representative of patterns typical of glaucoma. vbMFA did this with the least assumptions, interventions or additional information from the user. This is encouraging because it shows that the classifier was somehow using information that has been shown over many years and numerous studies to be useful for classifying standard visual fields. This type of unsupervised learning algorithm, therefore, may be useful to classify fields from other visual function or optic nerve imaging techniques with which we do not have the same level of experience with the results.
Acknowledgments
Supported by National Eye Institute Grants EY08208 (PAS) and EY13235 (MHG) and funds from Research to Prevent Blindness (PAS), and Howard Hughes Medical Institute (TS).
Footnotes
Disclosure: P.A. Sample, Carl Zeiss Meditec (F); K. Chan, None; C. Boden, None; T.-W. Lee, None; E.Z. Blumenthal, None; R.N. Weinreb, Carl Zeiss Meditec (F); A. Bernd, None; J. Pascual, None; J. Hao, None; T. Sejnowski, None; M.H. Goldbaum, None
References
- 1.Goldbaum MH, Sample PA, Chan K, et al. Comparing machine classifiers for diagnosing glaucoma from standard automated perimetry. Invest Ophthalmol Vis Sci. 2002;43:162–168. [PubMed] [Google Scholar]
- 2.Chan K, Lee T-W, Sample PA, Goldbaum MH, Weinreb RN, Sejnowski T. Comparison of machine learning and traditional classifier in glaucoma diagnosis. IEEE Trans Biomed Eng. 2002;49:963–974. doi: 10.1109/TBME.2002.802012. [DOI] [PubMed] [Google Scholar]
- 3.Anderson DR, Patella VM. Automated Static Perimetry. 2nd ed. Mosby; New York, NY: 1999. pp. 103–120. [Google Scholar]
- 4.Asman P, Heijl A. Glaucoma hemifield test: automated visual field analysis. Arch Ophthalmol. 1992;110:812–819. doi: 10.1001/archopht.1992.01080180084033. [DOI] [PubMed] [Google Scholar]
- 5.Sample PA, Goldbaum MH, Chan K, et al. Using machine learning classifiers to identify glaucomatous change earlier in standard visual fields. Invest Ophthalmol Vis Sci. 2002;43:2660–2665. (Erratum. Invest Ophth Vis Sci. 44:1813, 2003.)
- 6.Duda RO, Hart PE, Stork DG. Pattern Classification. 2nd ed. John Wiley & Sons; New York: 2001. [Google Scholar]
- 7.Ghahramani Z, Beal MJ. Variational inference for Bayesian mixtures of factor analyzers. In: Solla S, Leen TK, Muller KR, editors. Advances in Neural Information Processing Systems 12. MIT Press; Cambridge, MA: 2000. pp. 449–455. [Google Scholar]
- 8.Chan K, Lee T-W, Sejnowski T. Variational learning of clusters of undercomplete nonsymmetric independent components. J Mach Learn Res. 2002;3:99–114. [PMC free article] [PubMed] [Google Scholar]
- 9.Jordan MI, Ghahramani Z, Jaakkola T, Saul LK. An introduction to variational methods for graphical models. Mach Learn. 1999;37:183–233. [Google Scholar]
- 10.MacKay DJC. Probable networks and plausible predictions: a review of practical Bayesian methods for supervised neural networks. Network. 1995;6:469–505. [Google Scholar]
- 11.Kohonen T. Self-Organizing Maps, Springer Series in Information Sciences. 3rd extended edition. Vol. 30. Springer; Berlin: 2003. chap 2. [Google Scholar]
- 12.Carpenter GA, Grossberg S. Adaptive resonance theory. In: Arbib MA, editor. The Handbook of Brain Theory and Neural Networks. 2nd ed. MIT Press; Cambridge, MA: 2003. pp. 87–90. [Google Scholar]
- 13.Armaly MF. Visual field defects in early open angle glaucoma. Trans Am Ophthalmol Soc. 1971;69:147–162. [PMC free article] [PubMed] [Google Scholar]
- 14.Aulhorn E, Karmeyer H. Frequency distribution in early glaucomatous visual field defects. Doc Ophthalmol Proc Ser. 1977;14:75–83. [Google Scholar]
- 15.Drance SM. The early field defects in glaucoma. Invest Ophthalmol Vis Sci. 1969;8:84–91. [PubMed] [Google Scholar]
- 16.Drance SM. The glaucomatous visual field. Br J Ophthalmol. 1972;56:186–200. doi: 10.1136/bjo.56.3.186. [DOI] [PMC free article] [PubMed] [Google Scholar]
- 17.Drance SM. The glaucoma visual field defect and its progression. In: Drance SM, Anderson DR, editors. Automatic Perimetry in Glaucoma: A Practical Guide. Grune & Stratton, Inc.; Orlando: 1985. pp. 35–42. [Google Scholar]
- 18.Hart WM, Becker B. The onset and evolution of glaucomatous visual field defects. Ophthalmology. 1982;89:268–269. doi: 10.1016/s0161-6420(82)34798-3. [DOI] [PubMed] [Google Scholar]
- 19.Heijl A, Lundqvist L. The frequency distribution of earliest glaucomatous visual field defects documented by automatic perimetry. Acta Ophthalmol (Copenh) 1984;62:658–664. doi: 10.1111/j.1755-3768.1984.tb03979.x. [DOI] [PubMed] [Google Scholar]
- 20.Morin JD. Changes in visual fields in glaucoma: static and kinetic perimetry in 2,000 patients. Trans Am Ophthalmol Soc. 1979;77:622–642. [PMC free article] [PubMed] [Google Scholar]
- 21.Nicholas SP, Werner EB. Location of early glaucomatous visual field defects. Can J Ophthalmol. 1980;15:131–133. [PubMed] [Google Scholar]
- 22.Werner EB, Drance SM. Early visual field disturbances in glaucoma. Arch Ophthalmol. 1977;95:1173–1175. doi: 10.1001/archopht.1977.04450070071002. [DOI] [PubMed] [Google Scholar]
- 23.Ronne H. Uber das Gesichtfeld beim Glaukom. Klin Monastsbl Augenheilkd. 1909;47:12–33. [Google Scholar]
- 24.Boden C, Sample PA, Boehm AG, Vasile C, Akinepalli R, Weinreb RN. The structure-function relationship in eyes with glaucomatous visual field loss that crosses the horizontal meridian. Arch Ophthalmol. 2002;120:907–912. doi: 10.1001/archopht.120.7.907. [DOI] [PubMed] [Google Scholar]
- 25.Werner EB, Beraskow J. Temporal visual field defects in glaucoma. Can J Ophthalmol. 1980;15:13–14. [PubMed] [Google Scholar]
- 26.Quigley HA, Addicks EM, Green WR. Optic nerve damage in human glaucoma III. Quantitative correlation of nerve fiber loss and visual field defect in glaucoma, ischemic neuropathy, papilledema, and toxic neuropathy. Arch Ophthalmol. 1982;100:135–146. doi: 10.1001/archopht.1982.01030030137016. [DOI] [PubMed] [Google Scholar]
- 27.Susanna R, Drance SM. Use of discriminant analysis I. Prediction of visual field defects from features of the glaucoma disc. Arch Ophthalmol. 1978;96:1568–1570. doi: 10.1001/archopht.1978.03910060202002. [DOI] [PubMed] [Google Scholar]
- 28.Sommer A, Pollck I, Maumenee AE. Optic disc parameters and onset of glaucomatous field loss. I. Methods and progressive changes in disc morphology. Arch Ophthalmol. 1979;97:1444–1448. doi: 10.1001/archopht.1979.01020020106002. [DOI] [PubMed] [Google Scholar]
- 29.Drance SM. The disc and field in glaucoma. Ophthalmology. 1978;85:209–214. doi: 10.1016/s0161-6420(78)35670-0. [DOI] [PubMed] [Google Scholar]
- 30.Johnson CA, Cioffi GA, Liebmann JR, Weinreb RN, Sample PA, Zangwill LM. The relationship between structural and functional alterations in glaucoma: a review. Semin Ophthalmol. 2000;15:221–233. doi: 10.3109/08820530009037873. [DOI] [PubMed] [Google Scholar]
- 31.Johnson CA, Sample PA, Zangwill LM, et al. Structure and Function Evaluation (SAFE): II. Comparison of optic disc and visual field characteristics. Am J Ophthalmol. 2003;135:148–154. doi: 10.1016/s0002-9394(02)01930-x. [DOI] [PubMed] [Google Scholar]
- 32.Gordon MO, Beiser JA, Brandt JD, et al. The Ocular Hypertension Treatment Study: baseline factors that predict the onset of primary open-angle glaucoma. Arch Ophthalmol. 2002;120:714–720. doi: 10.1001/archopht.120.6.714. [DOI] [PubMed] [Google Scholar]
- 33.Anctil JL, Anderson DR. Early foveal involvement and generalized depression of the visual field in glaucoma. Arch Ophthalmol. 1984;102:363–370. doi: 10.1001/archopht.1984.01040030281019. [DOI] [PubMed] [Google Scholar]
- 34.Caprioli J, Sears M, Miller JM. Patterns of early visual field loss in open-angle glaucoma. Am J Ophthalmol. 1987;103:512–517. doi: 10.1016/s0002-9394(14)74273-4. [DOI] [PubMed] [Google Scholar]
- 35.Glowazki A, Flammer J. Is there a difference between glaucoma patients with more diffuse visual field damage? Doc Ophthalmol Proc Ser. 1987;49:317–320. [Google Scholar]
- 36.Heijl A. Lack of diffuse loss of differential light sensitivity in early glaucoma. Acta Ophthalmol (Copenh) 1989;67:353–360. doi: 10.1111/j.1755-3768.1989.tb01614.x. [DOI] [PubMed] [Google Scholar]
- 37.Lachenmayr BJ, Drance SM, Chauhan BC, House PH, Lalani S. Diffuse and localized glaucomatous field loss in light-sense, flicker and resolution perimetry. Graefes Arch Clin Exp Ophthalmol. 1991;229:267–273. doi: 10.1007/BF00167882. [DOI] [PubMed] [Google Scholar]
- 38.Chauhan BC, Drance SM, Douglas GR, Johnson CA. Visual field damage in normal-tension and high-tension glaucoma. Am J Ophthalmol. 1989;108:636–642. doi: 10.1016/0002-9394(89)90854-4. [DOI] [PubMed] [Google Scholar]
- 39.Chauhan BC, LeBlanc RP, Shaw AM, Chan AB, McCormick TA. Repeatable diffuse visual field loss in open-angle glaucoma. Ophthalmology. 1997;104:532–538. doi: 10.1016/s0161-6420(97)30279-6. [DOI] [PubMed] [Google Scholar]
- 40.Henson DB, Artes PH, Chauhan BC. Diffuse loss of sensitivity in early glaucoma. Invest Ophthalmol Vis Sci. 1999;40:3147–3151. [PubMed] [Google Scholar]
- 41.Sample PA, Bosworth CF, Blumenthal EZ, Girkin CA, Weinreb RN. Visual function specific perimetry for indirect comparison of different ganglion cell populations in glaucoma. Invest Ophthalmol Vis Sci. 2000;41:1783–1790. [PubMed] [Google Scholar]


