Abstract
Rationale
The transverse tubule (t-tubule) system is the ultrastructural substrate for excitation-contraction coupling in ventricular myocytes; t-tubule disorganization and loss are linked to decreased contractility in end stage heart failure (HF).
Objective
To examine 1) if pathological t-tubule remodeling occurs early in compensated hypertrophy and, if so, how it evolves during the transition from hypertrophy to HF; 2) the role of junctophilin-2 in t-tubule remodeling.
Methods and Results
We investigated t-tubule remodeling in relation to ventricular function during HF progression using state-of-the-art confocal imaging of t-tubules in intact hearts, using a thoracic aortic banding (TAB) rat HF model. We developed a quantitative t-tubule power (TTpower) index to represent the integrity of t-tubule structure. We found that discrete local loss and global reorganization of the t-tubule system (leftward shift of TTpower histogram) started early in compensated hypertrophy in left ventricular (LV) myocytes, prior to LV dysfunction, as detected by echocardiography. With progression from compensated hypertrophy to early and late HF, t-tubule remodeling spread from the LV to the right ventricle (RV), and TTpower histograms of both ventricles gradually shifted leftward. The mean LV TTpower showed a strong correlation with ejection fraction and heart weight to body weight ratio. Over the progression to HF we observed a gradual reduction in the expression of a junctophilin protein (JP-2) implicated in the formation of t-tubule / sarcoplasmic reticulum junctions. Furthermore, we found that JP-2 knockdown by gene silencing reduced t-tubule structure integrity in cultured adult ventricular myocytes.
Conclusions
T-tubule remodeling in response to TAB stress begins prior to echocardiographically detectable LV dysfunction and progresses over the development of overt structural heart disease. LV t-tubule remodeling is closely associated with the severity of cardiac hypertrophy and predicts LV function. Thus, t-tubule remodeling may constitute a key mechanism underlying the transition from compensated hypertrophy to HF.
Keywords: t-tubule, myocardial remodeling, hypertrophy, heart failure, confocal microscopy
Introduction
The transverse tubules (t-tubules) are orderly invaginations of surface membrane along the Z-line regions, with regular spacing (~2μm) along the longitudinal axis of mammalian ventricular myocytes. The widely distributed, highly organized t-tubule system is essential for rapid electrical excitation, initiation and synchronous triggering of sarcoplasmic reticulum (SR) Ca2+ release, and therefore coordinated contraction of each contractile unit throughout the entire cytoplasm. The t-tubule system is thus an important determinant of cardiac cell function. 1-3
Heart failure (HF) is characterized by reduction of myocyte contractile function and defects in Ca2+ handling (i.g., blunted and dyssynchronous SR Ca2+ release) in myocytes from HF models (including human) 4-6. The cause of Ca2+ handling defects in HF is likely multifaceted, with contribution from reduced SR Ca2+ content, ryanodine receptor (RyR) hyperphosphorylation, and change in action potential shape, among other factors 7-10. Recent studies from several groups have provided compelling evidence supporting a concept that t-tubule structural remodeling is directly linked to SR Ca2+ release dysfunction in myocytes from animal models of HF 11-16 and in artificially detubulated myocytes 17-18. Although there is no doubt that t-tubule remodeling correlates with Ca2+ handling defects, it is unknown whether t-tubule alterations are an early or late event in HF. The lack of studies of t-tubule changes prior to HF onset is thus a critical knowledge gap in understanding HF. It is also not clear whether there is a relationship between t-tubule structure and cardiac function during the progression from hypertrophy to HF. In addition, little is known about the potential molecular mechanisms underlying t-tubule remodeling in heart disease.
We investigated t-tubule structure and LV function during progression of cardiomyopathy in a thoracic-aortic banding (TAB) sprague-dawley rat model of pathological left ventricular (LV) afterload. We adapted our confocal imaging system to examine the in situ epicardial t-tubule structure from Langendorff perfused intact hearts. A quantitative and sensitive method (t-tubule power index, TTpower) was developed to characterize the overall integrity of the t-tubule system. Surprisingly, we found that t-tubule remodeling starts prior to echocardiographically detectable LV systolic dysfunction during compensated hypertrophy, and is seen as patchy t-tubule loss in local regions of the LV as well as global t-tubule reorganization. With disease progression, t-tubule structural remodeling penetrates from the left to the right ventricle. TTpower is closely associated with LV systolic function during disease progression, and corresponds to the loss of JP-2 expression. Moreover, in vitro gene silencing experiments show that JP-2 knockdown reduces t-tubule integrity in cultured ventricular myocytes. These data support the hypothesis that t-tubule remodeling is a critical early event marking the transition from compensated hypertrophy to decompensated HF during the progression of HF.
Methods
Animal experiments were performed according to the protocol approved by the University of Iowa Institutional Animal Care and Use Committee. Male Sprague-Dawley rats (~60 gram) were subjected to pressure overload by TAB surgery 19. Transthoracic echocardiograms were performed in the University of Iowa Cardiology Animal Phenotyping Core Laboratory, using a Sonos 5500 Imager (Phillips Medical Systems, Andover, MA) 20. In situ confocal imaging of epicardial myocyte t-tubule structure on intact heart, power spectrum analysis of t-tubule structure, western blotting protein quantification, JP-2 knockdown experiments in cultured mouse adult myoctes were described in detail in Online Supplemental Materials.
Results
Echocardiographic assay of cardiac function
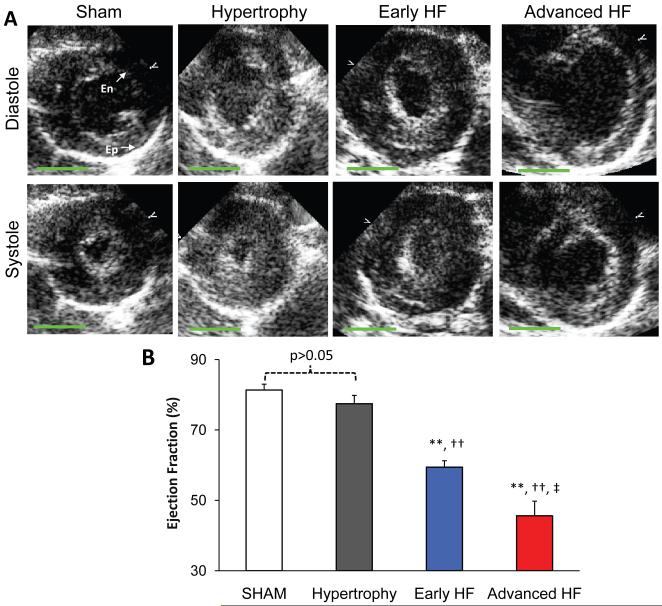
TAB rats developed hypertrophy or HF at around 8-12 weeks, as determined by echocardiography (Online Table I). TAB rats with compensated hypertrophy exhibited significant increases in heart weight (HW), heart weight to body weight ratio (HW/BW), LV mass, LV mass to body weight ratio (LVmass/BW), lower end diastolic volume to LV mass ratio (Vol/Mass), but normal end diastolic volume (EDV), end systolic volume (ESV) and highly comparable ejection fraction (EF), in comparison to those of sham operated control rats. In contrast, HF rats displayed enlarged hearts with markedly higher HW/BW ratio and Vol/Mass ratio, massive increase in end systolic and diastolic volumes, and therefore significant reduction in EF (52.8±2.3%, N=14 HF rats vs 81.8±1.2%, N=7 sham rats, p<0.001). Figure 1A shows typical echocardiographic images at end systole and end diastole from different stages of TAB rats and sham control. We divided HF rats into early and advanced HF groups: those rats with EF higher or equal to the median EF (54.4%) were assigned to early HF group (with a mean EF=59.4±1.8%, N=7), and those rats with EF lower than the median EF were assigned to advanced HF group (with a mean of 45.0±4.4%, N=7) (Figure 1B).
Figure 1. Echocardiographic results of TAB rat heart function.
A. Representative echocardiographic images at end diastole and end systole from sham, hypertrophy, early HF and advanced HF rats, respectively. At advanced HF stage, the heart was dilated with severe systolic dysfunction. B. Summary data of EF from different groups. Note: En stands for endocardial border; Ep for epicardial border. **, p<0.01 vs sham; †, p<0.05; ††, p<0.01 vs hypertrophy; ‡, p<0.05; ‡‡, p<0.01 vs early HF. Green bar=5 mm.
In addition, pericardial effusion was often observed in HF rats (7 out of 29 TAB rats). Pulmonary edema was apparent in HF but not in hypertrophy rats, as the lung weight to body weight ratio was significantly increased in failing rats (11.1±1.0 mg/g, ranging from 5.5 to 16.2 mg/g, N=14 HF rats verse 4.4±0.1 mg/g, N=7 hypertrophy rats and 4.3±0.2 mg/g, N=5 sham rats, p<0.001 between HF and hypertrophy or between HF and sham group). Furthermore, there was a significant difference in lung weight to body weight ratio between early HF and advanced HF group (8.4±1.0 mg/g vs 13.8±0.7 mg/g, p<0.01).
In situ t-tubule imaging in Langendorff perfused hearts
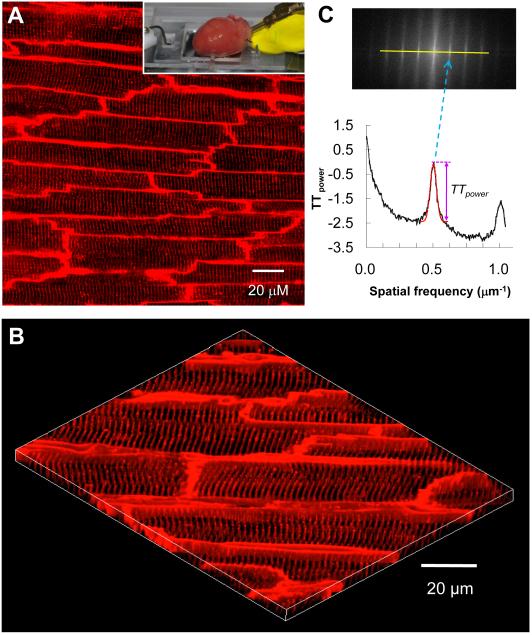
We performed in situ t-tubule imaging on intact hearts using a Langendorff perfusion system adapted to laser scanning confocal microscopy. This approach provides high resolution imaging of myocytes within ~70 μm depth of the epicardium. Each frame covered a 202×202 μm2 area and contained 10-20 well-demarcated myocytes (Figure 2A). Figure 2B shows a 3D image of the t-tubule system reconstructed from 25 stacks of t-tubule images acquired sequentially at 0.2 μm interval. This in situ imaging of t-tubule system on Langendorff-perfused intact hearts avoids possible damage of myocyte membranes and biased loss of cardiac myocytes during enzymatic isolation (see discussion), providing a novel, high resolution imaging assay for studying the t-tubule system in normal and diseased hearts.
Figure 2. In situ confocal imaging of t-tubules on intact rat heart and t-tubule image analysis.
A. A typical t-tubule image from the epicardium of Langendorff-perfused intact rat heart (control, sham-operated) loaded with lipophilic membrane indicator FM4-64. The inset illustrates a Langendorff-perfused heart attached to the inverted Zeiss 510 confocal microscope system. B. The periodically organized t-tubules were viewed from a 3D reconstruction of 25 confocal stacks at 0.2 μm interval. Scale bar: 20 μm. C. Power spectrum retrieved from a 2D Fourier transformation of confocal t-tubule image characterized the power magnitude of the regular organization of t-tubule system, in which the first peak located at spatial frequency of ~0.5 μm−1 corresponded to the ~2 μm interval of t-tubules. TTpower was measured as an absolute value using Gaussian fitting around the first peak (the red dashed curve).
The most important characteristics of myocyte t-tubule system are the highly organized, periodic striations with almost identical spacing (~2 μm distance). Figure 2C shows an example of power spectrum analysis of t-tubule signals from Figure 2A. The dominant frequency at ~0.5 μm−1 corresponds to the anticipated spatial distance of ~2 μm 12, representing t-tubule spacing in intact heart. We used the peak power value (in arbitrary unit, a.u.) at the dominant frequency as a quantitative index of t-tubule integrity (TTpower). On average, TTpower of sham-operated healthy hearts was 2.08±0.03 (N=7 hearts). In contrast, atrial cells from control rat hearts, which had sparse irregular t-tubule system (both left and right atria), did not show a dominant peak in FFT power spectrum (Online Figure I).
Impairment of T-tubule integrity begins before LV systolic dysfunction
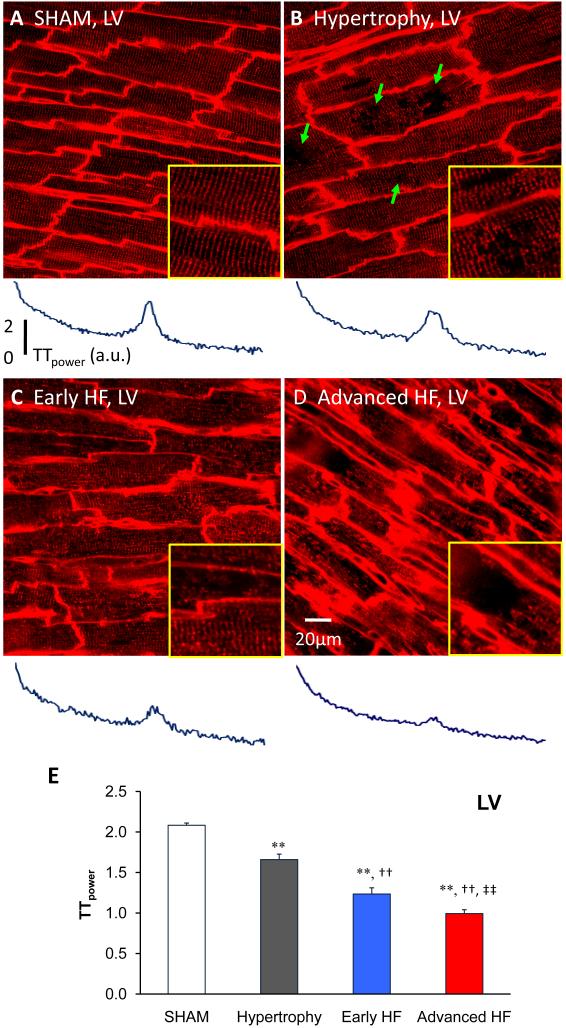
We next sought to determine the stage at which t-tubules begin to remodel after TAB, and the features of early t-tubule remodeling. Surprisingly, t-tubule remodeling began early at the compensated hypertrophy stage prior to LV dysfunction (Figure 3B, EF=77%). At the onset, this process was manifested as subcellular t-tubule loss limited to discrete local regions in some LV myocytes (arrows in Figure 3B). By using TTpower as a sensitive method to quantify the overall t-tubule integrity, we were able to detect subtle t-tubule structural reorganization, even in those with no visually discernible change in the regularity of t-tubule network (Figure 3B). Specifically, this reorganization was detected as a significant reduction in the average TTpower from in situ LV images (Figure 3E, 2.08±0.03, N=7 / sham LV versus 1.66±0.07, N=12 hearts / hypertrophy LV, p<0.01) (see also below and Figure 5). Our findings strongly suggest that t-tubule remodeling is an important early event that occurs in the LV at the stage of compensated hypertrophy, even though there is no ventricular dysfunction (as detected by echocardiography).
Figure 3. Progressive t-tubule remodeling of LV myocytes in TAB rat cardiomyopathy.
Representative t-tubule images from LV of age-matched sham operated heart (A), hypertrophy (B), early HF (C) and advanced HF (D). The bottom panels showed the power spectrums obtained from 2D Fourier transform of the raw images above. At hypertrophy stage (B), discrete T-tubule loss (green arrows) was often observed with slight t-tubule disorganization, which caused a mild decrease in TTpower. In moderately de-compensated heart (C), LV myocytes exhibited widely impaired t-tubule system and further decrease in TTpower. At advanced HF stage (D), myocytes lost majority of t-tubules with striated pattern almost vanished, resulting in severe reduction in TTpower. Each yellow-framed inset is a zoom-in view of an area 40×40 μm from associated images. E. Summarized data of LV myocyte t-tubule power (N=7, 12, 7, 7 hearts for sham, hypertrophy, early HF and advanced HF, respectively). Note: **, p<0.01 vs sham; †, p<0.05; ††, p<0.01 vs hypertrophy; ‡, p<0.05; ‡‡, p<0.01 vs early HF.
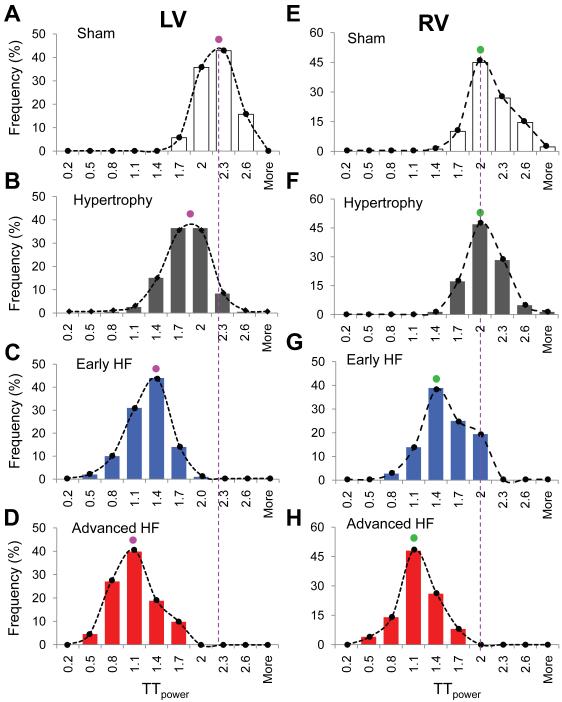
Figure 5. Histogram distribution of LV and RV myocyte TTpower.
A-D (LV), The count numbers at each bin size were normalized by the total images of each group and were shown as frequency. Each panel represents over a thousand of myocytes. An unambiguous, global population shift as well as mode shift was present from sham (A) to advanced HF (D), indicating global t-tubule structure reorganization occurred in both hypertrophy and HF stages. E-H (RV), Different from those of LV myocytes, the mode of RV TTpower distribution and global population were not shifted at hypertrophy stage (E&F). At early (G) and advanced HF (H) stages, a gradual leftward shift in RV TTpower distribution were observed, similar to that of LV myocytes.
Progressive t-tubule deterioration during HF progression
Next we sought to investigate how t-tubule remodeling evolves during the transition from hypertrophy to HF in intact heart. Figure 3CD shows representative t-tubule images at different stages during HF progression. As the hypertrophied heart became de-compensated with compromised LV function (Figure 3C, EF=61%), the t-tubule system showed a marked increase in the irregularity of t-tubule structure. At the advanced HF stage, the t-tubule system was severely disrupted, with dramatic loss of t-tubule signals and loss of the regular striated pattern (Figure 3D, EF=49.5%). This phenomenon was consistently observed in all of the hearts examined in each group. We defined images with TTpower equal or less than 1.3 as having a massively disrupted t-tubule system, and compared images across different stages. We found that from sham to advanced HF the percentages of acquired images from the LV with massive t-tubule disruption were 0% (0 out of 70), 10% (13 out of 129), 76% (62 out of 81) and 86% (67 out of 78) in sham, hypertrophy, early and advanced HF, respectively. On average, TTpower showed a continuous, decreasing function in LV myocytes during HF development (Figure 3E). These data demonstrate that the LV t-tubule system undergoes progressive deterioration during the developmental course from hypertrophy to HF.
Delayed t-tubule remodeling in RV myocytes in pressure overload-induced cardiomyopathy
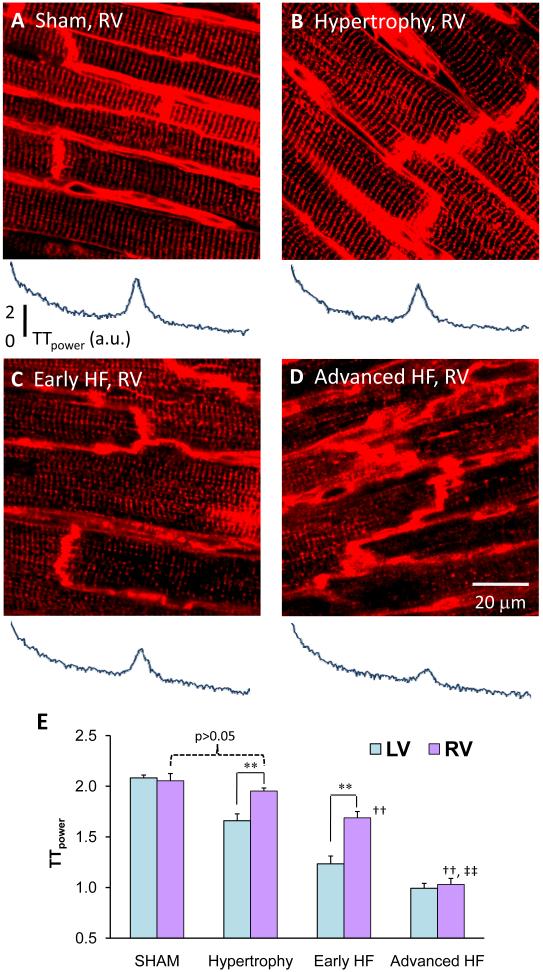
Normally, the t-tubule system of LV and RV myocytes in healthy heart appears to be indistinguishable and displays near identical TTpower (Figure 3A and 4A). Pressure overload induced cardiac hypertrophy due to TAB starts from the LV. During the compensated hypertrophy stage, LV myocytes showed loss of t-tubules with significantly reduced TTpower, but the t-tubule structure in RV myocytes remained unaffected (Figure 4AB). This indicates differential properties between LV and RV t-tubule remodeling in response to pressure overload at the hypertrophy stage. Interestingly, with the progression of disease t-tubule remodeling spreads from the LV to the RV. Figure 4 displays RV t-tubule images from hearts at different stages. As shown in Figure 4C, RV myocyte loss of t-tubules and their regular organization is first detectable at the early HF stage. However, at the advanced stage of HF (Figure 4D), the RV myocyte t-tubule system also showed severe disruption, similar to that seen in the LV. The percentages of RV t-tubule images with massive disruption (TTpower≤1.3) were 0% (1 out of 75), 1% (2 out of 136), 33% (24 out of 72) and 82% (62 out of 76) in sham (p>0.05 vs LV sham, Chi-test), hypertrophy (p<0.001 vs LV hypertrophy), early HF (p<0.001 vs LV early HF) and advanced HF (p>0.05 vs LV advanced HF), respectively. The summary data of TTpower (Figure 4E) further support the notion of differential temporal remodeling of the RV t-tubule system during the progression of TAB-induced HF.
Figure 4. Delayed t-tubule remodeling in RV myocytes.
Representative images acquired from RV epicardium at sham (A), hypertrophy (B), early HF (C) and advanced HF (D) stages. RV myocytes are highly comparable to those of LV in t-tubule structure organization (Figures 4A and 3A). Different from LV t-tubule remodeling (Figure 3B), RV myocytes remained unaffected in t-tubule structure at hypertrophy stage (4B). At early HF stage, RV myocytes started to lose t-tubules and their regular organization (4C), similar to that of LV myocytes at hypertrophy (3B). At advanced HF stages, both LV and RV myocytes were severely damaged (3D & 4D). Bottom panels beneath each image are corresponding power spectrum results. E. Comparison of the TTpower from LV and RV myocytes. RV myocytes from hypertrophy hearts had similar TTpower as RV of sham control (2.05±0.07, N=7 sham vs 1.95±0.03, N=12 hypertrophy, p>0.05), but had greater power than hypertrophied LV (1.66±0.07, p<0.01). At early HF stage, RV myocytes also had larger TTpower than LV (RV 1.69±0.06 vs LV 1.23±0.08, N=7, p<0.01). Note: **, p<0.01 for comparison between LV vs RV; ††, p<0.01 vs hypertrophy (RV); ‡‡, p<0.01 vs early HF (RV).
Global reorganization of t-tubule system in TAB induced hypertrophy and HF
The fact that a fraction of myocytes display massive t-tubule disruption during the progression of TAB-induced hypertrophy and HF raises an intriguing question: is there a subset of myocytes that are more vulnerable to the pressure overload stress? Or all myocytes are globally affected by the stress, in terms of t-tubule remodeling? To discriminate between these two possibilities, we analyzed the histogram distribution of TTpower from individual images of both LV and RV at different disease stages.
Under control conditions, TTpower in either LV or RV myocyte populations exhibited a single-mode (centered at 2.0-2.3), bell-shaped distribution (Figure 5A&E), suggesting that TTpower from all myocytes belong to one single population in the unstressed hearts. After the TAB stress, the entire histogram of LV TTpower shifted leftward in hypertrophied hearts. (centered between 1.7-2.0, Figure 5B). Nevertheless, the histogram retained its single-mode configuration, suggesting that the entire population of myocytes undergo t-tubule remodeling in a similar fashion. In particular, it is noteworthy that the highest LV TTpower (≥2.6) was decreased from 16% in sham to 1% in the hypertrophic hearts (Figure 5B). These data strongly suggest that, in addition to overt subcellular loss of t-tubules in a fraction of myocytes, the entire population of epicardial myocytes undergoes global t-tubule remodeling (in a manner that may not be detectable visually) early at the hypertrophy stage in response to TAB stress. As the disease progressed to early and advanced HF, we found that the TTpower histogram further shifted leftward while retaining a single mode of distribution in the LV (Figure 5C&D), further supporting the notion that the entire myocyte population examined behaves similarly during the progression of cardiomyopathy. Similar results were obtained with RV myocytes, except that the leftward shift of TTpower histogram in RV showed a clear delay than that of LV myocytes (Figure 5E&F). Taken together, these findings demonstrate global t-tubule structure reorganization at hypertrophy (LV) and HF stages (LV and RV) in myocyte response to pressure overload stress.
T-tubule remodeling correlates with LV function
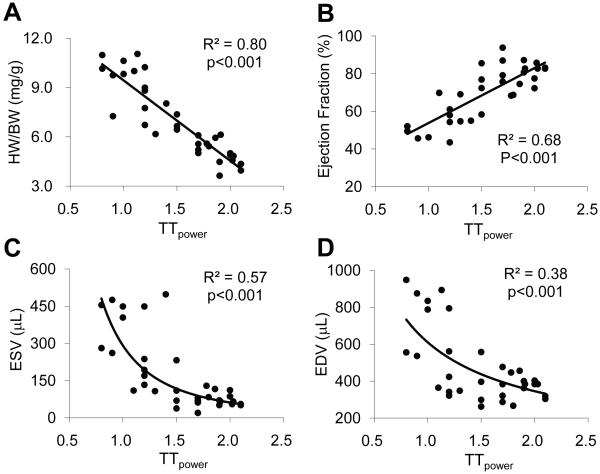
The role of the t-tubule system in EC coupling, particularly in triggering synchronous SR Ca2+ release and the consequence of t-tubule remodeling in isolated failing myocytes (e.g., dys-synchrony of SR Ca2+ release) are well recognized 11-15. However, the functional relationship between t-tubule structure and global LV systolic function is not well understood. We examined the correlation between the LV mean TTpower (which represents the overall t-tubule status of myocardium, assuming the mid- and endocardium myocytes share similar patterns in t-tubule remodeling during HF progression) with the corresponding cardiac morphometrics and performance. We found that LV TTpower displayed a strong negative correlation (R2=0.80, p<0.001) with HW/BW ratio (Figure 6A), an important index of cardiac hypertrophy, suggesting t-tubule remodeling is closely associated with the development of hypertrophy. Moreover, we found that LV TTpower correlated with LV EF in a positive linear function (R2=0.68, p<0.001, Figure 6B), suggesting that such t-tubule remodeling exerts an adverse effect on contractile function. Furthermore, we showed that the relationship between LV TTpower and end systolic volume (ESV, R2=0.57, p<0.001, Figure 6C), and end diastolic volume (EDV, R2=0.38, p<0.001, Figure 6D) was nicely fitted with a power function. These results reveal a heretofore unappreciated structure-function correlation between subcellular t-tubule remodeling and whole-animal cardiac performance during disease development.
Figure 6. Correlation between TTpower and LV function.
The LV TTpower was in good linear correlation with HW/BW ratio (R2=0.80, p<0.001) (A) and EF (R2=0.68, p<0.001) (B). Moreover, the LV TTpower was well fitted in power function with end systolic volume (ESV) (R2=0.57, p<0.001) (C) and end diastolic volume (EDV) (R2=0.38, p<0.001) (D).
JP-2 down-regulation in TAB hearts
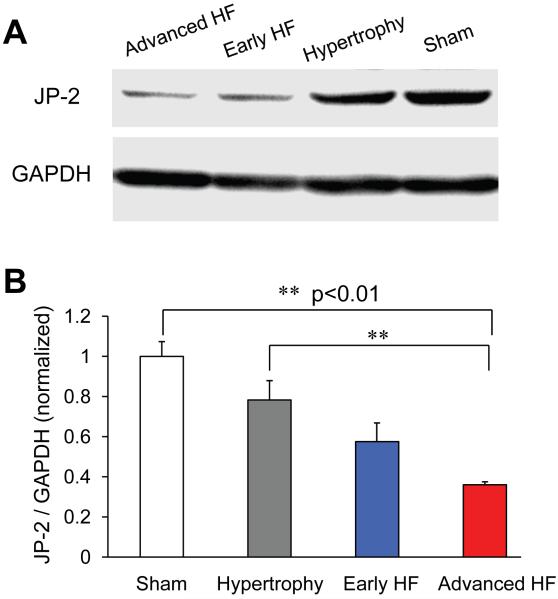
To investigate the molecular mechanism of t-tubule remodeling in pressure overload cardiomyopathy, we examined the protein level of JP-2, a member of the junctophilin protein family important for the formation of t-tubule – SR junctions 21, in LV tissues from frozen hearts. There was a progressive decrease in JP-2 protein level in LV tissues, starting from hypertrophy stage (Figure 7AB).
Figure 7. Junctophilin-2 (JP-2) down-regulation in TAB rats.
A, representative examples of JP-2 protein Western Blotting from LV frozen tissues at different disease stages and sham control. B, Summary results of normalized JP-2 protein expression level, showing a progressively reduction in JP-2 protein level in rats in response to pressure overload stress (N=5, 4, 2, 3 hearts for sham, hypertrophy, early HF and advanced HF, respectively).
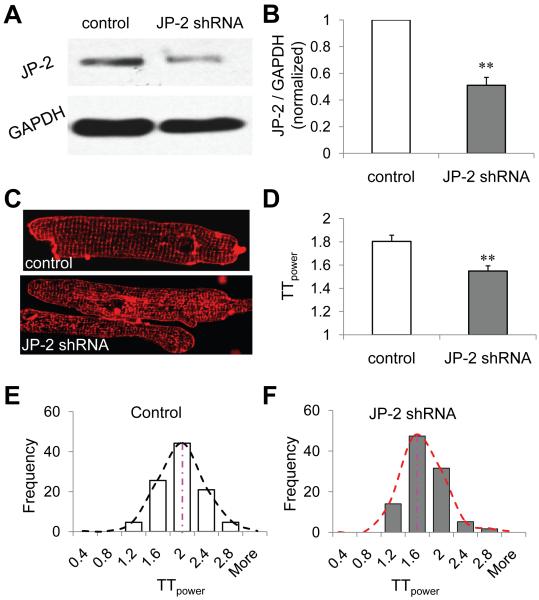
To examine if JP-2 loss contributes to t-tubule remodeling observed in pressure overload disease, we used recombinant lentivirus carrying JP-2 shRNA to silence JP-2 expression in cultured adult mouse ventricular myocytes. After 64 hours of transfection, JP2-shRNA knocked down the expression level of JP-2 to 51% of that of myocytes transfected with control vectors containing a scrambled shRNA sequence (control) (Figure 8AB). JP-2 shRNA infected myocytes displayed a significant reduction in t-tubule power compared to the control group (Figure 8CD, n=43 and 57 cells for scramble control and JP-2 shRNA groups, respectively, p<0.01), with a leftward shift in the t-tubule power histogram (Figure 8EF). These data indicate that JP-2 downregulation may be involved in t-tubule remodeling in pressure overload cardiomyopathy.
Figure 8. JP-2 knockdown caused a significant reduction in TTpower in cultured mouse ventricular myocytes.
A&B, JP-2 shRNA (64 hrs) knocked down the protein expression level of JP-2 by 49% (n=4, 4 for both control and JP-2 shRNA groups, p<0.01). C&D, JP-2 shRNA transfected myocytes had worse t-tubule organization and a significant reduction in t-tubule integrity than control (p<0.01). E&F, JP-2 shRNA knockdown shifted the TTpower histogram leftward, in comparison with that of scrambled control shRNA infected myocytes (n=57 and 43 cells, respectively).
Discussion
In the present study, using TAB rat model in combination with state-of-the-art confocal imaging technique and a novel method to analyze t-tubule integrity, we examined the developmental changes of myocyte t–tubule system during the progression of hypertrophy and HF. The major findings of our study are as the following: 1) Myocytes at the compensated hypertrophy stage already display disruptive t-tubule remodeling, characterized by discrete local t-tubule loss and global t-tubule structural reorganization; 2) This deleterious structure remodeling progressively worsens as the disease develops, with massive t-tubule disruption at advanced HF; 3) A differential t-tubule remodeling process was observed between LV and RV myocytes; 4) T-tubule structural remodeling is highly correlated with the degree of hypertrophy; 5) The severity of t-tubule disorganization is strongly correlated with global LV function and loss of JP-2 expression.
In situ confocal imaging of t-tubule structure
The t-tubule system is a specialized membrane network, playing important roles in membrane excitation, SR Ca2+ release activation, muscle contraction, and signal transduction 22. Early studies on t-tubule structure were based on electron microscopy (EM). EM studies with high spatial resolution have provided important information about t-tubule structure in normal myocardium 23-24, and in hypertrophied heart 25. However, the sophisticated EM technique cannot provide a complete picture of the t-tubule system. Recently, several groups have used confocal microscopy to investigate t-tubule structure in health and disease 11-15, 26-33. All these studies were performed in single isolated myocytes. Enzymatic dissociation of myocytes may impair the t-tubule membrane of healthy cells 34. It is also very likely that those myocytes with severely damaged t-tubule membrane may be more fragile due to enzyme digestion, mechanical stirring, Ca2+ unloading and reloading during myocyte isolation process 35. Thus, it is possible that enzymatic isolation may yield predominantly (relatively) healthy myocytes and myocytes isolated from healthy hearts may display varying degrees of t-tubule change (see Figure 2A of reference 15, by Heinzel et al, 2008). Taken together, these factors intrinsic to the isolation of cardiomyocytes are an obstacle to identifying subtle changes in t-tubule membrane structure, as we observed here in hypertrophied hearts. Membrane damage due to cell isolation techniques could explain the inconsistent results reported previously in human failing hearts 29, 33. In this study, we examined myocyte t-tubule structure using a novel in situ confocal imaging technique combined with Langendorff-perfused hearts. In doing so, we were able to avoid damage to the t-tubule system linked to myocyte dissociation. Additionally, this technique allows us to visualize a large number of myocytes collectively and to measure myocytes from different epicardial regions in situ. It also allowed measurement of early, subtle alterations and severe disruption of t-tubule structure (Figures 3 and 4).
(Ultra)-structural T-tubule remodeling in heart diseases
In animals, He et al. first identified a significant loss of t-tubule density (without t-tubule disorganization) in ventricular myocytes from a dog model with pacing-induced HF 28. Subsequently, other studies (including ours 12) using other animal HF models have reported profound t-tubule remodeling (loss and/or disorganization) in single isolated failing myocytes. These other animal models include spontaneous hypertensive rats with overt HF 12, mouse myocardial infarction 13, pig myocardial infarction 15, sheep rapid pacing HF model 16. In human, early reports with histological examination in failing heart tissue sections showed t-tubule dilation with an increase 36 or decrease 37 in the density of t-tubules. Other preliminary reports also presented inconsistent findings 29, 33. A very recent study using both scanning ion conductance microscope and confocal microscope helped resolve the discrepancy in early reports. T-tubule loss was pronounced in failing ventricular myocytes from all HF patients (ischemic heart disease, idiopathic dilated cardiomyopathy, and hypertrophic obstructive cardiomyopathy) 14. From a spectrum of etiological settings in both human and animal models, these studies had drawn similar conclusions, indicating that t-tubule remodeling is a principal problem in many heart diseases, especially at end stage HF. However, all these studies (including those human studies and our previous 12-15, 27-29, 33) were done in myocytes at advanced HF stage. Our findings showed that t-tubule remodeling occurs prior to the onset of HF, suggesting t-tubule remodeling is not a secondary modification after HF, rather an important early event during HF progression.
T-tubule remodeling in the transition from hypertrophy to HF
The deleterious consequence of t-tubule remodeling on EC coupling in HF has been carefully explored in several elegant studies 12-13, 15. T-tubule loss and / or disorganization has been directly linked to dyssynchronous Ca2+ sparks, reduced and slowed Ca2+ transients during EC coupling in failing myocytes 12-13, 15. Using spontaneously hypertensive rats in HF, we showed that t-tubule disorganization led to an increase in orphaned RyRs and loss of local control of CICR, resulting in decreased EC coupling efficacy and increased dyssynchrony of SR Ca2+ release in failing myocytes. A recent study from Sipido’s group reported similar findings in an ischemic cardiomyopathy pig model where t-tubule loss was associated with reduced synchrony of Ca2+ release and reduced efficiency of coupling Ca2+ influx to Ca2+ release 15. Very recently, t-tubule remodeling and Ca2+ release dysfunction were also found in atrial myocytes from a rapid-pacing induced sheep HF model 16. These experimental findings were also supported by computer modeling, in which t-tubule reorganization can reduce the synchrony of Ca2+ spark production, lead to the appearance of late Ca2+ sparks and greater nonuniformity of intracellular Ca2+ 38.
It is surprising that hypertrophied heart with normal global function already showed some degree of t-tubule remodeling. This might be related to large cardiac reserve function: no apparent cardiac functional phenotype even when structural remodeling costs ever diminishing cardiac reserve function. Specifically, cardiac hypertrophy in response to pressure overload involves many compensatory, molecular and biochemical mechanisms 39-40 that may account for compensating and maintaining normal heart function during hypertrophy stage. For example, increase in cell size and in the number of sarcomere units 41-42 (originated from those molecular and biochemical signaling alterations), may also contribute to compensating the negative effect of t-tubule loss on SR Ca2+ release and myocyte contractility, resulting into a maintained myocardial function in hypertrophy. However, these compensating mechanisms ultimately are apparently ineffective for balancing the defects caused by more severely damaged t-tubule system as structural heart disease progresses. The progressive deterioration of t-tubule structure throughout the disease development, and the strong correlation between t-tubule remodeling and LV function support the notion that t-tubule remodeling is a critical factor during the transition from compensated hypertrophy to HF.
Molecular mechanisms underlying t-tubule remodeling in TAB induced cardiomyopathy
JP-2 is a member of the junctophilin protein family important for the formation of junctional membrane complex (i.e., the cardiac dyad) between t-tubule membrane and SR 21, 43-45. JP-2 mutations were associated with human hypertrophic cardiomyopathy 46-47 and JP-2 knockout mice have defective cardiac dyads, altered intracellular calcium transients, and embryonic lethality 21. JP-2 mRNA expression was reduced in hypertrophied rats 48 and mouse cardiomyopathy model 49, but it was unknown if JP-2 expression is affected in accord with t-tubular remodeling during progression of structural heart disease. Our results show that t-tubule remodeling correlates with the loss of JP-2 expression in left ventricular myocytes of pressure overload model and that JP-2 knockdown (by 50%) reduces t-tubule integrity in cultured myocytes, suggesting that reduced JP-2 expression may be important in mediating t-tubule remodeling in pressure overload cardiomyopathy. However, it’s recognized that there is no report about the heterozygous phenotype of JP-2 mutants 21. Careful examination of JP-2 heterozygous mice (at rest and under stress) and, more ideally, future studies with inducible JP-2 knockout / knockdown mice should provide further critical information on JP-2 functions in cardiac health and disease.
In summary, for the first time we identified t-tubule adverse remodeling in intact hearts during compensated hypertrophy stage, and mapped the t-tubule change to the progression of myocardial disease in a temporally and functionally defined disease model. T-tubule disruptive remodeling is a critical event during the development of hypertrophy that are tightly associated with the declining of myocardial function and transition from compensated hypertrophy to HF.
Novelty and Significance.
What is known?
T-tubule system is an organized membrane network important for normal cardiac excitation-contraction coupling.
End-stage heart failure of animal models or human patients associated with T-tubule remodeling / disorganization.
T-tubule remodeling causes Ca2+ release and cell signaling dysfunction in isolated cardiomyocytes.
What new information does this article contribute?
The first detailed methods for in situ t-tubule imaging on intact heart and quantitative analysis of t-tubule structure.
T-tubule alteration starts early in compensated hypertrophy stage, featuring discrete local loss and global reorganization of the affected myocardium.
T-tubule remodeling gradually deteriorates over the progression of heart disease, correlates with the severity of cardiac hypertrophy and predicts heart function.
T-tubule remodeling represents a key mechanism underlying the transition from compensated hypertrophy to heart failure.
Junctophilin-2 (JP-2) downregulation is likely responsible for t-tubule remodeling in cardiomyopathy.
Summary
T-tubule system is a highly organized membrane network in working mammalian ventricular myocytes. The maintenance of this specialized membrane structure is critical for normal contractile function and the pumping capability of the beating heart. Reduction in t-tubule density and organization has been linked to abnormal Ca2+ function and decreased contractility in end-stage heart failure. However, it is unknown whether t-tubule alterations are an early or late event in heart failure. The lack of studies of t-tubule changes prior to hear failure onset is a critical knowledge gap in understanding heart failure. It is also not clear whether changes in t-tubule structure are related to cardiac function during progression from hypertrophy to heart failure. In this study, we provided evidence showing that t-tubule remodeling is an important early event during heart failure progression, starting at compensated hypertrophy stage. Our data support the hypothesis that t-tubule remodeling may constitute an important mechanism underlying the transition from compensated hypertrophy to decompensated heart failure, indicating that preventing t-tubule remodeling during the hypertrophy stage may be clinically important for delaying progression to heart failure. Moreover, we present evidence linking for the first time a single molecule (JP-2) to reduced t-tubule integrity during heart failure. These findings suggest -new therapeutic strategies for the treatment of heart failure.
Supplementary Material
Acknowledgements
We would like to acknowledge the Albaghdadi family for their generous gifts which allowed us to purchase the Carl Zeiss laser scanning confocal microscope. The authors would like to thank Dr. W. J. Lederer (University of Maryland Baltimore) for his kind, continuous support in this project. The authors also wish to thank Dr. Mei-Ling Joiner (University of Iowa, Internal Medicine) for her help in western blotting experiments, and Dr. Gail Bishop (University of Iowa Cancer Center) for allowing us to use Fuji Imaging System (LAS-3000). The authors thank Drs. Christopher Benson, Thomas Hund and Peter Mohler (University of Iowa, Internal Medicine) for their careful reading, comments or discussions on the manuscript.
Funding resources
This work was supported by NIH R01 HL090905 (L.S.S.) and American Heart Association Scientific Development Grant 0635056N (L.-S.S.), and Chinese Scholarship Council (S.W.).
Non-standard Abbreviations and Acronyms
- t-tubule
Transverse-tubule
- HF
Heart Failure
- TAB
Thoracic aortic banding
- TTpower
t-tubule power
- LV
left ventricular / ventricle
- RV
right ventricular / ventricle
- JP-2
junctophilin-2
- SR
sarcoplasmic reticulum
- RyR
ryanodine receptor
- EF
ejection fraction
- ESV
End systolic volume
- EDV
End diastolic volume
- HW/BW
heart weight / body weight ratio
Footnotes
Disclosures
No conflict of interest to be disclosed.
Subject codes: [104]; [148]; [149];
This is a PDF file of an unedited manuscript that has been accepted for publication. As a service to our customers we are providing this early version of the manuscript. The manuscript will undergo copyediting, typesetting, and review of the resulting proof before it is published in its final citable form. Please note that during the production process errors may be discovered which could affect the content, and all legal disclaimers that apply to the journal pertain.
REFERENCE
- 1.Wang SQ, Song LS, Lakatta EG, Cheng H. Ca2+ signalling between single L-type Ca2+ channels and ryanodine receptors in heart cells. Nature. 2001;410:592–596. doi: 10.1038/35069083. [DOI] [PubMed] [Google Scholar]
- 2.Song LS, Guatimosim S, Gomez-Viquez L, Sobie EA, Ziman A, Hartmann H, Lederer WJ. Calcium biology of the transverse tubules in heart. Ann.N.Y.Acad.Sci. 2005;1047:99–111. doi: 10.1196/annals.1341.009. [DOI] [PMC free article] [PubMed] [Google Scholar]
- 3.Brette F, Orchard C. T-tubule function in mammalian cardiac myocytes. Circ.Res. 2003;92:1182–1192. doi: 10.1161/01.RES.0000074908.17214.FD. [DOI] [PubMed] [Google Scholar]
- 4.Bers DM, Eisner DA, Valdivia HH. Sarcoplasmic reticulum Ca2+ and heart failure: roles of diastolic leak and Ca2+ transport. Circ.Res. 2003;93:487–490. doi: 10.1161/01.RES.0000091871.54907.6B. [DOI] [PubMed] [Google Scholar]
- 5.Houser SR, Margulies KB. Is depressed myocyte contractility centrally involved in heart failure? Circ.Res. 2003;92:350–358. doi: 10.1161/01.RES.0000060027.40275.A6. [DOI] [PubMed] [Google Scholar]
- 6.Bito V, Heinzel FR, Biesmans L, Antoons G, Sipido KR. Crosstalk between L-type Ca2+ channels and the sarcoplasmic reticulum: alterations during cardiac remodelling. Cardiovasc Res. 2008;77:315–324. doi: 10.1093/cvr/cvm063. [DOI] [PubMed] [Google Scholar]
- 7.Yano M, Ikeda Y, Matsuzaki M. Altered intracellular Ca2+ handling in heart failure. J Clin Invest. 2005;115:556–564. doi: 10.1172/JCI24159. [DOI] [PMC free article] [PubMed] [Google Scholar]
- 8.Bers DM. Altered cardiac myocyte Ca regulation in heart failure. Physiology (Bethesda) 2006;21:380–387. doi: 10.1152/physiol.00019.2006. [DOI] [PubMed] [Google Scholar]
- 9.Harris DM, Mills GD, Chen X, Kubo H, Berretta RM, Votaw VS, Santana LF, Houser SR. Alterations in early action potential repolarization causes localized failure of sarcoplasmic reticulum Ca2+ release. Circ.Res. 2005;96:543–550. doi: 10.1161/01.RES.0000158966.58380.37. [DOI] [PubMed] [Google Scholar]
- 10.Wehrens XH, Lehnart SE, Reiken S, Vest JA, Wronska A, Marks AR. Ryanodine receptor/calcium release channel PKA phosphorylation: a critical mediator of heart failure progression. Proc.Natl.Acad.Sci.U.S.A. 2006;103:511–518. doi: 10.1073/pnas.0510113103. [DOI] [PMC free article] [PubMed] [Google Scholar]
- 11.Louch WE, Bito V, Heinzel FR, Macianskiene R, Vanhaecke J, Flameng W, Mubagwa K, Sipido KR. Reduced synchrony of Ca2+ release with loss of T-tubules-a comparison to Ca2+ release in human failing cardiomyocytes. Cardiovasc Res. 2004;62:63–73. doi: 10.1016/j.cardiores.2003.12.031. [DOI] [PubMed] [Google Scholar]
- 12.Song LS, Sobie EA, McCulle S, Lederer WJ, Balke CW, Cheng H. Orphaned ryanodine receptors in the failing heart. Proc.Natl.Acad.Sci.U.S.A. 2006;103:4305–4310. doi: 10.1073/pnas.0509324103. [DOI] [PMC free article] [PubMed] [Google Scholar]
- 13.Louch WE, Mork HK, Sexton J, Stromme TA, Laake P, Sjaastad I, Sejersted OM. T-tubule disorganization and reduced synchrony of Ca2+ release in murine cardiomyocytes following myocardial infarction. J Physiol. 2006;574:519–533. doi: 10.1113/jphysiol.2006.107227. [DOI] [PMC free article] [PubMed] [Google Scholar]
- 14.Lyon AR, MacLeod KT, Zhang Y, Garcia E, Kanda GK, Lab MJ, Korchev YE, Harding SE, Gorelik J. Loss of T-tubules and other changes to surface topography in ventricular myocytes from failing human and rat heart. Proc Natl Acad Sci U S A. 2009;106:6854–6859. doi: 10.1073/pnas.0809777106. [DOI] [PMC free article] [PubMed] [Google Scholar]
- 15.Heinzel FR, Bito V, Biesmans L, Wu M, Detre E, von Wegner F, Claus P, Dymarkowski S, Maes F, Bogaert J, Rademakers F, D’Hooge J, Sipido K. Remodeling of T-tubules and reduced synchrony of Ca2+ release in myocytes from chronically ischemic myocardium. Circ Res. 2008;102:338–346. doi: 10.1161/CIRCRESAHA.107.160085. [DOI] [PubMed] [Google Scholar]
- 16.Dibb KM, Clarke JD, Horn MA, Richards MA, Graham HK, Eisner DA, Trafford AW. Characterization of an extensive transverse tubular network in sheep atrial myocytes and its depletion in heart failure. Circ Heart Fail. 2009;2:482–489. doi: 10.1161/CIRCHEARTFAILURE.109.852228. [DOI] [PubMed] [Google Scholar]
- 17.Brette F, Despa S, Bers DM, Orchard CH. Spatiotemporal characteristics of SR Ca(2+) uptake and release in detubulated rat ventricular myocytes. J.Mol.Cell Cardiol. 2005;39:804–812. doi: 10.1016/j.yjmcc.2005.08.005. [DOI] [PubMed] [Google Scholar]
- 18.Brette F, Rodriguez P, Komukai K, Colyer J, Orchard CH. beta-adrenergic stimulation restores the Ca transient of ventricular myocytes lacking t-tubules. J.Mol.Cell Cardiol. 2004;36:265–275. doi: 10.1016/j.yjmcc.2003.11.002. [DOI] [PubMed] [Google Scholar]
- 19.del Monte F, Butler K, Boecker W, Gwathmey JK, Hajjar RJ. Novel technique of aortic banding followed by gene transfer during hypertrophy and heart failure. Physiol Genomics. 2002;9:49–56. doi: 10.1152/physiolgenomics.00035.2001. [DOI] [PubMed] [Google Scholar]
- 20.Francis J, Weiss RM, Wei SG, Johnson AK, Felder RB. Progression of heart failure after myocardial infarction in the rat. Am J Physiol Regul Integr Comp Physiol. 2001;281:R1734–1745. doi: 10.1152/ajpregu.2001.281.5.R1734. [DOI] [PubMed] [Google Scholar]
- 21.Takeshima H, Komazaki S, Nishi M, Iino M, Kangawa K. Junctophilins: a novel family of junctional membrane complex proteins. Mol.Cell. 2000;6:11–22. doi: 10.1016/s1097-2765(00)00003-4. [DOI] [PubMed] [Google Scholar]
- 22.Bers DM. Excitation-Contraction Coupling and Cardiac Contractile Force. Kluwer Academic Publishers; Boston: 2001. [Google Scholar]
- 23.Sun XH, Protasi F, Takahashi M, Takeshima H, Ferguson DG, Franzini-Armstrong C. Molecular architecture of membranes involved in excitation-contraction coupling of cardiac muscle. J.Cell Biol. 1995;129:659–671. doi: 10.1083/jcb.129.3.659. [DOI] [PMC free article] [PubMed] [Google Scholar]
- 24.Franzini-Armstrong C, Protasi F, Ramesh V. Shape, size, and distribution of Ca(2+) release units and couplons in skeletal and cardiac muscles. Biophys.J. 1999;77:1528–1539. doi: 10.1016/S0006-3495(99)77000-1. [DOI] [PMC free article] [PubMed] [Google Scholar]
- 25.Page E, McCallister LP. Quantitative electron microscopic description of heart muscle cells: Application to normal, hypertrophied and thyroxin-stimulated hearts. American Journal of Cardiology. 1973;31:172–181. doi: 10.1016/0002-9149(73)91030-8. [DOI] [PubMed] [Google Scholar]
- 26.Soeller C, Cannell MB. Examination of the transverse tubular system in living cardiac rat myocytes by 2-photon microscopy and digital image-processing techniques. Circ.Res. 1999;84:266–275. doi: 10.1161/01.res.84.3.266. [DOI] [PubMed] [Google Scholar]
- 27.Balijepalli RC, Lokuta AJ, Maertz NA, Buck JM, Haworth RA, Valdivia HH, Kamp TJ. Depletion of T-tubules and specific subcellular changes in sarcolemmal proteins in tachycardia-induced heart failure. Cardiovasc.Res. 2003;59:67–77. doi: 10.1016/s0008-6363(03)00325-0. [DOI] [PubMed] [Google Scholar]
- 28.He J, Conklin MW, Foell JD, Wolff MR, Haworth RA, Coronado R, Kamp TJ. Reduction in density of transverse tubules and L-type Ca(2+) channels in canine tachycardia-induced heart failure. Cardiovasc.Res. 2001;49:298–307. doi: 10.1016/s0008-6363(00)00256-x. [DOI] [PubMed] [Google Scholar]
- 29.Wong C, Soeller C, Burton L, Cannell MB. Changes in transversetubular system architecture in myocytes from diseased human ventricles. Biophysical Journal. 2001;80:588a. [Google Scholar]
- 30.Savio-Galimberti E, Frank J, Inoue M, Goldhaber JI, Cannell MB, Bridge JH, Sachse FB. Novel features of the rabbit transverse tubular system revealed by quantitative analysis of three-dimensional reconstructions from confocal images. Biophys J. 2008;95:2053–2062. doi: 10.1529/biophysj.108.130617. [DOI] [PMC free article] [PubMed] [Google Scholar]
- 31.Sachse FB, Savio-Galimberti E, Goldhaber JI, Bridge JH. Towards computational modeling of excitation-contraction coupling in cardiac myocytes: reconstruction of structures and proteins from confocal imaging. Pac Symp Biocomput. 2009:328–339. doi: 10.1142/9789812836939_0031. [DOI] [PMC free article] [PubMed] [Google Scholar]
- 32.Chen X, Wilson RM, Kubo H, Berretta RM, Harris DM, Zhang X, Jaleel N, MacDonnell SM, Bearzi C, Tillmanns J, Trofimova I, Hosoda T, Mosna F, Cribbs L, Leri A, Kajstura J, Anversa P, Houser SR. Adolescent feline heart contains a population of small, proliferative ventricular myocytes with immature physiological properties. Circ Res. 2007;100:536–544. doi: 10.1161/01.RES.0000259560.39234.99. [DOI] [PubMed] [Google Scholar]
- 33.Ohler A, Houser SR, Tomaselli GF, O’Rourke B. Transverse tubules are unchanged in myocytes from failing human hearts. Biophysical Journal. 2001;80:590a. [Google Scholar]
- 34.Houser SR. Reduced abundance of transverse tubules and L-type calcium channels: another cause of defective contractility in failing ventricular myocytes. Cardiovasc.Res. 2001;49:253–256. doi: 10.1016/s0008-6363(00)00305-9. [DOI] [PubMed] [Google Scholar]
- 35.Hatem S. Does the loss of transverse tubules contribute to dyssynchronous Ca2+ release during heart failure? Cardiovasc.Res. 2004;62:1–3. doi: 10.1016/j.cardiores.2004.01.037. [DOI] [PubMed] [Google Scholar]
- 36.Kaprielian RR, Stevenson S, Rothery SM, Cullen MJ, Severs NJ. Distinct patterns of dystrophin organization in myocyte sarcolemma and transverse tubules of normal and diseased human myocardium. Circulation. 2000;101:2586–2594. doi: 10.1161/01.cir.101.22.2586. [DOI] [PubMed] [Google Scholar]
- 37.Kostin S, Scholz D, Shimada T, Maeno Y, Mollnau H, Hein S, Schaper J. The internal and external protein scaffold of the T-tubular system in cardiomyocytes. Cell Tissue Res. 1998;294:449–460. doi: 10.1007/s004410051196. [DOI] [PubMed] [Google Scholar]
- 38.Cannell MB, Crossman DJ, Soeller C. Effect of changes in action potential spike configuration, junctional sarcoplasmic reticulum micro-architecture and altered t-tubule structure in human heart failure. J Muscle Res Cell Motil. 2006;27:297–306. doi: 10.1007/s10974-006-9089-y. [DOI] [PubMed] [Google Scholar]
- 39.Morisco C, Sadoshima J, Trimarco B, Arora R, Vatner DE, Vatner SF. Is treating cardiac hypertrophy salutary or detrimental: the two faces of Janus. Am.J.Physiol Heart Circ.Physiol. 2003;284:H1043–H1047. doi: 10.1152/ajpheart.00990.2002. [DOI] [PubMed] [Google Scholar]
- 40.Frey N, Olson EN. CARDIAC HYPERTROPHY: The Good, the Bad, and the Ugly. Annu.Rev.Physiol. 2003;65:45–79. doi: 10.1146/annurev.physiol.65.092101.142243. 45-79. [DOI] [PubMed] [Google Scholar]
- 41.Gerdes AM. Cardiac myocyte remodeling in hypertrophy and progression to failure. J Card Fail. 2002;8:S264–268. doi: 10.1054/jcaf.2002.129280. [DOI] [PubMed] [Google Scholar]
- 42.Wang X, Li F, Campbell SE, Gerdes AM. Chronic pressure overload cardiac hypertrophy and failure in guinea pigs: II. Cytoskeletal remodeling. J.Mol.Cell Cardiol. 1999;31:319–331. doi: 10.1006/jmcc.1998.0885. [DOI] [PubMed] [Google Scholar]
- 43.Ziman AP, Gomez-Viquez NL, Bloch RJ, Lederer WJ. Excitation-contraction coupling changes during postnatal cardiac development. J Mol Cell Cardiol. 2010;48:379–386. doi: 10.1016/j.yjmcc.2009.09.016. [DOI] [PMC free article] [PubMed] [Google Scholar]
- 44.Garbino A, van Oort RJ, Dixit SS, Landstrom AP, Ackerman MJ, Wehrens XH. Molecular evolution of the junctophilin gene family. Physiol Genomics. 2009;37:175–186. doi: 10.1152/physiolgenomics.00017.2009. [DOI] [PMC free article] [PubMed] [Google Scholar]
- 45.Hirata Y, Brotto MD, Weisleder N, Chu Y, Lin P, Zhao X, Thornton A, Komazaki S, Takeshima H, Ma J, Pan Z. Uncoupling Store-Operated Ca2+ Entry and Altered Ca2+ Release from Sarcoplasmic Reticulum Through Silencing of Junctophilin Genes. Biophys.J. 2006 doi: 10.1529/biophysj.105.076570. [DOI] [PMC free article] [PubMed] [Google Scholar]
- 46.Landstrom AP, Weisleder N, Batalden KB, Bos JM, Tester DJ, Ommen SR, Wehrens XH, Claycomb WC, Ko JK, Hwang M, Pan Z, Ma J, Ackerman MJ. Mutations in JPH2-encoded junctophilin-2 associated with hypertrophic cardiomyopathy in humans. J Mol Cell Cardiol. 2007;42:1026–1035. doi: 10.1016/j.yjmcc.2007.04.006. [DOI] [PMC free article] [PubMed] [Google Scholar]
- 47.Matsushita Y, Furukawa T, Kasanuki H, Nishibatake M, Kurihara Y, Ikeda A, Kamatani N, Takeshima H, Matsuoka R. Mutation of junctophilin type 2 associated with hypertrophic cardiomyopathy. J Hum Genet. 2007;52:543–548. doi: 10.1007/s10038-007-0149-y. [DOI] [PubMed] [Google Scholar]
- 48.Xu M, Zhou P, Xu SM, Liu Y, Feng X, Bai SH, Bai Y, Hao XM, Han Q, Zhang Y, Wang SQ. Intermolecular failure of L-type Ca2+ channel and ryanodine receptor signaling in hypertrophy. PLoS Biol. 2007;5:e21. doi: 10.1371/journal.pbio.0050021. [DOI] [PMC free article] [PubMed] [Google Scholar]
- 49.Minamisawa S, Oshikawa J, Takeshima H, Hoshijima M, Wang Y, Chien KR, Ishikawa Y, Matsuoka R. Junctophilin type 2 is associated with caveolin-3 and is down-regulated in the hypertrophic and dilated cardiomyopathies. Biochem.Biophys.Res.Commun. 2004;325:852–856. doi: 10.1016/j.bbrc.2004.10.107. [DOI] [PubMed] [Google Scholar]
Associated Data
This section collects any data citations, data availability statements, or supplementary materials included in this article.


