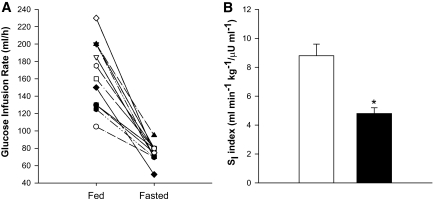
FIG. 2.
Assessment of insulin sensitivity by hyperinsulinemic-euglycemic clamping after 60 h of fasting. A represents the individual data for the glucose infusion rate. B displays the group results of the insulin sensitivity index, i.e., the glucose infusion rate corrected for body weight, glucose, and plasma insulin levels during the clamp procedure. The white bar represents the fed condition whereas the black bar depicts the fasted condition. Values are mean ± SE. *P < 0.05. SI, insulin sensitivity index.

