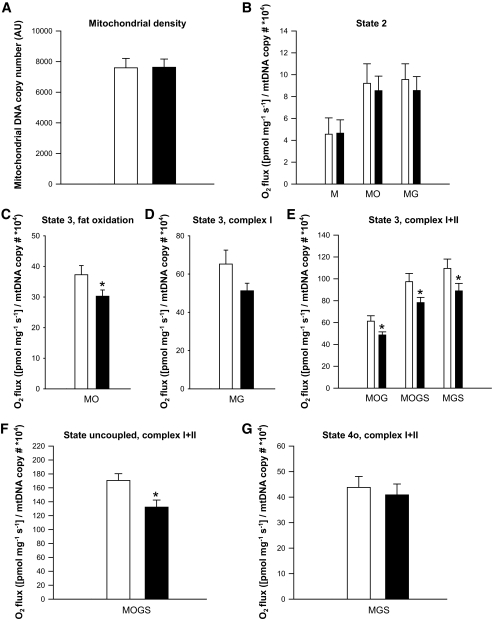
FIG. 5.
Evaluation of mitochondrial function. A: Mitochondrial density. B: Mitochondrial respiration upon substrates only (state 2). C: ADP-stimulated respiration (state 3) upon a lipid substrate. D: State 3 respiration fueled by Complex I-linked substrates. E: State 3 respiration upon parallel electron input into Complex I and II. F: Maximally uncoupled respiration upon FCCP. G: Mitochondrial respiration uncoupled from ATP synthesis (state 4o). White bars represent the fed condition, black bars represent the fasted condition. Values are mean ± SE, n = 10. *P < 0.05. M, malate; O, octanoyl-carnitine; G, glutamate; S, succinate.

