Abstract
The purpose of this research was to develop a novel numerical procedure to deconvolute arterial input function from contrast concentration vs. time curves and to obtain the impulse response functions from dynamic contrast enhanced MRI data. Numerical simulations were performed to study variations of contrast concentration vs. time curves and the corresponding impulse response functions. The simulated contrast media concentration curves were generated by varying the parameters of an empirical mathematical model within reasonable ranges based on a previous experimental study. The arterial input function was calculated from plots of contrast media concentration vs. time in muscle under assumption that they are well approximated by the two-compartment model. A general simple mathematical model of the impulse response function was developed and the physiological meaning of the model parameters was determined by comparing them with the widely accepted ‘two compartment model’. The results demonstrate that the deconvolution procedure developed in this research is a simple, robust, and useful technique. In addition, ‘impulse response analysis’ leads to the derivation of novel parameters relating to tumor vascular architecture, and these new parameters may have clinical utility.
Keywords: Deconvolution, impulse response function, perfusion, DCE-MRI, arterial input function
INTRODUCTION
Dynamic contrast enhanced MRI (DCEMRI) detects early cancer based on rapid uptake and washout of contrast media. The clinical importance of DCEMRI for detection of cancers is increasing – particularly for breast cancer screening and diagnosis (1,2). Regular MRI scans are recommended for people who are at high risk for breast cancer (3). Early detection of malignant breast tumors when they are small and relatively easy to treat may significantly decrease morbidity and mortality, and in addition significantly reduce the financial cost of treatment. However, methods currently available to analyze the DCEMRI data have poor specificity and yield many false positives (4). In addition, improvements are needed in sensitivity of DCEMRI to early pre-invasive cancers (5).
DCEMRI data are frequently analyzed clinically based on the change in signal-intensity as a function of time following contrast injection. The change in signal intensity is evaluated using qualitative parameters, for example using the Kuhl classification system (6), or using semi-quantitative parameters related to contrast media uptake and washout. More quantitative analysis is based on the change in contrast media concentration as a function of time (7) to reduce sensitivity to instrumental/pulse sequence characteristics. The kinetics of contrast media uptake and washout can be evaluated using ‘model-free’ approaches such as the ‘area under the curve’ (8), or the empirical mathematical model (EMM) (9) developed in this laboratory. Alternatively, physiological models can be used to extract parameters more directly related to perfusion/capillary permeability. The two-compartment model (TCM) is widely accepted (10) and is used to fit DCEMRI data and extract physiological parameters that are markers for disease. This model assumes that tissue can be modeled as two well-mixed compartments – a vascular and an extra-vascular extra-cellular compartment. However, tumors are generally heterogeneous, and are not well approximated by two well mixed compartments. As a result, the TCM often does not provide good fits to experimental data from tumors (9). Inaccurate fitting of the change in contrast media concentration as a function of time is a primary factor limiting diagnostic accuracy of DCEMRI.
A general problem with conventional analysis of DCEMRI data is that variation in the arterial input function (AIF) is not properly accounted for. Qualitative approaches such as the Kuhl classification method (6), and semi-quantitative analysis of signal intensity changes (11) do not take the AIF into account. This leads to errors because variations in contrast media injection, cardiac output, and major arterial supply to the tumor containing tissue, cause the AIF to vary significantly among patients (12). To account for these variations, the AIF for each patient is sometimes determined from the change in signal intensity as a function of time in a major artery (13). However, these measurements are subject to significant systematic errors due to the very high concentration of contrast agent in the artery and partial volume effects. It is rarely possible to find a large artery near the tumor, so that the AIF’s obtained from direct measurements in arteries are usually global rather than local. Other methods such as ‘Reference Tissue’ (14) approaches correct for the regional AIF. However, they do not produce a truly local AIF that reflect the delivery of the contrast media bolus directly to the tumor.
Ideally one would like to study contrast media uptake and washout from the tumor itself, without systematic errors or bias caused by the use of inappropriate physiologic models and incorrect AIFs. To find the hemodynamic characteristics of the tumor, it is necessary to separate the effects of the AIF from the kinetics of uptake and washout of contrast media. This can be done if the tissue is treated as a system that gives a linear, time invariant, and purely ‘causal’ response to the ‘local’ AIF (15). The local AIF can be deconvolved from the contrast concentration curves, so that the impulse response function (IRF) can be determined (16) as a fundamental characteristic of tissue.
Theoretically the deconvolution is easy to accomplish utilizing the properties of Laplace or Fourier transform. However, in practice the deconvolution is an ill-posed problem and noise in the data is magnified during processing of real DCEMRI data. The most commonly used deconvolution technique is singular value decomposition (SVD) (17). However, the conventional singular value decomposition introduces unwanted oscillations across a substantial portion of the IRF. Some regularization techniques have to be used as alternative singular value decomposition method to reducing the oscillations (18). These techniques are quite complicated and subject to error, and may not be appropriate for routine clinical DCEMRI data analysis. Therefore, a simple, robust deconvolution method that does not amplify noise is necessary to improve diagnosis of cancers.
Here, we describe a new deconvolution technique for determining the IRF. We test the method using numerical simulations of realistic DCEMRI data. Simulated plots of contrast media concentration as a function of time (referred to in the following as C(t)) for both tumor and muscle were generated using an EMM that has been demonstrated to accurately fit a wide range of experimental DCEMRI data (19,20). In additional to numerical simulations, the deconvolution technique was demonstrated directly with sample rodent tumor DCEMRI data acquired at 4.7 T. The TCM was also used to fit the contrast media concentration vs. time plots and the results of this procedure were compared with the results obtained with the deconvolution method. The physiological meaning of IRF parameters was determined by comparing them with Ktrans and ve derived from the TCM.
METHODS
Overview
Under assumption that muscle is well approximated by the TCM, the AIF was derived from the simulated muscle C(t) using the ‘reference tissue method’ (14). To obtain the IRF, we used two steps, namely ‘prediction’, and ‘correction’ to deconvolute the AIF from C(t). In the prediction step, a numerical IRF was calculated using a recursive formula. Due to the rapid variations in the tissue C(t) and the AIF at very early times, there were oscillations at the early times (within the first one or two sampling periods) in the resulting numerical IRF. Therefore, in correction step, an equation with a limited number of parameters was used to fit the numerical IRF to eliminate these oscillations. These parameters were varied over a limited range so that the convolution between the AIF and the final IRF matched the original C(t).
The analysis described above produced IRF’s for tumors that generally included a rapid enhancement phase. This is not physically realistic, since in principle, we are determining the purely causal response to a delta function input of contrast agent. This ‘enhancement phase’ is most likely due to the fact that the AIF derived from a reference tissue reflects blood flow to a reference tissue near the tumor, i.e. a regional AIF. The contrast bolus is likely to experience additional delay and dispersion on the way to specific voxels or regions within the tumor, and this delay and dispersion produces an unrealistic IRF. Thus, we modified the AIF derived from the reference tissue by introducing additional delay and dispersion to produce a truly local AIF, and to obtain a monotonically decaying IRF.
Deconvolution of the AIF from the contrast concentration vs. time curve
For a causal system, the convolution integral gives the relationship between the input function of a linear, time-invariant system with the impulse response and output response functions. The contrast concentration curve vs. time (C(t)) can be considered as the convolution between AIF (Ca(t)) and the IRF (Cδ(t)), i.e., mathematically:
| [1] |
Here we assume that the AIF is zero for time t < 0 and the system has no initial contrast agent (zero initial conditions). The lower limit of zero is due to Cδ(t) = 0 for t < 0, and the upper limit of t is due to the system being causal, i.e. Ca(t) = 0 for t < 0. To obtain the Cδ(t) from above equation, a deconvolution has to be performed.
We use two steps namely ‘prediction’ and ‘correction’ to obtain the IRF from the Eq. [1]. In the prediction step, we divide the whole time period into N very small time intervals in Eq. [1]. Then at time tj simply applying Riemann sums using right-hand endpoints yields:
| [2] |
where we assume that Cδ(t) does not change much in the small time interval Δti = [ti−1, ti] and take the value at ti. This is a good approximation when C(t) and Ca(t) were calculated with high temporal resolution. Then a predicted IRF is obtained by solving Eq. [2], i.e.,
| [3] |
Obviously the Eq. [3] requires that Ca(0) ≠ 0. When Ca(0) = 0, we modify the Eq. [3] as follows. In Eq. [2], we take Ca(tj-τ) as the left endpoint instead of right. In this way, the Ca(0) in Eq. [3] was replaced by Ca(1) if Ca(0) = 0.
As previously mentioned, due to rapid variations in the Ca(t) and C(t) at very early times, there are oscillations at the early times in the numerical IRF. Please notice that the oscillations produced by the above calculation only appear during a short period of time (generally less than 10 seconds, which is less than one or two sampling periods for experimental MRI data). In contrast, the oscillations produced by ‘singular value decomposition’ occur throughout the entire sampling period (21). To eliminate these oscillations and obtain an accurate IRF, the following equation was used to fit the numerical IRF:
| [4] |
where K (min−1) is the transfer constant of the tissue, κi (i=1, 2) are the decay constants, λ (min−1) is uptake rate, ρ is related the slope of uptake, and ε is a scaling factor. Equation 4 can be related to the TCM with K = Ktrans, and κ1 = kep = Ktrans/ve, when λ ≫ 1 and ε ≈ 0. Please notice that the IRF includes an uptake phase here. In principle the response of tissue to a delta function input should be a monotonic decay. However, the results demonstrate that in tumors the IRF contains an uptake phase when a regional or global AIF is used rather than a truly local AIF (see below). In the correction step, we use the direct search technique to vary the parameters of the fitted IRF, so that the result of Ca(t) convoluted with Cδ(t) (AIF⊗IRF) accurately fits the original C(t) with highest possible goodness-fit (R2) values. We refer to ‘AIF⊗IRF’ as a ‘convolution fit’ in the remainder of this paper.
Deriving the AIF from the reference tissue
Kovar et al. developed a method to estimate the AIF from contrast media dynamics in a reference tissue with (approximately) known physiology (14). Under the assumption that the reference tissue, such as muscle, was well approximated by the two-compartment model, the AIF could be obtained from the muscle C(t) using the literature values of Ktrans and ve following:
| [5] |
where Ktrans(min−1) is the volume transfer constant between blood plasma and extravascular extracellular space (EES), and ve is the volume of EES per unit volume of tissue. For muscle, Ktrans = 0.11 min−1 and ve = 0.2 were used in the simulations (14). In practice Ktrans and ve can be varied within a reasonable range around the literature values to achieve an optimal fit to experimental data, but in the case of the present simulation study the literature values were used without modification.
Calculating C(t) from empirical mathematical model
Previously studies showed that the following empirical mathematical model (EMM) accurately fits the contrast media concentration vs. time curves generated from the DCEMRI data for a variety of different tissues including tumors (9):
| [6] |
where A is the upper limit of the tracer concentration, α (min−1) is the rate of uptake, β (min−1) is the overall rate of washout, γ (min−1) is the initial rate of washout, and q is related to the slope of uptake. The EMM was used to produce a range of simulated contrast media concentration vs. time curves. For numerical simulations, the temporal resolution of 0.6 s was used in the calculations of C(t) for muscle and tumor.
To select realistic EMM parameters in the simulations, the ranges of parameters were determined based on previous analysis of data from DCEMRI studies of rodent tumors (9). In that previous study, T1-weighted gradient echo images (TR/TE = 15/6 ms) with temporal resolution of ~5 s were acquired for 2 minutes before and ~60 min after I.V. contrast injection on a SIGNA 1.5T scanner. A total of 24 Copenhagen rats with transplanted prostate tumors (AT2.1 and AT3.1) in the hind limbs were studied. The dose normalized contrast agent concentration vs. time curves were calculated for region of interests (ROIs) of normal muscle, tumor rim, and tumor center. Those curves were accurately fitted with the EMM. The pooled data provided EMM parameters (average ± standard deviations) for normal muscle: A = 0.68 ± 0.11, q = 1.33 ± 0.33, α = 3.53 ± 1.35, β = 0.027 ± 0.009, γ = 0.17 ± 0.08; for tumor rim: A = 1.96 ± 0.53, q = 0.80 ± 0.32, α = 2.09 ± 1.39, β = 0.014 ± 0.008, γ = 0.04 ± 0.03; and for tumor center: A = 1.59 ± 0.96, q = 1.09 ± 0.39, α = 2.23 ± 1.90, β = 0.012 ± 0.009, γ = 0.06 ± 0.06. Therefore, the EMM parameters used in simulations (Table 1) for muscle and tumor were selected close to the average, and the average plus and minus one standard deviation. For each EMM parameter we tested values equal to the mean value plus and minus one standard deviation, while the other EMM parameters were kept at their mean value. This meant that a total of 10 different combinations of parameters were tested. No simulated noise was added to the EMM fits; the EMM fits came from experimental data and therefore the effect of noise is already incorporated.
Table 1.
The range of EMM parameters used to calculate the contrast concentration curves for muscle and tumor.
| A (mM) | q | α (min−1) | β (min−1) | γ (min−1) | |
|---|---|---|---|---|---|
| Muscle | [0.6, 0.7, 0.8] | [1.0, 1.5, 2.0] | [2.0, 3.5, 5.0] | [0.02, 0.03, 0.04] | [0.1, 0.15, 0.2] |
| Tumor | [0.5, 2.0, 3.5] | [0.5, 1.0, 1.5] | [0.25, 2.0, 3.75] | [−0.005, 0.01, 0.025] | [0.0, 0.05, 0.1] |
The bolded numbers are average values used in the simulations.
Contrast concentration curves from sample rodent tumor data
Real DCEMRI data acquired at 4.7 T was used to test the deconvolution technique. T1-weighted gradient echo images (TR/TE = 40/3.5 ms, FOV = 4.0 cm, array size = 1282, slice thickness = 1 mm, number of slice = 3, NEX =1) of rodent transplanted prostate tumor were acquired with temporal resolution of ~5 s before and after 0.2 mmol/kg Gd-DTPA (Omniscan, GE Healthcare, Piscataway, NJ) injection for a total of ~10 min. After contrast media injection, the T1 in each image voxel was estimated by comparing signal intensity S(t) in a region of interest (ROI), to the control signal intensity S(0) in a reference tissue (for instance, muscle) with known T1. Since TR ≪ T1 for T1-weighted gradient echo imaging, the signal intensity could be approximated as a linear function of T1 and contrast media concentration (22), i.e.,
| [7] |
where R1 (4.3 mM−1s−1) is the longitudinal relaxivity of the contrast agent Gd-DTPA at 4.7 Tesla (23), Sref(0) is the signal at the ROI containing the reference tissue – muscle for this case, and T1(ref) = 1280 ms (24). To apply the deconvolution technique, the EMM was used to fit the C(t) obtained in Eq. [7] first, then high temporal resolution (0.6 s) C(t) was calculated from the EMM parameters.
RESULTS
Results for average values of EMM parameters
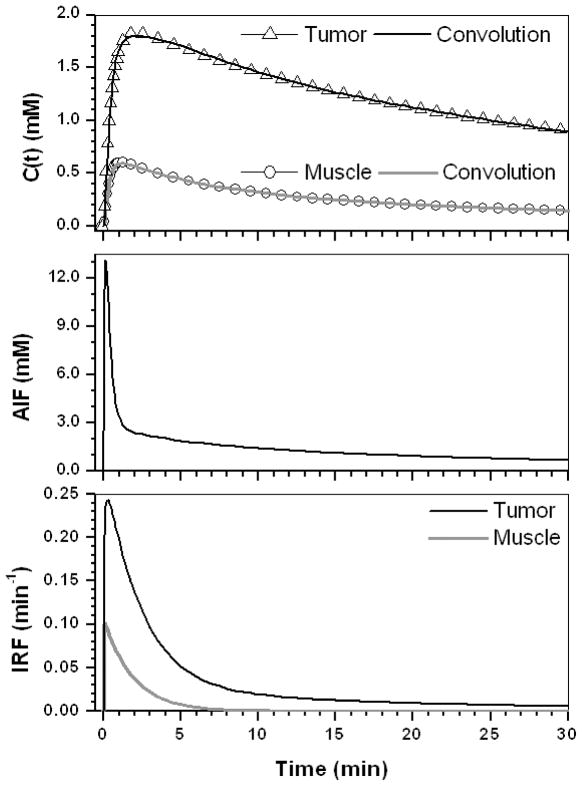
The average values of EMM parameters shown in Table 1 were used to produce typical concentration versus time plots for muscle and tumor. Figure 1 (top) shows the contrast concentration curves for muscle (open circles) and tumor (open triangles); (middle) the corresponding AIF derived from the muscle curve; and (bottom) the IRFs obtained from deconvolution for muscle (gray line) and tumor (black line). The final results of convolution between AIF and IRFs (AIF⊗IRF) are also shown in the top row for muscle (gray line) and tumor (black line). The AIF⊗IRF fits the simulated data very well (R2 > 0.99). This demonstrates that the derived IRFs are accurate, under the assumption that the AIF calculated from the reference tissue is accurate. The IRF model parameters are given in Table 2 for the muscle and tumor. Thus, the parameter λ(=20.5) was about five times larger and ε (=0.003) was about 30 times smaller in muscle compared to tumor. In other words, the uptake component of the IRF for muscle was almost instantaneous and the amplitude of the second exponential decay was negligible. As expected, the IRF for muscle could be modeled as a single exponential decay, which was just the same as the two-compartment model with K = 0.11 = Ktrans and K/κ1 = 0.20 = ve, so that the IRF parameters for muscle provide no new information. However, in the tumor, a significant initial uptake component of the IRF is evident, and the washout phase is bi-exponential. For tumor, the IRF parameter K was almost the same as the corresponding TCM parameter Ktrans. However, K/κ1 = 0.63, which is much less than the corresponding TCM parameter ve= 0.81. As a result, the TCM often required unrealistically larger ve for tumor (see last two column in Table 2) in order to fit the C(t) accurately. If ve was forced into the range between 0.10 and 0.35, the fits to the simulated data were poor.
Figure 1.
(top) The contrast concentration curves for muscle (open circle) and tumor (open triangle) calculated using the average EMM parameters given in Table 1; (middle) The AIF obtained from the muscle reference tissue; and (bottom) the IRFs for muscle (gray line) and tumor (black line) obtained by our technique. The convolution fit (AIF⊗IRF) to the original contrast concentration curves are shown for muscle (gray line) and tumor (black line).
Table 2.
The IRF model parameters and fitted TCM parameters for all simulated cases. For muscle, the average values of the EMM parameters were used and this muscle curve was also used to derive the AIF.
| Case | K | λ | ρ | κ1 | ε | κ2 | R2 | Ktrans | ve | R2 |
|---|---|---|---|---|---|---|---|---|---|---|
| Muscle | 0.11 | 20.5 | 0.12 | 0.54 | 0.003 | 0.12 | 0.99 | 0.11 | 0.20 | 0.99 |
| Tumor (a) | 0.27 | 4.6 | 0.22 | 0.43 | 0.10 | 0.05 | 0.99 | 0.26 | 0.81 | 0.98 |
| A = 0.5 | 0.07 | 4.6 | 0.22 | 0.43 | 0.10 | 0.05 | 0.99 | 0.07 | 0.20 | 0.98 |
| A = 3.5 | 0.47 | 5.3 | 0.16 | 0.43 | 0.09 | 0.05 | 0.99 | 0.52 | 1.00 | −1.57 |
| q = 0.5 | 0.27 | 25.5 | 0.03 | 0.49 | 0.14 | 0.07 | 0.96 | 0.29 | 0.80 | 0.66 |
| q = 1.5 | 0.29 | 2.8 | 0.49 | 0.44 | 0.09 | 0.05 | 0.99 | 0.24 | 0.83 | 0.96 |
| α = 0.25 | 0.11 | 0.80 | 0.63 | 0.16 | 0.20 | 0.05 | 0.99 | 0.09 | 1.00 | 0.93 |
| α = 3.75 | 0.29 | 52.1 | 0.26 | 0.54 | 0.14 | 0.08 | 0.98 | 0.30 | 0.80 | 0.78 |
| β = −0.005 | 0.26 | 6.0 | 0.17 | 0.42 | 0.12 | 0.02 | 0.99 | 0.26 | 0.92 | 0.95 |
| β = 0.025 | 0.27 | 9.8 | 0.15 | 0.41 | 0.04 | 0.10 | 0.99 | 0.27 | 0.73 | 0.99 |
| γ = 0.0 | 0.26 | 5.4 | 0.16 | 0.43 | 0.16 | 0.03 | 0.99 | 0.25 | 0.98 | 0.95 |
| γ = 0.1 | 0.28 | 5.2 | 0.16 | 0.44 | 0.04 | 0.02 | 0.99 | 0.27 | 0.71 | 0.99 |
| Tumor (s) | 0.03 | 0.3 | 0.95 | 0.14 | 0.36 | 0.007 | 0.99 | 0.02 | 1.00 | 0.90 |
| Tumor (f) | 0.61 | 39.1 | 0.01 | 0.71 | 0.09 | 0.19 | 0.97 | 0.65 | 1.00 | 0.45 |
For tumors, the average values of the EMM parameters were used first, (referred to as Tumor (a) in the table). Then specific parameters (i.e. A, q, α, β, or γ) were set to their average values plus and minus one standard deviation. To simulate slow uptake combined with slow washout (referred to as Tumor (s) in the table), the values of [A, q, α, β, t γ] = [0.5, 1.5, 0.25, −0.005, 0.0] were used. To simulate fast uptake combined with fast washout (Tumor (f) in the table), the values [A, q, α, β, γ] = [3.5, 0.5, 3.75, 0.025, 0.1] were used.
Effect of variations in EMM parameters about the mean values
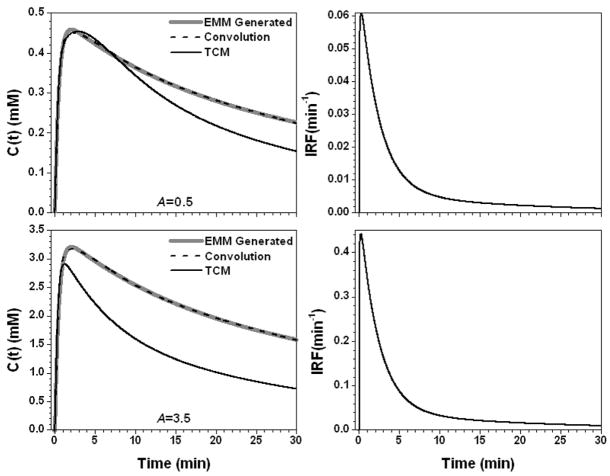
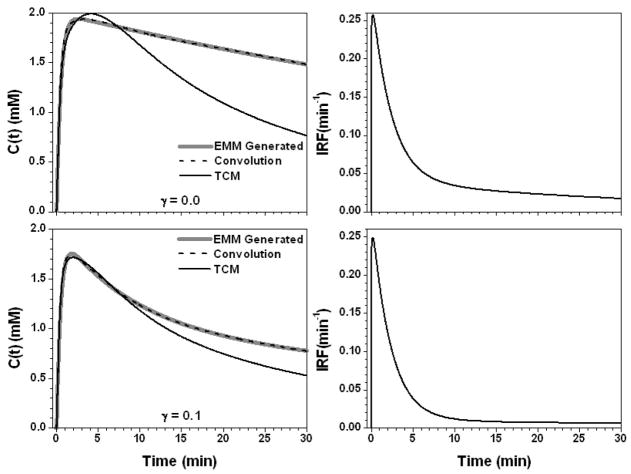
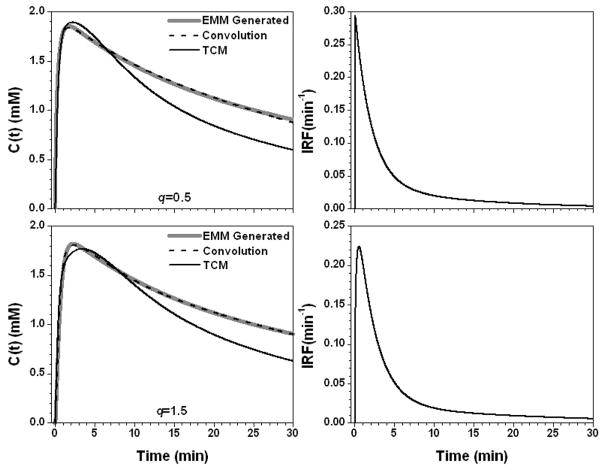
Figures 2 – 6 show the results of changing one of the EMM parameters - A, q, α, β, or γ –while keeping the other parameters at their mean values. In each case, AIF⊗IRF was compared with the TCM fit. The detailed results of these simulations are given in Table 2.
Figure 2.
The calculated contrast concentration curves for tumor (gray line) using the average EMM parameters but with parameter A changed to 0.5 mM and 3.5 mM, top and bottom left panel, respectively. The corresponding IRF is shown in the right panel. The convolution fit (AIF⊗IRF) (dash line) and the TCM fitting (black line) to the original contrast concentration curves are shown in the left panel.
Figure 6.
The calculated contrast concentration curves for tumor (gray line) using the average EMM parameters but with parameter γ changed to 0.0 (min−1) and 0.1 (min−1), top and bottom left panel, respectively. The corresponding IRF is shown in the right panel. The convolution fit (AIF⊗IRF) (dash line) and the TCM fitting (black line) to the original contrast concentration curves are shown in the left panel.
Figure 2 shows the results for the parameter A set to 0.5 (mM) and 3.5 (mM). The contrast concentration vs. time plots were scaled when parameter A was changed and the shapes of IRFs were similar for these two cases but the value of K differed by a factor of seven. AIF⊗IRF fitted the simulated data very well (R2 > 0.99), but the TCM had trouble fitting the curve for A = 3.5 (mM) with R2 = −1.56. Figure 3 shows the results for q equal to 0.5 and 1.5, resulting in small changes in the slope of the uptake portion of C(t). This resulted in a large change in the IRF parameter λ = 25.5 min−1 and 2.8 min−1 for q = 0.5 and 1.5, respectively. Therefore, the IRF for q = 0.5 could be modeled simply with a double exponential decay using four parameters, while the IRF for q = 1.5 required an uptake component. Again, the fit obtained with AIF⊗IRF (R2 > 0.96) was better than the TCM fit (R2 > 0.66).
Figure 3.
The calculated contrast concentration curves for tumor (gray line) using the average EMM parameters but with parameter q changed to 0.5 and 1.5, top and bottom left panel, respectively. The corresponding IRF is shown in the right panel. The convolution fit (AIF⊗IRF) (dash line) and the TCM fitting (black line) to the original contrast concentration curves are shown in the left panel.
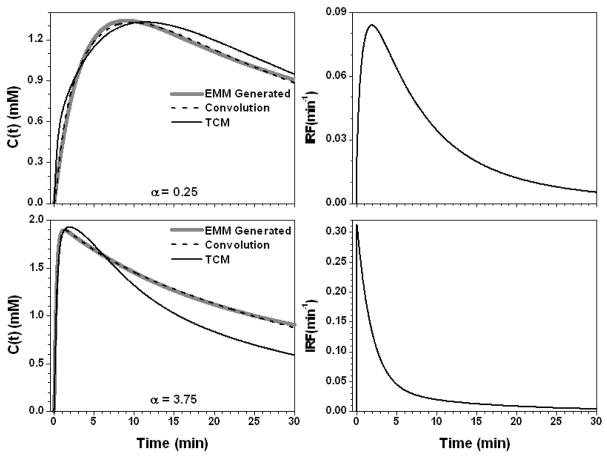
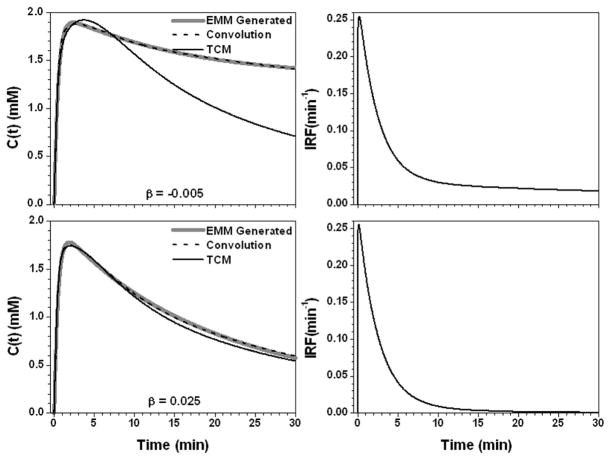
Figure 4 shows the results for the parameter α set to 0.25 min−1 and 3.75 min−1. For slow contrast uptake (α = 0.25 min−1), the IRF had a strong uptake component and double exponential decay. On the other hand, for fast contrast uptake, the IRF was accurately modeled simply as double exponential decay due to the large λ (= 52.1 min−1) value. The TCM fit was more accurate for slow contrast uptake than for fast uptake (R2 = 0.93 vs. 0.78), but overall the AIF⊗IRF fits (R2 > 0.98) were better than the TCM fits. Figure 5 shows the results when the parameter β changed to −0.005 and 0.025 min−1. The IRFs obtained for these two values of β were similar at early time points, but very different at later time points (where curve shape was dictated primarily by the second, slower component of the exponential decay) because of large differences in the values of ε and κ2. The TCM fitted the curve better for the β = 0.025 (R2 = 0.99) than β = −0.005 min−1 (R2 = 0.95), but even for the large β value, fits obtained for the TCM were not as good as those obtained with convolution fits (R2 > 0.99). For the parameter γ, there were a similar trends, see Fig. 6. This is because both parameters control the contrast media washout.
Figure 4.
The calculated contrast concentration curves for tumor (gray line) using the average EMM parameters but with only parameter α changed to 0.25 (min−1) and 3.75 (min−1), top and bottom left panel, respectively. The corresponding IRF is shown in the right panel. The convolution fit (AIF⊗IRF) (dash line) and the TCM fitting (black line) to the original contrast concentration curves are shown in the left panel.
Figure 5.
The calculated contrast concentration curves for tumor (gray line) using the average EMM parameters but with parameter β changed to −0.005 (min−1) and 0.025 (min−1), top and bottom left panel, respectively. The corresponding IRF is shown in the right panel. The convolution fit (AIF⊗IRF) (dash line) and the TCM fitting (black line) to the original contrast concentration curves are shown in the left panel.
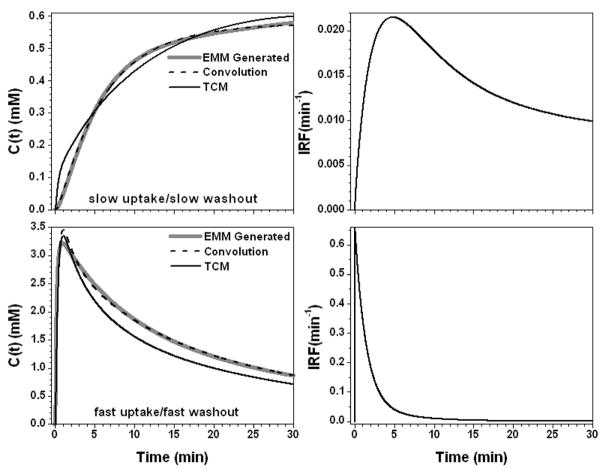
In above results, we changed EMM parameters one at a time from their average values. We also changed all five EMM parameters simultaneously (Table 2) to generate two more examples: (i) slow uptake and slow washout; and (ii) fast uptake and fast washout. The results of deconvolution between concentration curves and the AIF are shown in Fig. 7. The IRF for case (i) requires a rapid uptake component and a double exponential decay; and for case (ii) only a double exponential decay is required. Once again, the convolution fits (R2 > 0.96) of the contrast concentration curves were better than the TCM fits (R2 > 0.45).
Figure 7.
The calculated contrast concentration curves for tumor (gray line) using the EMM parameters given in Table 2 to simulate slow uptake/slow washout and fast uptake/fast washout, top and bottom left panel, respectively. The corresponding IRF is shown in the right panel. The convolution fit (AIF⊗IRF) (dash line) and the TCM fitting (black line) to the original contrast concentration curves are shown in the left panel.
Effect of AIF in the deconvolution
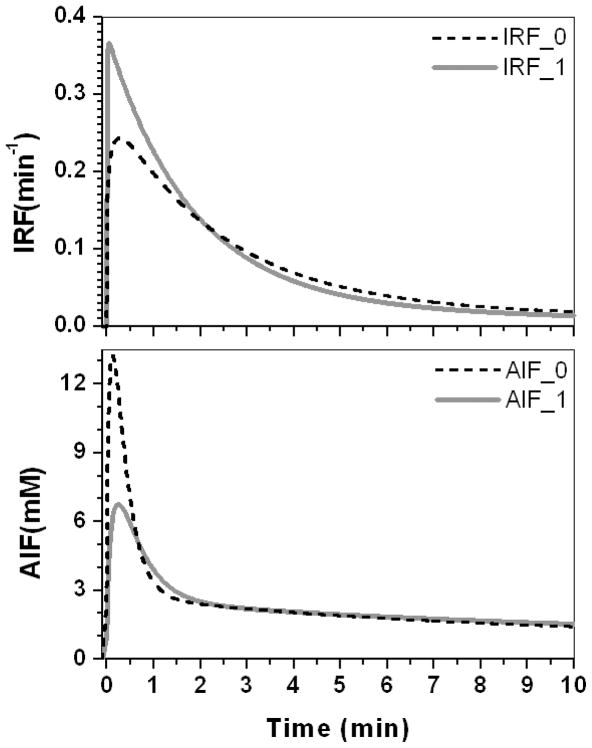
Figure 8 (top dash line) shows the IRF deconvoluted from a tumor contrast concentration curve using a regional AIF (Fig. 8 bottom dash line). The IRF contains a rapid enhancement phase with significant amplitude. To minimize the rapid enhancement phase, the regional AIF was modified with increased delay and dispersion. An AIF with increased delay of approximately 7 s and width-at-half-height increased by a factor of two (shown in Fig. 8 bottom, gray line), produced an IRF with a minimal uptake phase, but with bi-exponential decay (shown in Fig. 8 top gray line).
Figure 8.
The IRFs obtained by deconvoluting two different AIFs from the same contrast concentration curves generated from tumor average EMM parameters.
Example of deconvolution for real DCEMRI animal data
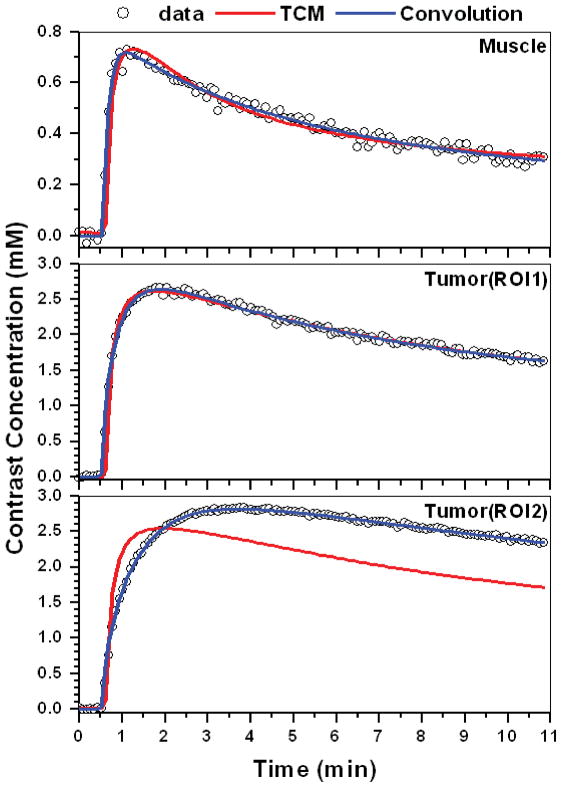
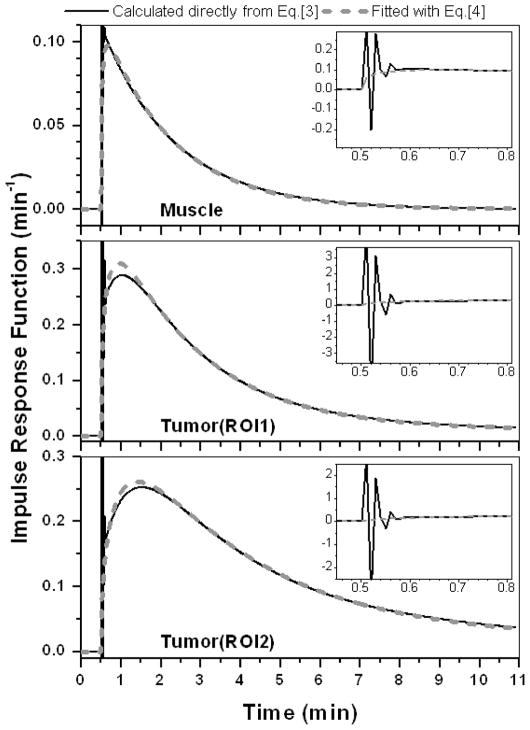
Figure 9 illustrates the application of this approach to raw data from a non-metastatic rodent prostate tumor. The Figure shows dose normalized Gd-DTPA C(t) curves (open circles) for ROIs in muscle (30 pixels) and tumor rim (35 and 33 pixels for ROI1 and ROI2, respectively) fitted with the TCM (red line), and convolution (blue line). The convolution (AIF⊗IRF) fits the data more accurately than the TCM. The calculated goodness-fit (R2) values for the three ROIs were 0.98, 0.99, and 0.99 for convolution fit, and 0.95, 0.98 and 0.45 for the TCM. The corresponding IRFs (black line – calculated directly from Eq. [3] and dash line - after correction) from muscle and two different tumor rim ROIs are shown in Fig. 10. As in previous examples, the tumor IRFs include a large uptake component, and the two-compartment model does not provide good fits to the raw data from tumor ROI2.
Figure 9.
Typical dose normalized Gd-DTPA contrast concentration vs. time curves (open circles) obtained from a typical non-metastatic rodent prostate tumor. Fits obtained with the two-compartment model (red line) and the convolution (AIF⊗IRF) (blue line) for selected ROIs in muscle (top), and two different ROIs in tumor rim (middle and bottom).
Figure 10.
The IRFs for each contrast concentration curve displayed in Fig. 9 deconvoluted from the AIF derived from muscle. Solid black and gray dashed lines indicate IRFs determined directly from numerical calculations, and modified by Eq. [4], respectively. Insets demonstrate oscillations in the IRFs calculated specifically from Eq. [3].
DISCUSSION
The results presented here demonstrate a simple and effective algorithm for deconvoluting the global AIF from DCEMRI data and evaluating the resulting IRF. The deconvolution technique was tested on simulated contrast concentration vs. time curves. The simulations were based on EMM fits to a large number of experimental datasets, and thus accurately represent the range of data that would be seen in typical experiments. The results demonstrate that the deconvolution technique produces excellent fits to DCEMRI data without artifacts and is straight forward and easy to use. This is a new approach to analysis of DCEMRI data that could lead to improvements in diagnostic accuracy and assessment of response to therapy.
Because muscle is well approximated by the simple two compartment model, the IRF’s for muscle were accurately fit with a single exponential decay equivalent to the two compartment model, with K = Ktrans, and κ1 = kep = Ktrans/ve, when λ ≫ 1 and ε ≈ 0. No initial uptake phase was required for muscle impulse response functions.
However, the IRF required for tumors was much more complicated than for normal tissue; this reflects the complex physiology and micro-anatomy of tumors. When a ‘regional’ AIF derived from a nearby muscle reference tissue was used, the resulting tumor IRF included an initial exponential enhancement phase. This is physically unrealistic, since the response of the tumor to a delta function bolus should decay monotonically. This suggests that the ‘regional’ AIF derived from reference tissue must be modified by adding delay and dispersion terms to produce a local AIF for each tumor region. The results illustrated in Fig. 8 demonstrate that the ‘local’ AIF gives a physically realistic IRF that is a (approximately) bi-exponential decay. The additional delay and dispersion terms that modify the ‘regional’ AIF to produce a ‘local’ AIF may be related to tumor interstitial pressure, and blockage and intermittent flow in tumor microvessels. As a result, these are novel parameters that may have diagnostic utility and may be sensitive to changes in tumors during therapy. However, the potential clinical application of these new parameters is speculative at present, and further work is needed to determine whether they can be useful in routine clinical practice.
In this study, the deconvolution to obtain an IRF assumed that an accurate AIF was used. The AIF was derived from reference tissue – muscle, and did not include a second pass. Although improvement in accuracy of the AIF was not the subject in the present study, future work will evaluate the effect of an AIF with a second pass. In addition, we will test AIF’s calculated using the more accurate ‘double reference tissue method’ developed by Yang et al (25), and AIF’s derived from direct arterial measurements.
The widely used two-compartment model approach requires that the impulse response function is simply a mono-exponential decay. The present results demonstrate that this is the case for muscle. However, this simple model is not consistent with the IRF calculated for most tumor ROIs. The tumor IRF usually included an initial uptake phase followed by a multi-exponential decay. These characteristics of the tumor IRF produce systematic errors when the two compartment model is used to fit raw data. The approach presented here provides solutions to these problems. First, the initial IRF and AIF can be adjusted to produce a local AIF and a more realistic, monotonically decaying IRF. Second, the monotonically decaying IRF can be well approximated by a multi-exponential decay. In general, given the signal-to-noise ratio of typical data, a bi-exponential decay is sufficient. Thus, the present approach leads to calculations of IRF’s that accurately model experimental data. Biases due to use of the two compartment model or other physiologic models are avoided. Although the IRF approach is a ‘model free approach’, it can be analyzed to approximate physiological parameters, as illustrated here.
The present work demonstrates that impulse response analysis has potential advantages compared to more widely used methods. We describe a simple, robust deconvolution method that produces artifact-free IRF’s. An extension of the method allows calculation of a local AIF and provides new parameters that describe delay and dispersion of the contrast media bolus in tumor vasculature, and these parameters may have diagnostic utility. The results of this preliminary study suggest that the parameters of the model for the IRF can provide good discrimination between cancer and normal tissue (see Table 2). Future work will further evaluate the use of this approach to distinguish between benign and malignant cancers, and detect tumor response to therapy.
Acknowledgments
This work was supported by grants from the Lynn S. Florsheim Foundation, the NIBIB (RO1 EB003108-01), the NCI (RO1CA78803), and the Specialized Program of Research Excellence (SPORE) (1 P50 CA125183 02).
References
- 1.Orel SG, Schnall MD. MR imaging of the breast for the detection, diagnosis, and staging of breast cancer. Radiology. 2001;220:13–30. doi: 10.1148/radiology.220.1.r01jl3113. [DOI] [PubMed] [Google Scholar]
- 2.Turnbull LW. Dynamic contrast-enhanced MRI in the diagnosis and management of breast cancer. NMR Biomed. 2009;22:28–39. doi: 10.1002/nbm.1273. [DOI] [PubMed] [Google Scholar]
- 3.Saslow D, Boetes C, Burke W, Harms S, Leach MO, Lehman CD, Morris E, Pisano E, Schnall M, Sener S, Smith RA, Warner E, Yaffe M, Andrews KS, Russell CA. American Cancer Society guidelines for breast screening with MRI as an adjunct to mammography. CA Cancer J Clin. 2007;57:75–89. doi: 10.3322/canjclin.57.2.75. [DOI] [PubMed] [Google Scholar]
- 4.Warren RM, Pointon L, Thompson D, Hoff R, Gilbert FJ, Padhani A, Easton D, Lakhani SR, Leach MO. Reading protocol for dynamic contrast-enhanced MR images of the breast: sensitivity and specificity analysis. Radiology. 2005;236:779–788. doi: 10.1148/radiol.2363040735. [DOI] [PubMed] [Google Scholar]
- 5.Jansen SA, Newstead GM, Abe H, Shimauchi A, Schmidt RA, Karczmar GS. Pure ductal carcinoma in situ: kinetic and morphologic MR characteristics compared with mammographic appearance and nuclear grade. Radiology. 2007;245:684–691. doi: 10.1148/radiol.2453062061. [DOI] [PubMed] [Google Scholar]
- 6.Kuhl CK, Mielcareck P, Klaschik S, Leutner C, Wardelmann E, Gieseke J, Schild HH. Dynamic breast MR imaging: are signal intensity time course data useful for differential diagnosis of enhancing lesions? Radiology. 1999;211:101–110. doi: 10.1148/radiology.211.1.r99ap38101. [DOI] [PubMed] [Google Scholar]
- 7.Parker GJ, Suckling J, Tanner SF, Padhani AR, Revell PB, Husband JE, Leach MO. Probing tumor microvascularity by measurement, analysis and display of contrast agent uptake kinetics. J Magn Reson Imaging. 1997;7:564–574. doi: 10.1002/jmri.1880070318. [DOI] [PubMed] [Google Scholar]
- 8.Roberts C, Issa B, Stone A, Jackson A, Waterton JC, Parker GJ. Comparative study into the robustness of compartmental modeling and model-free analysis in DCE-MRI studies. J Magn Reson Imaging. 2006;23:554–563. doi: 10.1002/jmri.20529. [DOI] [PubMed] [Google Scholar]
- 9.Fan X, Medved M, River JN, Zamora M, Corot C, Robert P, Bourrinet P, Lipton M, Culp RM, Karczmar GS. New model for analysis of dynamic contrast-enhanced MRI data distinguishes metastatic from nonmetastatic transplanted rodent prostate tumors. Magn Reson Med. 2004;51:487–494. doi: 10.1002/mrm.10737. [DOI] [PubMed] [Google Scholar]
- 10.Tofts PS, Brix G, Buckley DL, Evelhoch JL, Henderson E, Knopp MV, Larsson HB, Lee TY, Mayr NA, Parker GJ, Port RE, Taylor J, Weisskoff RM. Estimating kinetic parameters from dynamic contrast-enhanced T(1)-weighted MRI of a diffusable tracer: standardized quantities and symbols. J Magn Reson Imaging. 1999;10:223–232. doi: 10.1002/(sici)1522-2586(199909)10:3<223::aid-jmri2>3.0.co;2-s. [DOI] [PubMed] [Google Scholar]
- 11.Szabo BK, Aspelin P, Wiberg MK, Bone B. Dynamic MR imaging of the breast. Analysis of kinetic and morphologic diagnostic criteria. Acta Radiol. 2003;44:379–386. doi: 10.1080/j.1600-0455.2003.00084.x. [DOI] [PubMed] [Google Scholar]
- 12.Port RE, Knopp MV, Brix G. Dynamic contrast-enhanced MRI using Gd-DTPA: interindividual variability of the arterial input function and consequences for the assessment of kinetics in tumors. Magn Reson Med. 2001;45:1030–1038. doi: 10.1002/mrm.1137. [DOI] [PubMed] [Google Scholar]
- 13.Fritz-Hansen T, Rostrup E, Larsson HB, Sondergaard L, Ring P, Henriksen O. Measurement of the arterial concentration of Gd-DTPA using MRI: a step toward quantitative perfusion imaging. Magn Reson Med. 1996;36:225–231. doi: 10.1002/mrm.1910360209. [DOI] [PubMed] [Google Scholar]
- 14.Kovar DA, Lewis M, Karczmar GS. A new method for imaging perfusion and contrast extraction fraction: input functions derived from reference tissues. J Magn Reson Imaging. 1998;8:1126–1134. doi: 10.1002/jmri.1880080519. [DOI] [PubMed] [Google Scholar]
- 15.Lassen NA, Perl W. Tracer Kinetic Methods in Medical Physiology. New York: Raven Press; 1979. [Google Scholar]
- 16.Ostergaard L. Cerebral perfusion imaging by bolus tracking. Top Magn Reson Imaging. 2004;15:3–9. doi: 10.1097/00002142-200402000-00002. [DOI] [PubMed] [Google Scholar]
- 17.Ostergaard L, Weisskoff RM, Chesler DA, Gyldensted C, Rosen BR. High resolution measurement of cerebral blood flow using intravascular tracer bolus passages. Part I: Mathematical approach and statistical analysis. Magn Reson Med. 1996;36:715–725. doi: 10.1002/mrm.1910360510. [DOI] [PubMed] [Google Scholar]
- 18.Calamante F, Gadian DG, Connelly A. Quantification of bolus-tracking MRI: Improved characterization of the tissue residue function using Tikhonov regularization. Magn Reson Med. 2003;50:1237–1247. doi: 10.1002/mrm.10643. [DOI] [PubMed] [Google Scholar]
- 19.Fan X, Medved M, Karczmar GS, Yang C, Foxley S, Arkani S, Recant W, Zamora MA, Abe H, Newstead GM. Diagnosis of suspicious breast lesions using an empirical mathematical model for dynamic contrast-enhanced MRI. Magn Reson Imaging. 2007;25:593–603. doi: 10.1016/j.mri.2006.10.011. [DOI] [PMC free article] [PubMed] [Google Scholar]
- 20.Fan X, Medved M, Foxley S, River JN, Zamora M, Karczmar GS, Corot C, Robert P, Bourrinet P. Multi-Slice DCE-MRI Data Using P760 Distinguishes Between Metastatic and Non-Metastatic Rodent Prostate Tumors. MAGMA. 2006;19:15–21. doi: 10.1007/s10334-005-0022-y. [DOI] [PubMed] [Google Scholar]
- 21.Andersen IK, Szymkowiak A, Rasmussen CE, Hanson LG, Marstrand JR, Larsson HB, Hansen LK. Perfusion quantification using Gaussian process deconvolution. Magn Reson Med. 2002;48:351–361. doi: 10.1002/mrm.10213. [DOI] [PubMed] [Google Scholar]
- 22.Medved M, Karczmar G, Yang C, Dignam J, Gajewski TF, Kindler H, Vokes E, MacEneany P, Mitchell MT, Stadler WM. Semiquantitative analysis of dynamic contrast enhanced MRI in cancer patients: Variability and changes in tumor tissue over time. J Magn Reson Imaging. 2004;20:122–128. doi: 10.1002/jmri.20061. [DOI] [PubMed] [Google Scholar]
- 23.Furman-Haran E, Margalit R, Grobgeld D, Degani H. Dynamic contrast-enhanced magnetic resonance imaging reveals stress-induced angiogenesis in MCF7 human breast tumors. Proc Natl Acad Sci U S A. 1996;93:6247–6251. doi: 10.1073/pnas.93.13.6247. [DOI] [PMC free article] [PubMed] [Google Scholar]
- 24.Marzola P, Mocchegiani E, Nicolato E, Tibaldi A, Sbarbati A, Osculati F. Chemical shift imaging at 4.7 tesla of thymus in young and old mice. J Magn Reson Imaging. 1999;10:97–101. doi: 10.1002/(sici)1522-2586(199907)10:1<97::aid-jmri14>3.0.co;2-y. [DOI] [PubMed] [Google Scholar]
- 25.Yang C, Karczmar GS, Medved M, Stadler WM. Estimating the arterial input function using two reference tissues in dynamic contrast-enhanced MRI studies: fundamental concepts and simulations. Magn Reson Med. 2004;52:1110–1117. doi: 10.1002/mrm.20243. [DOI] [PubMed] [Google Scholar]


