

Abstract
A novel method for high-throughput proteomic analysis of formalin-fixed paraffin-embedded (FFPE) tissue microarrays (TMA) is described using on-tissue tryptic digestion followed by MALDI imaging MS. A TMA section containing 112 needle core biopsies from lung-tumor patients was analyzed using MS and the data were correlated to a serial hematoxylin and eosin (H&E)-stained section having various histological regions marked, including cancer, non-cancer, and normal ones. By correlating each mass spectrum to a defined histological region, statistical classification models were generated that can sufficiently distinguish biopsies from adenocarcinoma from squamous cell carcinoma biopsies. These classification models were built using a training set of biopsies in the TMA and were then validated on the remaining biopsies. Peptide markers of interest were identified directly from the TMA section using MALDI MS/MS sequence analysis. The ability to detect and characterize tumor marker proteins for a large cohort of FFPE samples in a high-throughput approach will be of significant benefit not only to investigators studying tumor biology, but also to clinicians for diagnostic and prognostic purposes.
Keywords: Cancer, Formalin-fixed paraffin-embedded, Imaging mass spectrometry, Lung, Tissue
1 Introduction
MALDI imaging MS (IMS) has emerged as a powerful technique for analyzing the spatial arrangement of proteins, peptides, lipids, and small molecules in biological tissues [1–3]. The multichannel detection capability of MS enables the position sensitive analysis of hundreds of different molecules in a single experiment [1, 2]. This is achieved by acquiring MALDI mass spectra across a tissue section at defined geometrical coordinates. Post-acquisition processing compiles the mass spectra into a format in which any of the detected species can be viewed as an ion-density map, where the relative abundance of the selected ion across the tissue is displayed on a color-intensity scale at each coordinate location (pixel). Unlike other visualization techniques such as immunohistochemistry (IHC) or fluorescence microscopy, MALDI IMS does not require a target-specific reagent and therefore is a valuable discovery tool, since it can survey a broad range of proteins simultaneously.
In the past decade, improvements to the IMS technology have been made in sample preparation and handling [4], sectioning [4–6], matrix deposition [4, 7, 8], as well as data acquisition and processing [5, 9]. Of particular interest is the recent development of methodologies to perform in situ chemistries prior to IMS analyses, e.g. using various enzymes to expand the amount of protein information obtained in the analysis [10–12]. Thus, proteins in a tissue can be hydrolyzed in situ by exogenously added proteases, and the resulting peptides spatially analyzed by MALDI IMS. Sequence determination of the tryptic fragments by MS/MS analysis directly off the tissue followed by database searching can be used to identify many of the proteins present in the native tissue.
IMS has been successfully used to identify subsets of markers that correlate with cancer progression [13–18]. For example, in earlier studies, protein markers were obtained from the direct MALDI IMS proteomic analysis of glioma biopsies that could differentiate stage including the most aggressive form, glioblastoma multiforms, and with patient outcomes [14]. Our laboratory has also investigated a large cohort of human non-small cell lung-cancer (NSCLC) biopsies [13, 19]. In these studies, sections from fresh frozen biopsies were cut and spotted with matrix on areas identified as cancerous. From the resulting protein profiles, statistical analyses identified markers that could be correlated with histological assessment and patient outcomes. These patterns precisely distinguished healthy versus cancerous tissue, and distinguished various subtypes of NSCLCs, such as adenocarcinoma, squamous cell carcinoma and large cell carcinoma. Further, these patterns could be correlated with patient survival. From this latter cohort, several of the proteins of the survival signature were identified. These results highlight the use of this technology for the rapid characterization of disease at the protein level to confirm diagnosis and potentially aid in therapeutic management [20].
MALDI IMS is often carried out on fresh-frozen tissue sections, since this closely mimics native tissue. However, the vast majority of clinical specimens stored in hospital tissue banks are formalin-fixed paraffin-embedded (FFPE), representing an expansive archive of diseased tissues mostly with known outcomes. Formalin fixation stabilizes proteins by chemical cross-linking throughout a tissue section, preventing postmortem enzymatic proteolysis while maintaining the cellular histology [21].
Over the past two decades, several methods have been reported that attempt to reverse formalin-fixation, a process commonly referred to as antigen retrieval [22–24]. Antigen retrieval typically involves the application of high-temperature treatment along with the use of a buffer solution, in an effort to reverse the protein cross-linking and return a tissue to its native state as much as possible [22] Development of methods to effectively and reproducibly carry out antigen retrieval on FFPE tissue specimens has allowed for the standardization of IHC protocols and has recently opened the door to a vast collection of archival clinical samples to be analyzed for genomic and proteomic information. For protein identification, approaches using either LC-MS/MS [24–27] or 2-DE [28, 29] have been reported. Recently, a 2-D gel-based study showed that the same proteins can be identified independently of the type of preservation used; when the appropriate antigen retrieval protocol is applied, the level of identification was found comparable to that of frozen tissues [29].
To comprehensively evaluate the diagnostic, prognostic, and therapeutic value of gene and/or protein expression in clinical tissue samples, it is necessary to analyze a large number of specimens from patients in different stages of disease [30]. In this regard, tissue microarrays (TMA) were originally developed to facilitate the molecular and pathological analysis of tissue specimens in a massively parallel and high-throughput approach [30–32]. A TMA consists of a paraffin block in which as many as 1000 cylindrical tissue biopsies from individual tumors are distributed into a precise array [30]. Sections cut from this array enable investigation of DNA by fluorescence in situ hybridization (FISH), RNA by mRNA in situ hybridization, or proteins by IHC, from each of the biopsy samples.
We have developed an IMS method incorporating antigen retrieval and in situ enzymatic digestion to analyze the protein content of TMA containing FFPE NSCLC biopsies. The TMA used in this study contained various types of NSCLC biopsies including squamous cell carcinoma, adenocarcinoma, and bronchioloalveolar carcinoma as well as non-cancer tissue from matched individuals. MALDI IMS was used to analyze these samples in a high-throughput fashion, providing proteomic data from discrete regions of each biopsy. We demonstrate, as previously observed at the protein level from fresh-frozen tissue [13], that a histological classification of lung cancer can be effectively accomplished at the peptide level. The ability to detect and characterize tumor marker proteins for a large cohort of samples in a high-throughput approach will be of significant benefit not only to investigators studying tumor biology, but also to clinicians for diagnostic and prognostic purposes.
2 Materials and methods
2.1 Materials
HPLC-grade ACN and TFA were purchased from Fisher Scientific (Pittsburgh, PA). CHCA was purchased from Fluka (Buchs, Switzerland) and used without further purification. Trypsin Gold was purchased from Promega (Madison, WI). The Indium Tin Oxide (ITO)-coated conductive slides were purchased from Delta-Technologies (Stillwater, MN). TMA consisted of 100 duplicate needle core biopsies (1 mm) from 50 patients diagnosed with NSCLC and 10 adjacent normal lung tissue punches. The layout of the TMA includes duplicate needle core punches from 21 adenocarcinoma biopsies, 21 squamous cell carcinoma biopsies, 4 bronchioloalveolar carcinoma biopsies, 2 metastatic colon cancer biopsies, 1 carcinoid biopsy, and 1 plasma cell granuloma biopsy. Due to limited numbers for the other cancer types, only the adenocarcinoma and squamous cell carcinoma biopsies were considered in these experiments. Several of the needle cores from the adenocarcinoma and squamous cell carcinoma biopsies did not contain a sufficient amount of tissue or did not contain regions of cancer. Therefore, the TMA contains 22 squamous cell-carcinoma needle cores from 14 different patients (8 duplicates and 6 unpaired) and 18 adenocarcinoma needle cores from 12 different patients (6 duplicates and 6 unpaired) that contain cancerous regions and are considered in the study.
2.2 Tissue preparation
Serial 5-μm thick sections were cut from all TMA blocks using a microtome. Sections from the TMA were mounted either onto ITO-coated conductive slides for MALDI MS analysis [33], or onto regular glass microscope slides for H&E staining. Paraffin removal was carried out using washes in xylene (100%, twice for 20 min) and graded ethanol washes (100%, twice for 5 min and in successive washes in 95, 80 and 70% for 5 min each). The slides were then allowed to fully dry in an oven for 1 h at 65°C. Antigen retrieval was performed by heating the section in a tris-EDTA buffer at pH 9 at 95°C for 20 min.
2.3 On-tissue digestion
Trypsin (100 μg) was dissolved in 200 μL of 50 mM acetic acid to obtain a stock solution with a concentration of 0.5 μg/μL. A 50-μL aliquot of this stock solution was activated by adding 500 μL of 100 mM ammonium bicarbonate to reach a pH of ~8 and a final trypsin concentration of 0.045 μg/μL. This trypsin solution was automatically spotted onto the TMA tissue sections using a Portrait 630 reagent multi-spotter (Labcyte, Sunnyvale, CA) into an array incorporating 250-μm center to center spacing between individual spots, each of which were approximately 175 μm in diameter. The trypsin was spotted over a series of 30 iterations while depositing one drop (~160 pL per drop) each iteration to achieve a total spot volume of ~4.8 nL. Between each iteration, the deposited trypsin solution was allowed to dry (~5 min time intervals per iteration). The trypsin spotting proceeded at room temperature (~21°C) over time of ~2.5 h, allowing ample time for digestion to take place. Following digestion, a solution consisting of 10 mg/mL of CHCA in 1:1 ACN/0.5% TFA (aq.) was spotted directly onto the array of tryptic spots over 30 iterations at one drop per iteration.
2.4 IMS of digested TMA section
The printed arrays were analyzed using an Ultraflex II MALDI-TOF/TOF mass spectrometer (Bruker Daltonics, Billerica, MA) equipped with a smart beam laser [34] and controlled by the Flex Control 3.0 software package. The mass spectrometer was operated with positive polarity in reflectron mode and spectra acquired in the range of m/z 700–5000. Image acquisition of the spotted arrays was carried out using the Flex Imaging 2.0 (Bruker Daltonics) software package. A total of 1600 spectra were acquired at each spot position in a customized spiral raster pattern in 200-shot increments at a laser frequency of 200 Hz. The customized raster pattern was used to sample the entire spot area. Ion images were assembled using the Flex Imaging 2.0 software package.
2.5 MS/MS sequence analysis of tryptic peptides
MALDI MS/MS measurements of selected peptides were acquired using TOF/TOF fragmentation directly from the digested TMA sections. Each tryptic peptide sequenced was selected and fragmented manually and the generated spectra were processed in Flex Analysis 3.0 (Bruker Daltonics, Billerica, MA). Processing included 25 cycles of a Savitzky-Golay smoothing algorithm with a width of 0.15 and baseline subtraction using a median algorithm with a flatness value of 0.5 and a median value of 0.3. Monoisotopic peaks with an S/N >8 were selected in each MS/MS spectrum using the SNAP peak picking algorithm. All MS/MS spectra were loaded into Biotools 3.0 (Bruker Daltonics) and converted into a single MASCOT generic format (.mgf) data file. This file was submitted into a MASCOT (Matrix Science, Boston, MA) search engine and run against the Swiss-Prot database to match tryptic peptide sequences to their respective intact proteins. The MS/MS spectrum search was performed with a parent ion tolerance of 200 ppm and a fragment ion tolerance of ±0.4 Da. The search criteria also included up to three missed cleavages and variable modifications, including protein N terminus acetylation, histidine/tryptophan oxidation, and methionine oxidation.
2.6 Data analysis
Statistical analyses of MS profiles were carried out using ClinPro Tools 2.0 (Bruker Daltonics). Classes of spectra were loaded into the software and baseline correction was achieved using a top hat algorithm with a 10% minimal baseline width. ClinPro Tools automatically normalizes all spectra to their own TIC. Thus, for each spectrum the TIC is determined as the sum of intensities from all data points in the spectrum. Subsequently, all data point intensities of this spectrum are divided by the obtained TIC value bringing all intensities into the range of [0,1]. Peaks in the spectra were selected manually and the maximum intensity within each of the defined peak integration areas was used as the comparative value. The classification model used in this analysis was built using a support vector machine algorithm (SVM) using 73 peaks determined through statistical comparison by means of a t-test and minimum threefold intensity difference average. The number of neighbors for the K-NN classification parameter in the SVM settings was set to 3.
3 Results
The FFPE TMA analyzed in this study contains 1-mm needle core biopsies from lung tumors diagnosed as adenocarcinoma and squamous cell carcinoma, as well as adjacent normal control tissue and other NSCLC tumors. Only the adenocarcinoma and squamous cell carcinoma biopsies are considered in this study due to the limited number of samples for the other cancer types. The layout of the TMA analyzed is such that there are duplicate needle core punches for several of the biopsies. Therefore, the TMA contains 22 squamous cell carcinoma needle cores from 14 different patients (8 duplicates and 6 unpaired) and 18 adenocarcinoma needle cores from 12 different patients (6 duplicates and 6 unpaired) that contain cancerous regions and are considered in the study. In the discovery and protocol development process, an H&E-stained section of the TMA was first analyzed by a pathologist using light microscopy and the cancer, non-cancer, and normal regions were marked in each biopsy. Non-cancer regions consist of tissue that is not cancerous but is not normal either, including areas of inflammation, scar tissue, etc. The cellular regions that could not be clearly identified were not marked and therefore were not used in the statistical model generation step. This marked tissue section was then co-registered with a serial TMA section analyzed by MALDI IMS (Fig. 1), enabling individual mass spectra obtained from each coordinate position on the tissue (pixel) to be linked to that same precise histological region in the TMA.
Figure 1.
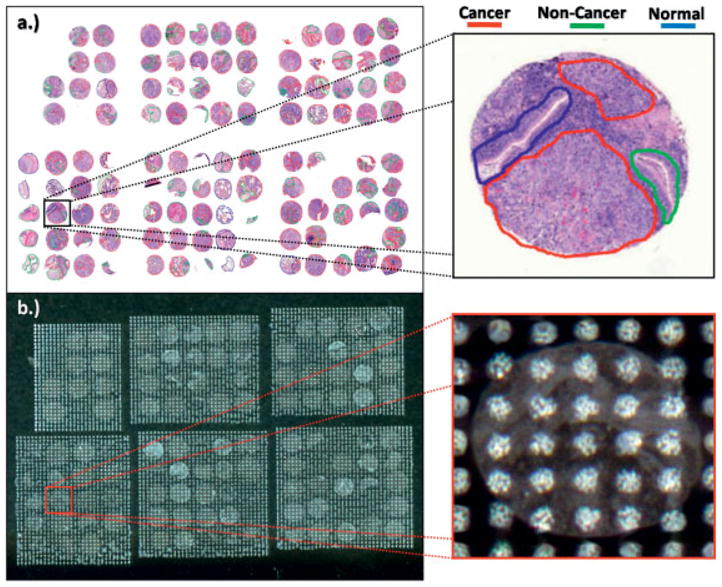
(a) TMA H&E with histological regions marked (b) TMA spotted with trypsin/matrix for MS analysis.
The mass spectrum generated at each spot on the digested tissue typically contains many hundreds of peaks with S/N>3 (Fig. 2a). The ensemble of tryptic peptides at each position represents a variety of proteins with a broad range of functionality and molecular weights. The signal intensities of the tryptic peptides are mediated by several factors, i.e. protein concentration differences, variations in enzymatic digestion efficiency, and differences in desorption and ionization efficiencies. Nonetheless, mass spectra from similar histological regions contain peak profiles with a high degree of concordance, demonstrating a consistent and reproducible methodology as shown in Fig. 3. This figure illustrates, as expected, that the average spectra generated from the cancer regions of two duplicate biopsies are extremely similar. This reproducibility is further exhibited using a t-test and minimum 1.6-fold intensity difference comparison for the 200 most intense peaks in the average spectrum from the cancer regions of each biopsy. Based on these criteria, it was determined that there were no statistically significant differences in any of the peak intensities between the two biopsies. It should be noted that these are two different needle cores form the same biopsy and thus are not identical pieces of tissue.
Figure 2.
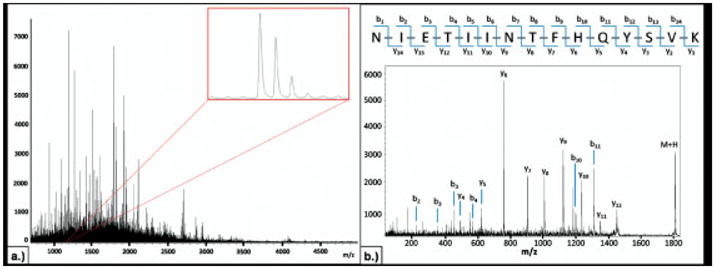
(a) Representative spectrum from an individual digest spot. (b) Example of an MS/MS spectrum acquired directly from the FFPE TMA and sequenced as a tryptic peptide from S100-A9.
Figure 3.
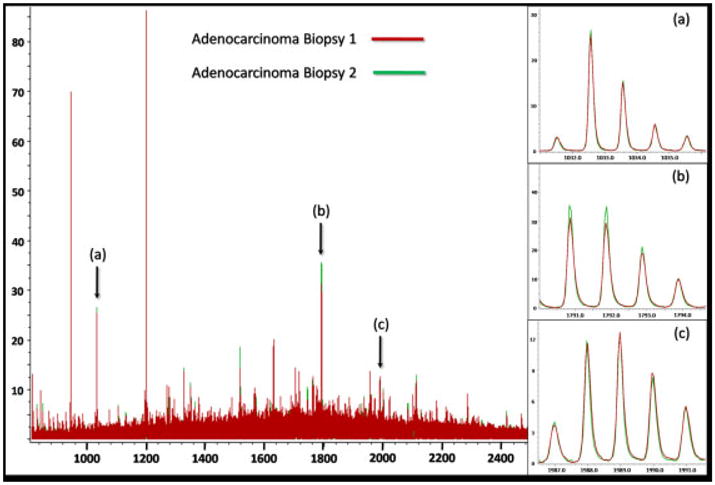
Overlay of the average spectra for two duplicate needle cores in the TMA from the same adenocarcinoma biopsy.
The protease hydrolysis step is essential to generate peptide fragments derived from non-cross-linked domains and enable identification directly from their location in the tissue. Typically, the process generates hundreds of tryptic peptides in a mass range (m/z 500–3000) amenable for sequence analysis using a MALDI-TOF/TOF instrument. Thus, selected peptides are desorbed and sequenced directly from the tissue and subsequently linked to the respective intact proteins originally present. Currently, we have identified ~50 proteins directly from the lung tumor TMA using MALDI MS/MS sequence analysis (Supporting Information Table 1). An example of an MS/MS spectrum acquired directly from the FFPE-TMA and sequenced as a peptide from the protein S100-A9 is shown in Fig. 2b. The ability to visualize the spatial localization of a set of tryptic peptides generated from a single parent protein provides an additional level of validation, given that the distribution of these species should be identical. For example, heat shock protein beta-1 was found to be localized almost exclusively to the cancer regions of a subset of the squamous cell carcinoma biopsies. Three tryptic peptides from this protein were detected and sequenced using MS/MS sequence analysis, including m/z 987.60, 1163.62, and 1905.99. Figure 4a shows the average spectra for three different squamous cell carcinoma biopsies, including two, from which the tryptic peptides for heat shock protein beta-1 were detected and identified, using MS/MS sequence analysis, as well as a third biopsy where this protein was not detected. The zoomed spectra view for the three tryptic peptides from this heat shock protein beta-1 shows the consistent peak distributions for proteins detected at similar levels in different tissue samples. Furthermore, Fig. 4b illustrates the similar ion-density distribution of these three peptides across the TMA.
Figure 4.
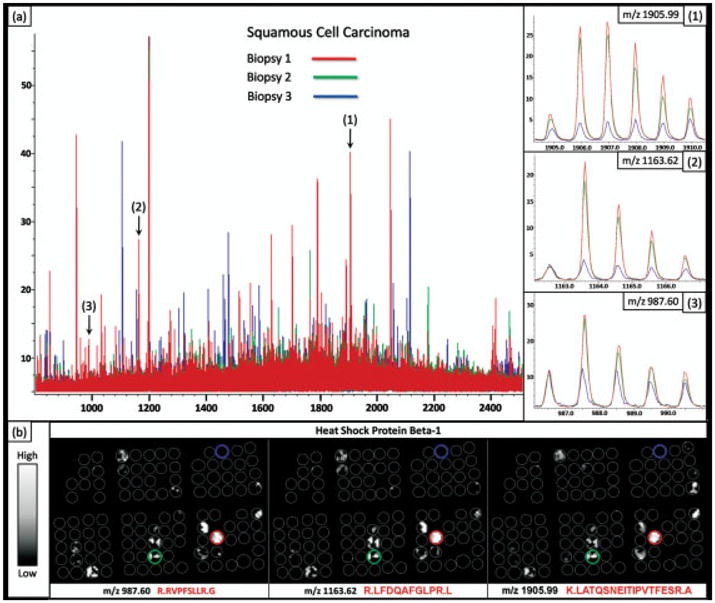
(a) Overlay of average spectrum from three separate squamous cell carcinoma biopsies in the TMA. (b) The distribution of three tryptic peptides from heat shock protein beta-1 across the TMA.
The layout of the TMA used in these analyses is shown in Fig. 5a. This TMA was constructed to contain duplicate needle cores from several of the tumor biopsies along with unpaired biopsies and a set of biopsies from adjacent non-involved normal lung tissue. For statistical analysis, the biopsies are separated into two datasets; set 1 is used as a training set to build the classification models and set 2 is used to evaluate the accuracy of this model through cross-validation. The first step in analyzing the dataset generated from the imaging experiment is to develop a classification model that can differentiate the different cancer regions from the non-cancer and normal regions. The classification models are generated by first grouping together the spectra from each of the cancer and non-cancer regions into separate folders for each biopsy in the TMA. This is completed using the cancer diagnoses and marked histological regions on each biopsy as shown in Fig. 5b. Since the average size of a matrix spot in these analyses is ~175 μm, it is possible that some matrix spots are positioned across multiple histological regions, creating a mass spectrum partially representative of each of the underlying cell types. In the training phase, only spectra that are clearly located within a single histological region are included for generating the statistical classification models. The spectra, that meet this positional criterion in set 1 of the TMA patient biopsies, are exported into the appropriate adenocarcinoma, squamous cell carcinoma, non-cancer, or normal class groupings to be used for model generation. For example, Fig. 6 shows the average spectra for a squamous cell carcinoma needle core biopsy overlayed with the average spectra from a needle core biopsy taken from adjacent normal tissue from the same patient. The peak distributions in these two spectra are very different and there are clearly a large number of ions present that can be used as class identifiers.
Figure 5.
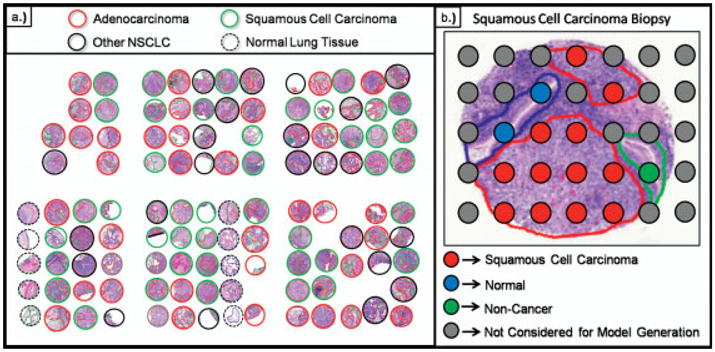
(a) H&E stain of a TMA section with pathological diagnosis outlining each biopsy. (b) Each individual spectrum is grouped based on the histological region from which it was acquired.
Figure 6.
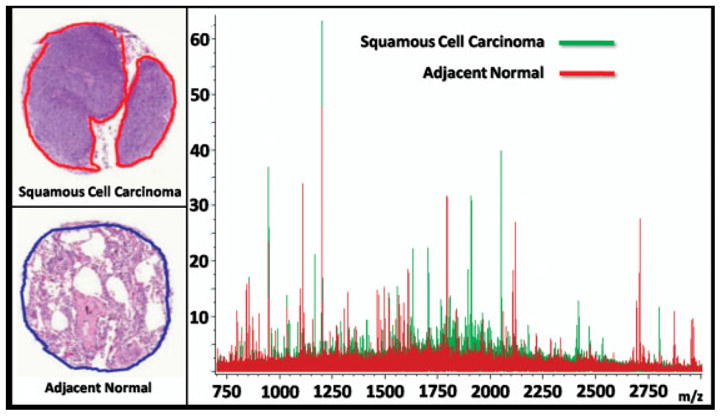
Overlay of average spectra from a squamous cell carcinoma needle core biopsy and an adjacent normal tissue needle core biopsy taken from the same patient.
Several approaches can be used to systematically identify peaks that sufficiently distinguish the various tumor classes from each other. The most straightforward way to do this is to combine the spectra in each group to create an average spectrum representative of a class identified through histology. The peaks present in these average spectra can then be compared through statistical analysis to identify a subset of peaks that are significantly different between each group and can therefore be used as the class identifiers. To do this, the statistical software (Bruker Clin-Pro Tools) was used to create a table of average intensity and standard deviations for a set of the 200 most intense peaks in the average spectrum for both the adenocarcinoma and squamous cell carcinoma samples. The set of 200 peaks were evaluated between samples using a t-test and minimum threefold intensity difference average comparison to determine a list of class identifiers. The limitation of this method is that it is possible that peaks, which may be significant among a small subset of spectra in a group, will become insignificant when averaged with the other spectra in that group. For example, the peptide at m/z 1410.7, a tryptic peptide from keratin, type II cytoskeletal 5, shows a distribution localized exclusively to a subset of the squamous cell carcinoma biopsies (Fig. 7). This is further illustrated when a statistical comparison of the average peak intensity in the squamous cell carcinoma biopsies for m/z 1410.7 is compared to the set of adenocarcinoma biopsies. A significance analysis using a minimum twofold intensity difference threshold and a t-test shows that when all spectra from each of the adenocarcinoma and squamous cell carcinoma biopsies in the training set are combined into two average spectra, m/z 1410.7 is not a significant class identifier. However, when a subgroup of squamous cell carcinoma biopsies that do express cytokeratin 5 are averaged and compared to the adenocarcinoma biopsies, this peak is a significant classifier.
Figure 7.
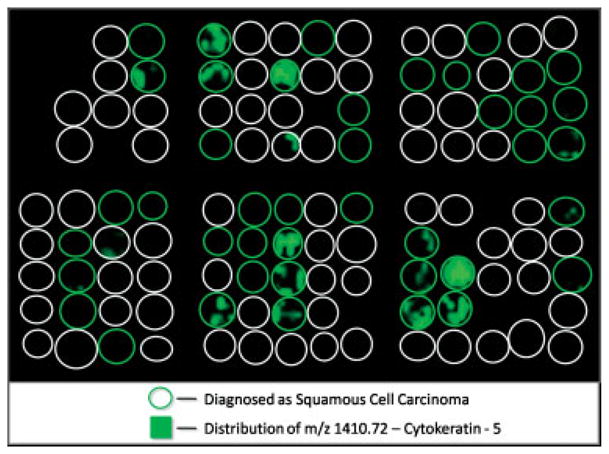
Ion density map of m/z 1410.70 showing an exclusive distribution to a subset of the squamous cell carcinoma biopsies.
To address the heterogeneity of peak distributions for biopsies with the same diagnosis, it may be necessary to first cluster the samples within each histology class based on a similarity criteria. This is done by comparing the average intensity and SD calculated in the average spectrum for each individual adenocarcinoma sample in the TMA to the values in the average spectrum for each individual squamous cell carcinoma sample and vice versa. A similarity value for each comparison was calculated by assessing the number of peaks out of the 200 that were determined to be significantly different between the two samples. This value is used to evaluate the heterogeneity of peak distributions within a class (i.e. adenocarcinoma) and between classes (i.e. adenocarcinoma vs. squamous cell carcinoma). This similarity value is used as a general measure of the reproducibility for this method by comparing the peak distributions of two different needle core biopsies that were taken from the same patient sample. A list of class identifiers was developed by tabulating the frequency that each peak is determined to be statistically different between the individual adenocarcinoma and squamous cell carcinoma samples. These peaks are used to cluster patient samples with the same pathological diagnosis into subclasses with other samples having a similar peak distribution (data not shown).
It was also possible to classify the adenocarcinoma and squamous cell carcinoma regions successfully using the combined average spectra for each group to develop a peak list of class identifiers. The classification models were built using a support vector machine (SVM) algorithm that can then classify spectra based on the supervised learning from the training set. The SVM algorithm used in these experiments incorporated 73 peaks, determined through statistical comparison of the peaks in the training sets for both adenocarcinoma and squamous cell carcinoma as described above. The SVM model was run against all spectra in the dataset and the outcome of each classification was visualized using the class imaging function in FlexImaging 2.0. For example, Fig. 8 displays the statistical classification of four TMA biopsies that are in agreement with the diagnosis made by the pathologist. This model classified the spectra from regions marked as adenocarcinoma by the pathologist with an accuracy of 97.9% (140/143 spectra) and squamous cell carcinoma with an accuracy of 98.6% (141/143 spectra). Another way to evaluate these data is a comparison of individual patients and on this basis, all 18 of the adenocarcinoma biopsies and all 22 of the squamous cell carcinoma biopsies were classified correctly. In the adenocarcinoma, the 3 mis-classified spectra were dispersed randomly throughout the dataset as single occurrences and therefore had little effect on the overall patient classifications. In the squamous cell carcinoma dataset, the 2 misclassified spectra came from a single biopsy in which the remaining 9 out of the total 11 spectra were classified correctly as squamous cell carcinoma. It is noted that the MS data was compared to normal histology/pathology, itself not a gold standard.
Figure 8.
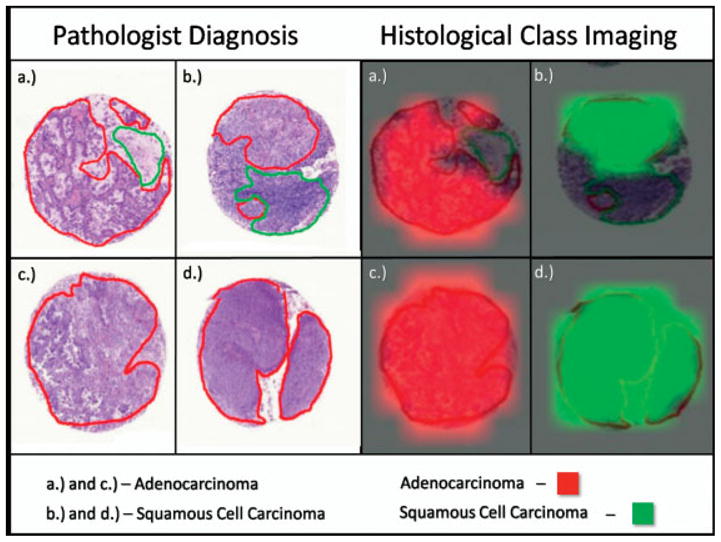
Visual representation of the statistical classification of four biopsies compared to the marking and diagnosis based on histology.
4 Discussion
Lung cancer is the primary cause of cancer deaths in the United States and worldwide [35]. The exceptionally high mortality rate associated with lung cancer can be attributed to the fact that it is usually diagnosed once the disease has progressed to an advanced stage [35]. The prognosis for lung cancer patients is generally poor with 5-year survival rates below 15% [36]. This unfortunate prognosis is highlighted when considering that at diagnosis 50% of patients already have distant metastases [36]. Treatment of late stage lung cancer is mostly palliative and despite improvements in therapy regimens, approximately 90% of lung cancer patients will die from their disease [35, 37]. However, if the neoplasm is detected sufficiently early so that the disease is localized at the time of diagnosis, prompt surgical removal can increase the 5-year survival to 52% [36]. Therefore, much interest has been placed in the development of novel methods focused on the early detection of lung cancer.
A comprehensive understanding of the mechanisms behind carcinogenesis, tumor progression, and metastasis will require an in-depth analysis of not only the genome, but also the proteome, that direct central components in the signaling pathways that drive neoplasia [36]. Whereas mutations in the genomic contents of cells are known to be the principal cause of the onset of carcinogenesis, detecting the changes induced at the protein expression level should prove invaluable in characterizing the molecular machinery responsible for neoplasia [36]. These protein patterns should provide information of the underlying cellular processes that control the development of cancer and subsequent metastasis. Although mRNA patterns can be used to define subclasses and prognostic subsets of lung carcinomas [13, 38–40], they generally are not able to identify the proteins expressed in a tissue and how these proteins are modulated. Therefore, direct analysis of the proteome in cancer tissues may provide a more accurate representation of the current pathological state.
In this work, we provide evidence that using on-tissue digestion coupled with IMS and statistical analysis can be used to distinguish different lung cancer histologies and subclassify individual cancer types. Protein expression and relative quantification data can be generated for multiple patient tissue samples in a single experiment. This creates a platform for comparison that could be valuable in determining protein markers indicative of various disease states and other clinical information such as prognosis and treatment effectiveness.
The data presented are based on a single TMA for a small group of patients. The experiments described in this work were aimed at demonstrating the feasibility of classification of tumor samples in a TMA at the molecular level using MALDI IMS. In order to carry out a more systematic biomarker discovery, it will be necessary to evaluate the classification models built using this sample group on a much larger set (>200) of patient biopsies. This will also be essential in determining the true diagnostic and prognostic value this method of tissue analysis can offer. In order to effectively manage the enormous dataset generated in such experiments, new bioinformatics tools will need to be developed, allowing for better evaluation of the model generation and classification processes.
In terms of clinical applicability, it will be important to determine how effective the classification models generated using archived FFPE samples will be in diagnosing a fresh-frozen biopsy sample removed from a patient. Work in our laboratory comparing the results from an on-tissue digestion experiment on a fresh-frozen rat brain to those on an FFPE rat brain showed remarkably similar profiles (data not shown). Nevertheless, a more systematic and in-depth study will need to be carried out to determine the comparability of these two types of samples. One of the primary advantages of IMS is the visualization of the molecular content of a sample while maintaining the spatial integrity. This aspect proves essential for the analysis of samples that contain a heterogeneous distribution of cell types. For example, resected lung tumor biopsies exhibit a wide range of cellular morphologies, often containing areas of cancer cells dispersed within normal and preneoplastic tissue regions. Analysis of the proteome from these various regions requires that the cellular structure of the tissue be maintained. In situ trypsin digestion provides this distinct capability and, when coupled with IMS, provides a descriptive analysis of a tissue’s protein contents relatively quickly in a single experiment. Protein identification directly from tissue is not always straightforward because of the large number of peptides generated from proteolysis. We have recently begun analyzing these samples using an FT-ICR MS in an effort to address the complexity of the spectra through high-resolution and high-mass accuracy detection. Although the TOF mass analyzer has extraordinary analysis speed and throughput, it lacks the mass resolution needed to resolve all off the detected ions. Nonetheless, the advantage of maintaining the spatial location of the identified species is critical in achieving a comprehensive analysis of these highly heterogeneous tissue samples.
Supplementary Material
Acknowledgments
The authors would like to gratefully acknowledge the following sources of funding: NIH/NIGMS 5RO1GM58008-08, RO1 CA102353 and Damon Runyon Cancer Research Foundation (Ci-# 19-03) to PPM, and DOD W81XWH-05-1-0179.
Abbreviations
- FFPE
formalin-fixed paraffin-embedded
- H&E
hematoxylin and eosin
- IMS
imaging mass spectrometry
- NSCLC
non-small cell lung cancer
- TMA
tissue microarray
Footnotes
The authors have declared no conflict of interest.
References
- 1.Stoeckli M, Chaurand P, Hallahan DE, Caprioli RM. Imaging mass spectrometry: a new technology for the analysis of protein expression in mammalian tissues. Nat Med. 2001;7:493–496. doi: 10.1038/86573. [DOI] [PubMed] [Google Scholar]
- 2.Cornett DS, Reyzer ML, Chaurand P, Caprioli RM. MALDI imaging mass spectrometry: molecular snapshots of biochemical systems. Nat Methods. 2007;4:828–833. doi: 10.1038/nmeth1094. [DOI] [PubMed] [Google Scholar]
- 3.McDonnell LA, Heeren RMA. Imaging mass spectrometry. Mass Spectrom Rev. 2007;26:606–643. doi: 10.1002/mas.20124. [DOI] [PubMed] [Google Scholar]
- 4.Schwartz SA, Reyzer ML, Caprioli RM. Direct tissue analysis using matrix-assisted laser desorption/ionization mass spectrometry: practical aspects of sample preparation. J Mass Spectrom. 2003;38:699–708. doi: 10.1002/jms.505. [DOI] [PubMed] [Google Scholar]
- 5.Chaurand P, Norris JL, Cornett DS, Mobley JA, Caprioli RM. New developments in profiling and imaging of proteins from tissue sections by MALDI mass spectrometry. J Proteome Res. 2006;5:2889–2900. doi: 10.1021/pr060346u. [DOI] [PubMed] [Google Scholar]
- 6.Lemaire R, Wisztorski M, Desmons A, Tabet JC, et al. MALDI-MS direct tissue analysis of proteins: improving signal sensitivity using organic treatments. Anal Chem. 2006;78:7145–7153. doi: 10.1021/ac060565z. [DOI] [PubMed] [Google Scholar]
- 7.Aerni HR, Cornett DS, Caprioli RM. Automated acoustic matrix deposition for MALDI sample preparation. Anal Chem. 2006;78:827–834. doi: 10.1021/ac051534r. [DOI] [PubMed] [Google Scholar]
- 8.Lemaire R, Tabet JC, Ducoroy P, Hendra JB, et al. Solid ionic matrices for direct tissue analysis and MALDI imaging. Anal Chem. 2006;78:809–819. doi: 10.1021/ac0514669. [DOI] [PubMed] [Google Scholar]
- 9.Norris JL, Cornett DS, Mobley JA, Andersson M, et al. Processing MALDI mass spectra to improve mass spectral direct tissue analysis. Int J Mass Spectrom. 2007;260:212–221. doi: 10.1016/j.ijms.2006.10.005. [DOI] [PMC free article] [PubMed] [Google Scholar]
- 10.Groseclose MR, Andersson M, Hardesty WM, Caprioli RM. Identification of proteins directly from tissue: in situ tryptic digestions coupled with imaging mass spectrometry. J Mass Spectrom. 2007;42:254–262. doi: 10.1002/jms.1177. [DOI] [PubMed] [Google Scholar]
- 11.Shimma S, Furuta M, Ichimura K, Yoshida Y, Setou M. Direct MS/MS analysis in mammalian tissue sections using MALDI-QIT-TOFMS and chemical inkjet technology. Surface and Interface Analysis. 2006;38:1712–1714. [Google Scholar]
- 12.Lemaire R, Desmons A, Tabet JC, Day R, et al. Direct analysis and MALDI imaging of formalin-fixed, paraffin-embedded tissue sections. J Proteome Res. 2007;6:1295–1305. doi: 10.1021/pr060549i. [DOI] [PubMed] [Google Scholar]
- 13.Yanagisawa K, Shyr Y, Xu BJ, Massion PP, et al. Proteomic patterns of tumour subsets in non-small-cell lung cancer. Lancet. 2003;362:433–439. doi: 10.1016/S0140-6736(03)14068-8. [DOI] [PubMed] [Google Scholar]
- 14.Schwartz SA, Weil RJ, Thompson RC, Shyr Y, et al. Proteomic-based prognosis of brain tumor patients using direct-tissue matrix-assisted laser desorption ionization mass spectrometry. Cancer Res. 2005;65:7674–7681. doi: 10.1158/0008-5472.CAN-04-3016. [DOI] [PubMed] [Google Scholar]
- 15.Chaurand P, Sanders ME, Jensen RA, Caprioli RM. Proteomics in diagnostic pathology: Profiling and imaging proteins directly in tissue sections. Am J Pathol. 2004;165:1057–1068. doi: 10.1016/S0002-9440(10)63367-6. [DOI] [PMC free article] [PubMed] [Google Scholar]
- 16.Chaurand P, Schwartz SA, Reyzer ML, Caprioli RM. Imaging mass spectrometry: principles and potentials. Toxicol Pathol. 2005;33:92–101. doi: 10.1080/01926230590881862. [DOI] [PubMed] [Google Scholar]
- 17.Cornett DS, Mobley JA, Dias EC, Andersson M, et al. A novel histology-directed strategy for MALDI-MS tissue profiling that improves throughput and cellular specificity in human breast cancer. Mol Cell Proteomics. 2006;5:1975–1983. doi: 10.1074/mcp.M600119-MCP200. [DOI] [PubMed] [Google Scholar]
- 18.Lemhire R, Menguellet SA, Stauber J, Marchaudon V, et al. Specific MALDI imaging and profiling for biomarker hunting and validation: Fragment of the 11S proteasome activator complex, reg alpha fragment, is a new potential ovary cancer biomarker. J Proteome Res. 2007;6:4127–4134. doi: 10.1021/pr0702722. [DOI] [PubMed] [Google Scholar]
- 19.Rahman SM, Shyr Y, Yildiz PB, Gonzalez AL, et al. Proteomic patterns of preinvasive bronchial lesions. Am J Respir Care Med. 2005;172:1556–1562. doi: 10.1164/rccm.200502-274OC. [DOI] [PMC free article] [PubMed] [Google Scholar]
- 20.Caprioli RM. Deciphering protein molecular signatures in cancer tissues to aid in diagnosis, prognosis, and therapy. Cancer Res. 2005;65:10642–10645. doi: 10.1158/0008-5472.CAN-04-3581. [DOI] [PubMed] [Google Scholar]
- 21.Fox CH, Johnson FB, Whiting J, Roller PP. Formaldehyde fixation. J Histochem Cytochem. 1985;33:845–853. doi: 10.1177/33.8.3894502. [DOI] [PubMed] [Google Scholar]
- 22.Sompuram SR, Vani K, Messana E, Bogen SA. A molecular mechanism of formalin fixation and antigen retrieval. Am J Clin Pathol. 2004;121:190–199. doi: 10.1309/BRN7-CTX1-E84N-WWPL. [DOI] [PubMed] [Google Scholar]
- 23.Jiang X, Feng S, Tian R, Ye M, Zou H. Development of efficient protein extraction methods for shotgun proteome analysis of formalin-fixed tissues. J Proteome Res. 2007;6:1038–1047. doi: 10.1021/pr0605318. [DOI] [PubMed] [Google Scholar]
- 24.Hwang SI, Thumar J, Lundgren DH, Rezaul K, et al. Direct cancer tissue proteomics: a method to identify candidate cancer biomarkers from formalin-fixed paraffin-embedded archival tissues. Oncogene. 2007;26:65–76. doi: 10.1038/sj.onc.1209755. [DOI] [PubMed] [Google Scholar]
- 25.Crockett DK, Lin ZS, Vaughn CP, Lim MS, Elenitoba-Johnson KSJ. Identification of proteins from formalin-fixed paraffin-embedded cells by LC-MS/MS. Lab Invest. 2005;85:1405–1415. doi: 10.1038/labinvest.3700343. [DOI] [PubMed] [Google Scholar]
- 26.Hood BL, Darfler MM, Guiel TG, Furusato B, et al. Proteomic analysis of formalin-fixed prostate cancer tissue. Mol Cell Proteomics. 2005;4:1741–1753. doi: 10.1074/mcp.M500102-MCP200. [DOI] [PubMed] [Google Scholar]
- 27.Palmer-Toy DE, Krastins B, Sarracino DA, Nadol JB, Merchant SN. Efficient method for the proteomic analysis of fixed and embedded tissues. J Proteome Res. 2005;4:2404–2411. doi: 10.1021/pr050208p. [DOI] [PubMed] [Google Scholar]
- 28.Ahram M, Flaig MJ, Gillespie JW, Duray PH, et al. Evaluation of ethanol-fixed, paraffin-embedded tissues for proteomic applications. Proteomics. 2003;3:413–421. doi: 10.1002/pmic.200390056. [DOI] [PubMed] [Google Scholar]
- 29.Shi SR, Liu C, Balgley BM, Lee C, Taylor CR. Protein extraction from formalin-fixed, paraffin-embedded tissue sections: Quality evaluation by mass spectrometry. J Histochem Cytochem. 2006;54:739–743. doi: 10.1369/jhc.5B6851.2006. [DOI] [PubMed] [Google Scholar]
- 30.Kononen J, Bubendorf L, Kallioniemi A, Barlund M, et al. Tissue microarrays for high-throughput molecular profiling of tumor specimens. Nat Med. 1998;4:844–847. doi: 10.1038/nm0798-844. [DOI] [PubMed] [Google Scholar]
- 31.Battifora H. The multitumor (sausage) tissue block: novel method for immunohistochemical antibody testing. Lab Invest. 1986;55:244–248. [PubMed] [Google Scholar]
- 32.Battifora H, Mehta P. The checkerboard tissue block. An improved multitissue control block. Lab Invest. 1990;63:722–724. [PubMed] [Google Scholar]
- 33.Chaurand P, Schwartz SA, Billheimer D, Xu BJ, et al. Integrating histology and imaging mass spectrometry. Anal Chem. 2004;76:1145–1155. doi: 10.1021/ac0351264. [DOI] [PubMed] [Google Scholar]
- 34.Holle A, Haase A, Kayser M, Hohndorf J. Optimizing UV laser focus profiles for improved MALDI performance. J Mass Spectrom. 2006;41:705–716. doi: 10.1002/jms.1041. [DOI] [PubMed] [Google Scholar]
- 35.Wistuba II, Gazdar AF. Lung cancer preneoplasia. Annu Rev Pathol. 2006;1:331–348. doi: 10.1146/annurev.pathol.1.110304.100103. [DOI] [PubMed] [Google Scholar]
- 36.Conrad DH, Goyette J, Thomas PS. Proteomics as a method for early detection of cancer: a review of proteomics, exhaled breath condensate, and lung cancer screening. J Gen Intern Med. 2008;23(Suppl 1):78–84. doi: 10.1007/s11606-007-0411-1. [DOI] [PMC free article] [PubMed] [Google Scholar]
- 37.Minna JD, Roth JA, Gazdar AF. Focus on lung cancer. Cancer Cell. 2002;1:49–52. doi: 10.1016/s1535-6108(02)00027-2. [DOI] [PubMed] [Google Scholar]
- 38.Beer DG, Kardia SL, Huang CC, Giordano TJ, et al. Gene-expression profiles predict survival of patients with lung adenocarcinoma. Nat Med. 2002;8:816–824. doi: 10.1038/nm733. [DOI] [PubMed] [Google Scholar]
- 39.Bhattacharjee A, Richards WG, Staunton J, Li C, et al. Classification of human lung carcinomas by mRNA expression profiling reveals distinct adenocarcinoma subclasses. Proc Natl Acad Sci USA. 2001;98:13790–13795. doi: 10.1073/pnas.191502998. [DOI] [PMC free article] [PubMed] [Google Scholar]
- 40.Garber ME, Troyanskaya OG, Schluens K, Petersen S, et al. Diversity of gene expression in adenocarcinoma of the lung. Proc Natl Acad Sci USA. 2001;98:13784–13789. doi: 10.1073/pnas.241500798. [DOI] [PMC free article] [PubMed] [Google Scholar]
Associated Data
This section collects any data citations, data availability statements, or supplementary materials included in this article.