

Phospholipid binding leads to accelerated assembly of the bacterial SRP receptor FtsY and SRP, allowing cargo proteins to be delivered to target membranes more efficiently.
Abstract
The signal recognition particle (SRP) and SRP receptor comprise the major cellular machinery that mediates the cotranslational targeting of proteins to cellular membranes. It remains unclear how the delivery of cargos to the target membrane is spatially coordinated. We show here that phospholipid binding drives important conformational rearrangements that activate the bacterial SRP receptor FtsY and the SRP–FtsY complex. This leads to accelerated SRP–FtsY complex assembly, and allows the SRP–FtsY complex to more efficiently unload cargo proteins. Likewise, formation of an active SRP–FtsY GTPase complex exposes FtsY’s lipid-binding helix and enables stable membrane association of the targeting complex. Thus, membrane binding, complex assembly with SRP, and cargo unloading are inextricably linked to each other via conformational changes in FtsY. These allosteric communications allow the membrane delivery of cargo proteins to be efficiently coupled to their subsequent unloading and translocation, thus providing spatial coordination during protein targeting.
Introduction
Cotranslational protein targeting by the signal recognition particle (SRP) is an evolutionarily conserved and essential pathway that mediates the localization of many membrane and secretory proteins to the eukaryotic ER or the bacterial plasma membrane (Walter and Johnson, 1994; Cross et al., 2009). As in other important cellular pathways, protein targeting is a complex process that requires exquisite spatial and temporal coordination. Targeting begins when SRP recognizes its cargo, ribosome–nascent chain complexes (RNCs) carrying signal sequences that specify the cellular destination of the cargo protein (Walter et al., 1981; Pool et al., 2002). Cargo loading on the SRP triggers efficient complex assembly between the SRP and SRP receptor (SR; Bradshaw et al., 2009; Zhang et al., 2009), and membrane localization of SR allows the cargo to be delivered to the target membrane. There, the SRP switches to a cargo-releasing mode and unloads the RNC to the protein translocation machinery, where the nascent polypeptide is either integrated into the membrane or translocated across the membrane to enter the secretory pathway (Simon and Blobel, 1991; Rapoport, 2007).
Protein targeting is controlled by GTP-regulated dimerization between the SRP and SR. Both proteins contain a GTPase G domain and a helical N domain (Freymann and Walter, 2000), which together form a structural and functional unit called the NG domain that mediates the interaction between SRP and SR (Montoya et al., 1997a; Egea et al., 2004; Focia et al., 2004). Previous work showed that the SRP–SR interaction is a highly dynamic process involving at least three discrete conformational stages (Shan et al., 2004; Zhang et al., 2008; Shan et al., 2009). Both GTPases by themselves are in an open conformation that exhibits low basal GTPase activity and is suboptimal for binding one another. In this state, they quickly associate to form a transient early intermediate independently of GTP (Zhang et al., 2008). This intermediate is characterized by loose interactions between the two GTPases, but binds RNC with high affinity (Zhang et al., 2009). To unload the cargo and complete protein targeting, the early intermediate needs to undergo a series of GTP-dependent rearrangements to the more stable closed and activated conformations. Rearrangement to the closed complex involves readjustments at the N–G domain interface so that the N domains of both GTPases approach one another and form interface contacts that stabilize the heterodimer (Egea et al., 2004; Focia et al., 2004; Shan et al., 2004). A subsequent rearrangement of the catalytic loops positions multiple catalytic residues with respect to GTP, giving an activated complex that efficiently hydrolyzes GTP (Egea et al., 2004; Focia et al., 2004; Shan et al., 2004). Both of these rearrangements are essential for switching the SRP from a cargo-binding to a cargo-releasing mode, enabling the efficient unloading of cargo and initiation of protein translocation (Halic et al., 2006; Shan et al., 2007; Zhang et al., 2009). At the end of the targeting reaction, GTP hydrolysis from the activated complex drives the disassembly and recycling of SRP and SR (Connolly et al., 1991).
Intriguingly, cargo stabilizes the SRP–SR GTPase complex in the early conformational stage and disfavors its rearrangement into the closed and activated complexes (Zhang et al., 2009). In the absence of the target membrane, this could allow the SRP–SR complex to retain its cargo and prevent premature GTP hydrolysis, thus avoiding abortive targeting reactions. However, as described in the previous paragraph, to complete the targeting reaction the effect from cargo needs to be overcome to allow the GTPase complex to rearrange to its subsequent conformational states. Interaction of the SR with the target membrane provides an attractive molecular trigger to induce these rearrangements, thus driving the cargo handover and GTPase recycling events during late stages of protein targeting.
Eukaryotic SR is a heterodimeric complex comprised of the α and β subunits. SRα is a soluble protein but contains an X domain that allows it to dimerize with SRβ, an integral membrane protein, thus localizing the SR to the ER membrane (Schwartz and Blobel, 2003). The bacterial SR is a single protein FtsY highly homologous to SRα, except that FtsY does not contain a transmembrane domain. Instead, FtsY is localized to the membrane through an N-terminal A domain. An amphiphilic α-helix at the junction of the A and N domains provides an important lipid-binding motif (Parlitz et al., 2007). This helix is formed primarily by residues at the N terminus of the N domain (197–207), but α-helix formation requires Phe196 from the A domain (Parlitz et al., 2007). Hence, an FtsY-NG+1 construct, in which only Phe196 from the A domain was retained, exhibited lipid-binding activity (Parlitz et al., 2007) and could complement FtsY depletion in vivo (Eitan and Bibi, 2004). Another amphiphilic helix at the N terminus of the A domain also contributes to lipid binding of FtsY (Weiche et al., 2008). Finally, FtsY also binds the SecYEG translocation machinery, which provides another membrane attachment for FtsY (Angelini et al., 2005, 2006).
Although multiple membrane-binding motifs have been identified, FtsY does not bind membrane as tightly as an integral membrane protein. In early cell fractionation studies, a substantial amount of FtsY was found in the cytosol (Luirink et al., 1994). A more recent microscopy study suggested that the amount of FtsY localized to the membrane is more substantial than previously suggested from fractionation studies, presumably because FtsY easily dissociated from the membrane during cell fractionation (Mircheva et al., 2009). In another fluorescence microscopy study in Bacillus subtilis, however, ∼60% of FtsY was found in the cytosol (Rubio et al., 2005). Further, only a small fraction of FtsY associates with membranes in biochemical assays (Parlitz et al., 2007 and this paper), which suggests that lipid binding of FtsY by itself is fairly weak. Together, these observations suggest that the association of FtsY with membrane is much more dynamic compared with that of integral membrane proteins.
Despite the progress toward understanding how FtsY binds the membrane, the molecular mechanisms by which membranes regulate FtsY’s activity to ensure productive and efficient protein targeting remain to be elucidated. Many intriguing questions remain: How is the membrane localization of FtsY productively coupled to the protein targeting reaction? Can FtsY’s GTPase cycle and its GTP-dependent interaction with the SRP be regulated by the membrane to spatially coordinate protein targeting? Conversely, can FtsY’s membrane-binding activity be regulated by its unique GTPase cycles? Previous studies suggested that this could be the case. FtsY’s basal GTPase reaction was stimulated by liposomes (de Leeuw et al., 2000), and studies of both the Escherichia coli and chloroplast FtsY detected an approximately twofold lipid stimulation of the GTPase reaction when both SRP and FtsY are present (Bahari et al., 2007; Marty et al., 2009). Nevertheless, a complete and rigorous mechanistic dissection of the functional consequences of FtsY’s lipid binding on its conformational changes and its interactions with the SRP remains to be performed, and the broader relationship between FtsY’s lipid binding and the protein targeting reaction remains to be addressed.
Here, we show that interaction with phospholipids regulates multiple biochemical activities of FtsY, and drives the rearrangement of FtsY and the SRP–FtsY complex to the activated conformation. Reciprocally, formation of a stable and active SRP–FtsY complex exposes FtsY’s lipid-binding motif and allows much stronger association with the membrane. These results demonstrate that the GTPase cycle of FtsY and the SRP–FtsY complex can be allosterically regulated in response to spatial cues such as membrane binding, and these allosteric regulations allow the targeting of cargo proteins to be efficiently coupled to their unloading and translocation.
Results
Phospholipids stimulate the basal GTPase activity of FtsY
Previous work showed that liposomes derived from a phospholipid mixture composed of 70% phosphatidylglycerol (PG) and 30% phosphatidylethanolamine (PE) stimulated the basal GTPase reaction of FtsY >100-fold, whereas the NG domain of FtsY (FtsY-NG) was stimulated to a much lesser extent (de Leeuw et al., 2000). These results were recapitulated in our experiments (Figs. 1 A and S1). Further, quantitative analysis of the lipid concentration dependence of this stimulation provided additional insights. First, the lipid stimulation curve was cooperative, with a Hill coefficient of 2.9 (Fig. 1 A, red), which suggests that the action of multiple lipid molecules is required for this stimulation. Second, the interaction of free FtsY with lipids is fairly weak, requiring a high concentration of liposomes (>3 mM) to reach saturation (Fig. 1 A, red). Although the lipid concentration in these experiments did not reflect the situation in vivo where the lipid distribution is heterogeneous, the apparent binding constants obtained from these analyses provided an operational measure of the ability of FtsY to bind phospholipids, allowing us to probe the change in FtsY’s lipid–binding ability as the reaction components are varied (see the following sections).
Figure 1.
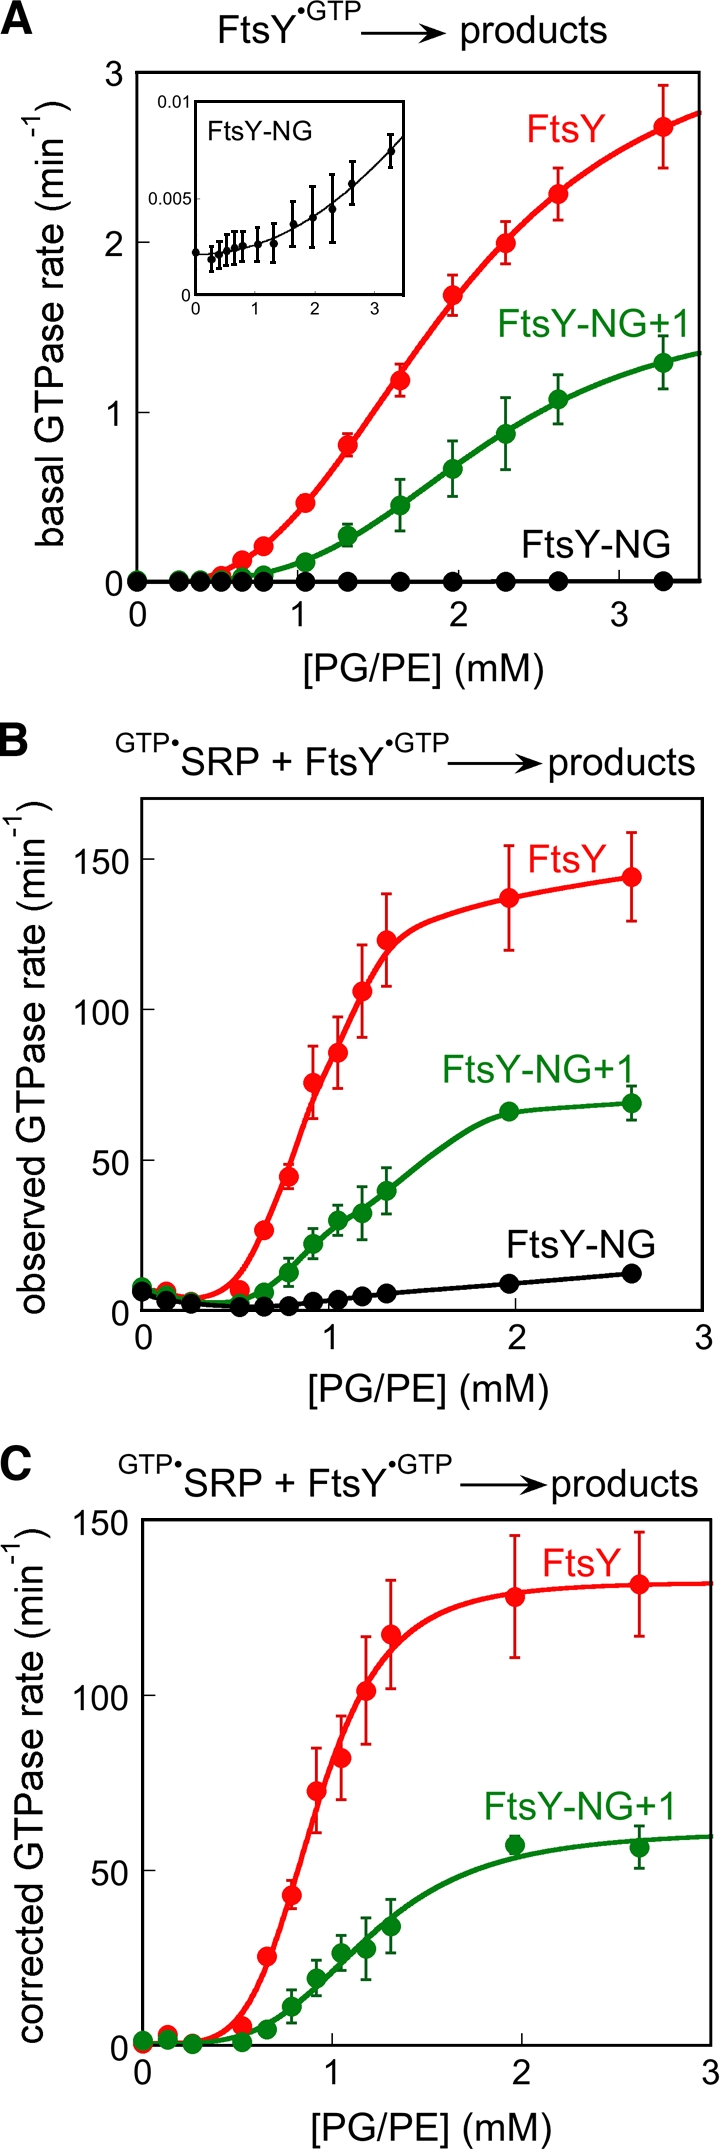
Phospholipids stimulate FtsY’s basal GTPase activity and its complex assembly with SRP. (A) Effect of liposomes on the basal GTPase reaction of FtsY (red), FtsY-NG+1 (green), and FtsY-NG (black and inset). The data were fit to Eq. 2, and gave Hill coefficients of 2.9 and 3.4 for FtsY and FtsY-NG+1, respectively, and an apparent Kd value of 2.0 and 2.2 mM for lipid binding to FtsY and FtsY-NG+1, respectively. (B) Effect of liposomes on the reaction: GTP•SRP + FtsY•GTP → products for FtsY (red), FtsY-NG+1 (green), and FtsY-NG (black). (C) A domain–specific lipid stimulation of complex assembly with FtsY (red) and FtsY-NG+1 (green), after subtraction of the rate constants from FtsY-NG. The data were fit to Eq. 2, and gave Hill coefficients of 4.4 and 3.8 for FtsY and FtsY-NG+1, respectively. Error bars indicate SD.
Phospholipids accelerate formation of the activated SRP–FtsY complex
Formation of a stable, GTP-dependent SRP–FtsY complex is slow because it requires extensive rearrangements of FtsY from the open to the closed and activated conformations (Shan et al., 2004, 2009). To test whether the interaction of FtsY with phospholipids helps overcome this kinetic barrier, we used a well-established GTPase assay to measure the reciprocally stimulated GTPase reaction between SRP and FtsY. At subsaturating FtsY concentrations, this assay measures the second-order reaction: GTP•SRP + FtsY•GTP → products, which is rate-limited by the formation of a stable and active GTP•SRP–FtsY•GTP complex (Peluso et al., 2001). This provides a convenient way to test the effect of phospholipids on the rate of stable SRP–FtsY complex assembly. Despite the stimulation of FtsY’s basal GTPase activity by lipids, the basal GTPase rate was still significantly slower than that of the stimulated GTPase reaction (compare the y axis in Fig. 1 A vs. Fig. 1 B) and did not interfere with the analyses in the following paragraphs.
Stable SRP–FtsY complex assembly was strongly stimulated by liposomes, with >100-fold rate acceleration observed at saturating lipid concentrations (Fig. 1 B, red). The lipid concentration dependence of this stimulation was complex, with an initial inhibition at lipid concentrations below 0.3 mM followed by a cooperative stimulation at higher lipid concentrations (Fig. 1 B, red). The same initial inhibitory effect was also observed with FtsY-NG, but FtsY-NG did not undergo substantial lipid-induced stimulation of complex assembly (Fig. 1 B, black). SRP’s activity was also not significantly stimulated by lipids (Fig. S2). Thus, this stimulation is specific to the interaction of lipids with the FtsY A domain. To isolate this specific effect, we subtracted the liposome effects on the reaction of FtsY-NG from those of full-length FtsY (Fig. 1 C, red). This yielded a highly cooperative lipid stimulation curve with a Hill coefficient of 4.4 (Fig. 1 C, red), which suggests that the cooperative action of at least four lipid molecules is required to stimulate SRP–FtsY complex assembly.
An important lipid-binding motif was identified at the junction between the A and N domains of FtsY (Parlitz et al., 2007), but it was unclear whether the remainder of the A domain contributes to lipid binding or stimulation. To address this question, we compared the ability of liposomes to stimulate full-length FtsY and FtsY-NG+1, in which only the lipid-binding helix at the A–N domain junction was retained. The basal GTPase activity of FtsY-NG+1 and its complex formation with SRP were both strongly stimulated by liposomes (Fig. 1, A and B, green). The magnitude of the lipid stimulation with FtsY-NG+1 was approximately twofold smaller than that with full-length FtsY (Fig. 1, A and B, green vs. red), but was still 50–100-fold compared with the rate in the absence of lipids. The lipid stimulation curves for FtsY-NG+1 were also highly cooperative, giving Hill coefficients of 3.4 and 4.2 in the basal GTPase reaction and in complex assembly with SRP, respectively (Fig. 1 A and B, green). Thus, the amphiphilic helix at the A–N domain junction provides the primary site for stimulation of FtsY by phospholipids, and the remainder of the A domain modulates this effect by twofold. These findings are consistent with the observation that expression of FtsY-NG+1 complements the defect of FtsY depletion in vivo (Eitan and Bibi, 2004). In further support of this notion, we performed in vitro protein targeting assays and found that FtsY-NG+1 was able to mediate efficient cotranslational targeting of a model SRP substrate into membrane vesicles (Fig. 2). The efficiency of translocation was only 26% lower with FtsY-NG+1 than with full-length FtsY (Fig. 2).
Figure 2.

Role of the FtsY A domain in preprotein targeting and translocation. (A) SDS-PAGE analysis of the translocation efficiency of pPL mediated by FtsY, FtsY-NG+1, and FtsY-NG. (B) Quantitation of the results in A. Error bars indicate SD.
To provide direct evidence for a lipid-induced acceleration of complex assembly and to more accurately quantify the magnitude of this effect, we used a fluorescent probe, FtsY conjugated with acrylodan at residue C356, to directly measure SRP–FtsY complex formation. This probe monitors the final conformational stage of the SRP–FtsY complex, the activated state (Zhang et al., 2009). The presence of liposomes caused a large increase and a blue shift in the fluorescence emission spectrum of FtsY (Fig. 3 A, open black vs. red circles), which was expected, as acrylodan is highly sensitive to changes in solvent polarity. In the presence of liposomes, formation of the SRP–FtsY complex in the presence of a GTP analogue, 5′-guanylyl imido-diphosphate (GppNHp), induced a red shift and an ∼30% reduction in the fluorescence intensity of this probe, producing a spectrum that overlaps with that of the SRP–FtsY complex in the absence of liposomes (Fig. 3 A, closed red and black circles). Thus, in the absence of liposomes, the increase in fluorescence of acrylodan-labeled FtsY C356 was used to monitor complex formation (Fig. 3 A, open vs. closed black circles; and Fig. 3 B), whereas in the presence of liposomes, the decrease in fluorescence was used (Fig. 3 A, open vs. closed red circles; and Fig. 3 C). The rate constant for formation of the activated SRP–FtsY complex was 3.0 × 10⁶ M−1s−1 in the presence of liposomes, which is 160-fold faster than that in the absence of liposomes (Fig. 3 D). This provides direct evidence that phospholipids substantially accelerate formation of a stable and active SRP–FtsY complex.
Figure 3.

Phospholipids accelerate formation of the activated SRP–FtsY complex. (A) Fluorescence emission spectra of acrylodan-labeled FtsY C356 in the presence (closed circles) or absence (open circles) of 5 µM SRP, with (red) or without (black) 2 mM of liposomes present. The scattering from buffer, SRP, and liposomes has been subtracted from the respective spectra. (B and C) Time courses for complex assembly were measured in the presence of 200 nM of acrylodan-labeled FtsY C356 and 200 µM GMPPNP without (B) or with (C) 2 mM of liposomes present. The data were fit to single exponential functions to yield observed rate constants at individual SRP concentrations. (D) Liposomes accelerate formation of the activated SRP–FtsY complex. Observed rate constants for complex formation are from B and C. GNP denotes GppNHp. The inset shows the data in the absence of liposomes on an expanded scale. Linear fits of the data to Eq. 4 gave association rate constants of kon = 3.0 × 10⁶ and 1.8 × 10⁴ M−1s−1 in the presence and absence of liposomes, respectively. Error bars indicate SD from three or more measurements.
Phospholipids stabilize the activated conformation of the SRP–FtsY complex
A possible mechanism to account for the stimulatory effects of phospholipids on FtsY’s basal GTPase activity and on the kinetics of SRP–FtsY complex assembly is that interaction with phospholipids pre-organizes FtsY into the closed and activated conformations, which allows some of the unfavorable rearrangements during assembly of a stable, active SRP–FtsY complex to be bypassed. If this were true, then phospholipids should preferentially stabilize formation of the closed/activated SRP–FtsY complex. In contrast, the early intermediate, in which most of the GTPase rearrangements in FtsY have not taken place (see Fig. 6), should not be affected. To test this hypothesis, we determined the effect of phospholipids on the equilibrium stability of the SRP–FtsY complex at various conformational stages.
Figure 6.

Formation of the GTP-dependent SRP–FtsY complex exposes FtsY’s lipid binding helix. (A) Crystal structure of E. coli FtsY-NG+1 (PDB accession no. 2QY9). The amphiphilic lipid-binding helix at the A–N domain junction is highlighted in orange, and residue E229, which served as a negative control, is shown in blue. (B) EPR spectra of the nitroxide spin probe at residue T206 of FtsY-NG+1 for apo-FtsY (black), the early intermediate formed in GDP (red), and the closed/activated complex formed in GppNHp (green). ΔH indicates the central linewidth, and im and m denote the population of immobile and mobile molecules, respectively. (C and D) Summary of the central linewidth (C) and fraction of mobile molecules (D) for nitroxide probes placed at different positions along FtsY’s lipid-binding helix. Color coding is the same as in B. Error bars indicate SDs from two or more measurements.
To measure the stability of the early intermediate, we used fluorescence resonance energy transfer (FRET) between coumarin-labeled SRP C235 and BODIPY-fluorescein–labeled FtsY C487. FRET allows us to detect early stages of complex formation before any conformational changes take place (Zhang et al., 2008). The early intermediate was isolated by leaving out GTP during complex assembly; this prevents its rearrangement to the subsequent conformational states and allows us to characterize its equilibrium properties. As the early intermediate has a weak stability and does not accumulate significantly unless it is stabilized by the RNC (Zhang et al., 2008; Zhang et al., 2009), we measured the stability of the early intermediate in the presence of the RNC. The RNC–SRP–FtsY early intermediate exhibited equilibrium dissociation constants (Kd) of 68 and 104 nM in the absence and presence of liposomes, respectively (Fig. 4, A and D). Thus, phospholipids do not stabilize the early intermediate, but rather have a small destabilizing effect on this conformational state.
Figure 4.

FtsY preferentially stabilizes the SRP–FtsY complex in the closed and activated states. (A) Equilibrium titration of the early intermediate in the presence (red) and absence (black) of 2 mM of liposomes. Titrations used 100 nM of coumarin-labeled SRP C235, 200 nM RNC, and 200 µM GDP. (B) Equilibrium titration of the closed/activated complex in the absence (left) and presence (right) of 2 mM of liposomes. Titrations used 50 nM of coumarin-labeled SRP C235 and 200 µM GppNHp. (C) Equilibrium titration of the activated SRP–FtsY complex in the absence (left) and presence (right) of 2 mM of liposomes. Titrations used 100 and 40 nM of acrylodan-labeled FtsY C356 in the absence and presence of liposomes, respectively, and 200 µM GppNHp. The data were fit to Eq. 3, and the values of Kd are summarized in D. Representative fluorescence measurements are shown in A–C, and the Kd values reported in D are averaged from three or more measurements.
We also used FRET to measure the stability of the GTP-dependent closed and activated complexes by carrying out complex assembly in the presence of GppNHp. This drives the rearrangement of the complex into these GTP-dependent conformational states, and the complex thus obtained and monitored by FRET is a mixture of the closed and activated conformations. In the absence of liposomes, the closed/activated complex had a Kd value of 67 nM, and this Kd value lowered to 7.2 nM in the presence of liposomes (Fig. 4, B and D). To more specifically monitor the activated complex, we used acrylodan-labeled FtsY C356 (Fig. 4 C). In the absence of liposomes, the activated complex had a Kd value of 145 nM (Fig. 4 C, left), whereas in the presence of liposomes, the activated complex was much tighter, with an estimated Kd value of 4 nM or lower (Fig. 4 C, right; and Fig. 4 D), at least 40-fold lower than that in the absence of liposomes. Together, these results provide direct evidence that phospholipids specifically stabilize the closed and activated complexes and thus drive the rearrangement of the SRP–FtsY complex from the early intermediate to the subsequent, GTP-stabilized conformational states.
FtsY binds more strongly to lipids when it forms an active complex with SRP
If phospholipids preferentially interact with FtsY in the closed/activated conformations, then formation of the SRP–FtsY complex in the presence of GTP, which drives FtsY into these conformations, would allow FtsY to bind phospholipids more strongly. To test this prediction, we measured FtsY–lipid binding using density gradient flotation (Fig. 5 A). Free FtsY bound weakly to liposomes derived from E. coli lipids, with <5% FtsY cofractionating with lipids to the top of the density gradient (Fig. 5 A, left). In contrast, with the SRP–FtsY complex formed in the presence of GppNHp, the majority of both FtsY and the SRP protein Ffh cofractionated with lipids to the top of the gradient (Fig. 5 A, right). With FtsY-NG, which was not stimulated by lipids (Fig. 1), the free protein was found exclusively in the bottom fraction, and a significantly smaller amount of its complex with Ffh cofractionated with lipids during centrifugation (Fig. 5 B). These results, albeit qualitative in nature, directly demonstrate that FtsY binds more strongly to phospholipids when it forms the GTP-dependent closed/activated complex with SRP.
Figure 5.

The stable SRP–FtsY complex binds more strongly to lipids than free FtsY. (A and B) Density gradient flotation analysis of the binding of FtsY (left) and the SRP–FtsY complex (right) to E. coli liposomes for full-length FtsY (A) and FtsY-NG (B). (C) The effect of liposomes on the reaction GTP•SRP–FtsY•GTP → products with FtsY (red) and FtsY-NG (black). The data with FtsY was fit to Eq. 2, and gave a Hill coefficient of 4.8 and an apparent Kd value of 39 µM for FtsY–lipid binding in the complex. Error bars indicate SDs from two measurements.
To provide additional evidence for this model and to more quantitatively determine how much stronger FtsY binds phospholipids upon complex formation with SRP, we determined the effect of lipids on the stimulated GTPase reaction at saturating protein concentrations. Under these conditions, GTP hydrolysis from a stable, active GTP•SRP–FtsY•GTP complex (kcat) was monitored. Liposomes accelerated this reaction approximately twofold but had a negligible effect on the reaction of the complex formed by FtsY-NG (Fig. 5 C), which is consistent with previous observations (Bahari et al., 2007). Importantly, the lipid concentration dependence of this stimulation provided a means to measure the apparent affinity of lipids to the GTP•SRP–FtsY•GTP complex, as this complex was the predominant species in this reaction. Saturation could be reached at lipid concentrations above 65 µM for stimulation of the GTP•SRP–FtsY•GTP complex, at least 50-fold lower than that for free FtsY (compare Fig. 5 C vs. Fig. 1 A), which demonstrates that formation of an active SRP–FtsY complex strengthens the FtsY–lipid interaction by almost two orders of magnitude.
GTP-dependent complex formation with SRP exposes the lipid binding helix of FtsY
To understand how the allosteric communications between FtsY and phospholipids occur, we probed the structural dynamics of the lipid-binding helix at the A–N domain junction using electron paramagnetic resonance (EPR) spectroscopy. Individual residues in and adjacent to the lipid-binding motif of FtsY-NG+1 (residues 195–209; Fig. 6 A, orange), which was strongly stimulated by phospholipids (Fig. 1), were replaced by cysteines for site-directed spin labeling with the nitroxide probe (1-oxyl-2,2,5,5,-tetramethyl-3-pyrroline-3-methyl) methanethiosulfonate (MTSSL). Only the sites where the nitroxide substitution did not substantially disrupt the activity of FtsY and its interaction with SRP were examined by EPR (Table S1). Information about the local mobility of the nitroxide probe at each position can be obtained from two features of the EPR spectra (Hubbell et al., 1996; Hustedt and Beth, 1999; Hubbell et al., 2003): (1) the linewidth of the central resonance (Fig. 6 B, ΔH0) and (2) the overall breadth of the spectra along the magnetic field axis, especially the intensity of hyperfine splitting that arises from highly immobile populations of spin probes relative to the mobile population (Fig. 6 B, im vs. m).
As exemplified by residue 206, in apo-FtsY, the nitroxide probe exhibited broad EPR spectra with a significant population of immobile molecules and widened central linewidth (Fig. 6 B, black). The extremely low mobility of this probe indicates that residue 206 is engaged in strong tertiary interactions with the remainder of the FtsY molecule. No significant spectral change was observed when FtsY formed an early intermediate with SRP in the presence of GDP (Fig. 6 B, red). In contrast, the nitroxide probe exhibited significantly higher mobility when FtsY formed the closed/activated complex with SRP in the presence of GppNHp, as indicated by substantial reductions in both the central linewidth and the fraction of immobile population (Fig. 6 B, green). The same pattern of nitroxide mobility changes was observed for other positions in the lipid-binding helix (Fig. 6, C and D; and Fig. S3 A). In apo-FtsY and in the early intermediate, there were significant position-dependent variations in nitroxide mobility (Fig. 6 D, black and red), presumably reflecting periodic changes in the position of the probe along the solvent exposed versus more buried surfaces of the helix. Despite these variations, the nitroxide probes at all of these positions underwent significant increases in mobility upon formation of the GTP-dependent complex (Fig. 6, C and D; and Fig. S3A). In contrast, a spin probe labeled at residue 229 on the adjacent αN2 helix (Fig. 6 A, blue) did not exhibit significant mobility changes upon complex formation with SRP (Fig. S3 B). Together, these results demonstrate substantially reduced tertiary interactions and increased dynamics of FtsY’s lipid-binding helix upon formation of the closed/activated SRP–FtsY complex. They also suggest that rearrangement of the GTPase complex to these conformational states disrupts intramolecular interactions of the lipid-binding helix with the remainder of FtsY, and allows this helix to become more accessible.
Anionic phospholipids specifically bind and stimulate FtsY
The stimulatory effects of lipids on FtsY’s various activities described in the previous sections or previously (de Leeuw et al., 2000) were primarily obtained with liposomes containing 70% PG and 30% PE. The inner membrane of E. coli is composed primarily of PE (∼70%), with anionic phospholipids PG and cardiolipin present at ∼20% and ∼5%, respectively. To determine whether FtsY has a preference for specific types of phospholipids, we tested the ability of various lipids to stimulate FtsY’s basal GTPase reaction and to accelerate stable SRP–FtsY complex assembly. These two activities provided a sensitive and reliable readout for whether FtsY is stimulated by specific types of lipids, and could be conveniently measured with the GTPase assay. Liposomes derived from total E. coli lipids stimulated FtsY less efficiently than PG/PE: a higher lipid concentration was required to begin to observe a stimulation for both the basal GTPase activity of FtsY and its complex assembly with SRP, and both activities were stimulated less than eightfold at the highest liposome concentrations tested (Fig. 7, A and B). Even less stimulation was observed with liposomes lacking anionic phospholipids (70% PE and 30% phosphatidylcholine [PC]; Fig. 7, C and D). Interestingly, an initial inhibitory effect of lipids was also observed with the E. coli and PE/PC liposomes during SRP–FtsY complex assembly with both FtsY and FtsY-NG (Fig. 7, B and D), which suggests that this inhibition results from a highly nonspecific interaction of lipids either with SRP or with the FtsY-NG domain.
Figure 7.

FtsY is specifically stimulated by anionic phospholipids. (A and B) Effects of E. coli liposomes on FtsY’s basal GTPase rate (A) and on SRP–FtsY complex assembly (B). (C and D) The effect of 7:3 PE/PC liposomes on FtsY’s basal GTPase reaction (C) and on SRP–FtsY complex assembly (D). (E and F) Effects of PG (circles) liposomes on FtsY’s basal GTPase rate (E) and on SRP–FtsY complex assembly (F). (G and H) Effects of cardiolipin (closed circles) on FtsY’s basal GTPase rate (G) and on SRP–FtsY complex assembly (H). The dashed lines depict the data for PG/PE liposomes and are shown for comparison. Error bars indicate SDs from two or more measurements.
In contrast, liposomes comprised of anionic phospholipids strongly stimulated both activities of FtsY. Within experimental error, liposomes composed solely of PG stimulated FtsY with the same efficiency as PG/PE liposomes (Fig. 7, E and F), which suggests that the PG contained in the PG/PE liposomes was responsible for the stimulations observed in Figs. 1–4. Cardiolipin, which contains an additional negative charge in its head group than PG, stimulated FtsY even more efficiently (Fig. 7, G and H). Comparison of the lipid concentration dependences of the stimulation indicates that roughly the same magnitude of lipid stimulation could be obtained with both PG and cardiolipin at saturating lipids, but saturation could be reached with cardiolipin at much lower concentrations (Fig. 7, G and H). Thus, FtsY binds more strongly to cardiolipin than to PG, but once bound, these two lipids induce the same amount of stimulation for FtsY.
The reduced stimulation of FtsY by E. coli and PE/PC lipids could arise from a weaker binding of FtsY to these lipids than to PG and cardiolipin, or from the inability of these lipids to activate FtsY even when it is membrane bound. To distinguish between these possibilities, we directly measured the binding of FtsY to phospholipids using surface plasmon resonance (SPR). FtsY with a C-terminal His6 tag was immobilized on CM5 biosensor chips coupled with anti-His6 antibodies. Liposomes induced large changes in the SPR (Fig. 8 A). The kinetics of lipid binding to or dissociation from FtsY was rapid but complex (Fig. 8 A), as would be expected for a cooperative interaction. The resonance signals at 200 s, when the binding reaction reaches a plateau, were used to monitor the equilibrium for FtsY–liposome binding. The values of Kd obtained from the SPR experiments were, in general, an order of magnitude lower than those observed from enzymatic assays, presumably because of differences between measurements in solution versus those on a surface. Nevertheless, the following strongly suggest that SPR provides a reasonable comparison of the relative interactions of FtsY with different lipids: (a) in all cases, minimal or low lipid binding was observed with FtsY-NG (Fig. 8, B–D, black), which suggests that the ability of the FtsY A domain to interact with lipids was faithfully recapitulated in SPR measurements; (b) FtsY-NG+1 bound liposomes approximately threefold weaker than full-length FtsY (Fig. S4), which is consistent with the twofold difference observed in solution studies, and indicates that the lipid-binding helix at the A–N domain junction of FtsY was primarily responsible for lipid binding in SPR experiments; and (c) the FtsY-lipid binding curves were cooperative and exhibit Hill coefficients of 3–4 (Figs. 8 and S4), which is also consistent with observations from solution studies. Thus, although the values of Kd obtained from SPR measurements were lower than those in solution, SPR provided a reasonable and semiquantitative tool to compare the relative binding of FtsY to liposomes with different compositions.
Figure 8.

FtsY binds specifically to anionic phospholipids. (A) SPR traces depicting resonance changes on FtsY-immobilized biosensor chips due to liposome binding. The numbers above each line denote the corresponding liposome concentration. (B–D) Equilibrium binding curves of FtsY (red) or FtsY-NG (black) to liposomes composed of 7:3 PE/PC (B), 7:3 PG/PE (C), and E. coli (D) lipids. The data were fit to Eq. 5 to obtain the apparent Kd values and hill coefficients (h) for FtsY-lipid binding.
FtsY bound to liposomes composed of PE and PC weakly, with an apparent Kd value of 0.51 mM (Fig. 8 B), whereas it bound PG/PE liposomes approximately eightfold more strongly (apparent Kd of ∼0.069 mM; Fig. 8 C). Liposomes derived from E. coli phospholipids were bound by FtsY with an affinity intermediate between the anionic and PE/PC liposomes, presumably because they contain both types of phospholipids (Fig. 8 D). The preference of FtsY to bind anionic phospholipids observed here was consistent with previous results using qualitative assays (de Leeuw et al., 2000). Nevertheless, these differences in binding affinity (approximately eightfold) were not sufficient to account for the ∼100-fold higher activity of FtsY in the presence of PG/PE liposomes compared with PE/PC liposomes. These results suggest that anionic phospholipids not only bind FtsY more strongly, but are also more effective at stimulating the activities of FtsY after binding. Thus, the stimulatory effects of anionic phospholipids on FtsY are multimodal and can regulate bacterial protein targeting along different points in the reaction pathway.
Discussion
In this work, we demonstrate that multiple activities of the bacterial SR FtsY are allosterically regulated by its interaction with phospholipids, and vice versa. These include: (1) stimulation of FtsY’s basal GTPase reaction; (2) acceleration of stable SRP–FtsY complex assembly; (3) preferential stabilization of the closed and activated SRP–FtsY complexes; and (4) strengthening of FtsY’s lipid-binding affinity when it forms a stable SRP–FtsY complex. The simplest energetic model to explain these allosteric effects is that lipid binding shifts the conformational equilibrium of FtsY from the open to the closed/activated states (Fig. 9 A). Pre-organization of FtsY toward these states would help bypass the substantial conformational rearrangement during stable complex assembly and thus accelerate the rate of this process (Fig. 9 A, ΔG‡, black vs. red). Pre-organization of FtsY also explains the acceleration of FtsY’s basal GTPase activity and the specific stabilization of the SRP–FtsY complex in the closed/activated states (Fig. 9 A, ΔG, black vs. red). Reciprocally, as phospholipids preferentially bind FtsY in the closed/activated conformation, FtsY will correspondingly bind phospholipids more strongly when it is driven into these conformational states upon GTP-dependent complex assembly with the SRP.
Figure 9.

Phospholipids drive conformational changes of FtsY to regulate protein targeting. (A) Free energy profile depicting the effect of phospholipids in shifting the conformational equilibrium of FtsY from the open to the closed/activated states by ∼100-fold (∼2.8 kcal/mol). A standard state of 1 µM FtsY was used to calculate the free energy differences and activation energy for GTP-dependent SRP–FtsY complex formation. (B) Model for how lipid binding of FtsY is coupled to the SRP–FtsY interaction and protein targeting. Step 1, dynamic association of free FtsY with the phospholipid membrane. Step 2, membrane-bound FtsY is more efficient at forming a stable closed/activated SRP–FtsY complex. Step 3, cytosolic FtsY forms an early complex with cargo-loaded SRP. Step 4, the cargo–SRP–FtsY complex shifts between the early and closed conformations with an equilibrium of ∼1. Step 5, the closed complex binds more strongly to the membrane than free FtsY. Step 6, the closed complex rearranges to the activated state, during which it completes the transfer of cargo to the translocon. Step 7, GTP hydrolysis drives complex disassembly, returning a fraction of FtsY molecules to the cytosol. (C) Movement of the αN1 helix (red) accompanies the open → closed rearrangement and membrane binding of FtsY.
The ability of FtsY to be allosterically regulated by interaction with phospholipids suggests a simple and effective mechanism to spatially regulate protein targeting. The population of free FtsY molecules that are localized to the membrane (Fig. 9 B, step 1) would be pre-organized into the closed/activated conformations and thus more efficient at forming a stable, GTP-dependent SRP–FtsY complex (Fig. 9 B, step 2). This is consistent with the result from a recent study that suggested that membrane-bound FtsY is more efficient at targeting cargo-bound SRP to the membrane (Mircheva et al., 2009), and provides a molecular basis to explain this observation. However, the population of free FtsY molecules in the cytosol exist primarily in the open conformation, in which it quickly forms an early targeting intermediate with cargo-bound SRP (Fig. 9 B, step 3), but the equilibrium for rearrangement of the cargo–SRP–FtsY complex to the closed and activated states is not favorable in the cytosol (Zhang et al., 2009). Nevertheless, the fraction of targeting complexes that is in these late conformational states has a much higher affinity for phospholipids, and thus would preferentially localize to the membrane (Fig. 9 B, step 5). In either pathway, the membrane-bound cargo–SRP–FtsY complex would be driven to the closed/activated states, in which the interaction between the SRP and the cargo is weakened (Halic et al., 2006; Shan et al., 2007; Zhang et al., 2009) so that the cargo would be primed for release and transfer to the translocon (Fig. 9 B, step 6). Consistent with this model are the observations that PG/PE liposomes could induce significant FtsY-mediated release of SRP from the nascent chain (Scotti et al., 1999), and that FtsY-NG, which is not allosterically regulated by phospholipids, was compromised at late stages of targeting (Bahari et al., 2007). Thus, the membrane targeting of the cargo can be efficiently coupled to its subsequent unloading and translocation through lipid-induced conformational changes in FtsY.
Although the activated state is significantly stabilized by phospholipids, phospholipids stimulate GTP hydrolysis from the SRP–FtsY complex by only twofold. This effect, though reproducible from different laboratories (Bahari et al., 2007; Marty et al., 2009), is rather modest. Moreover, phospholipids did not significantly enhance GTP hydrolysis from the RNC–SRP–FtsY complex (unpublished data). Thus, phospholipids alone would not be able to completely reverse the inhibitory effect of cargo on the GTPase reaction of the SRP–FtsY complex (Zhang et al., 2009). Possibly, complete activation of GTP hydrolysis would require additional interaction of FtsY with the SecYEG translocation machinery, or occurs only after the cargo has been unloaded from the SRP (Fig. 9 B, step 6 or 7).
The results here also suggest an attractive model in which the GTPase cycle of SRP and FtsY could regulate the membrane binding of FtsY. Free FtsY and the SRP–FtsY early intermediate have weak affinities for and fast dissociation rates from phospholipids (Fig. 9 B, step 1). In contrast, the affinity of FtsY for phospholipids increases >50-fold when it forms the GTP-dependent closed/activated complex with SRP, thus enabling more stable association of FtsY with the membrane (Fig. 9 B, step 5). After the cargo is unloaded, GTP hydrolysis drives the disassembly of the SRP–FtsY complex. This allows FtsY to go back to the open conformation in which its membrane binding becomes more dynamic (Fig. 9 B, step 7). Regulation of a protein’s membrane-binding activity by nucleotide binding/hydrolysis cycles has also been observed for the ATPase MinD (Hu et al., 2002; Mileykovskaya et al., 2003). Intriguingly, although the eukaryotic SR is localized to the ER membrane through the transmembrane domain of SRβ, complex formation between the SRα and -β subunits requires SRβ to be bound with GTP, which suggests that the GTPase cycle of SRβ could analogously regulate the association of SRα with the ER membrane (Schwartz and Blobel, 2003).
What is the molecular mechanism by which phospholipid binding regulates conformational changes in FtsY? Previous work and the results here provided various pieces of clues that together suggest a cohesive model. Formation of a stable SRP–FtsY complex requires the removal of αN1, the first α-helix in the N domains of Ffh and FtsY, which present steric blocks that would inhibit stable SRP–FtsY binding (Shepotinovskaya and Freymann, 2002; Gawronski-Salerno and Freymann, 2007; Neher et al., 2008). Here, we found that the lipid-binding helix is highly restricted in motion and most likely engages in strong tertiary interactions in apo-FtsY and in the early intermediate, but it becomes substantially more mobile and exposed in the closed/activated complexes. We propose that movement of the αN1 helix during the open → closed rearrangement of FtsY exposes the lipid-binding motif that immediately precedes the αN1 helix, thus leading to stronger lipid binding (Fig. 9 C). Conversely, lipid binding to this motif would help promote movement of the αN1 helix, thus facilitating the rearrangement of FtsY into the closed/activated states and its GTP-dependent complex assembly with SRP (Fig. 9 C). Consistent with this model are the observations that truncation of the αN1 helix led to the same phenotypes as those induced by lipid binding of FtsY: increase in FtsY’s basal GTPase activity, acceleration of stable complex assembly, and stabilization of the GTP-dependent SRP–FtsY complex (Neher et al., 2008). The N terminus of the FtsY N domain became more protease susceptible in the SRP–FtsY complex than in free FtsY (Neher et al., 2008), which also supports the model that the lipid-binding motif of FtsY is more accessible in the SRP–FtsY complex. This lipid-induced conformational change of FtsY is also supported by the cooperative behavior of phospholipids observed in both the SPR measurements and biochemical assays. This cooperativity is consistent with a model in which binding of the first lipid molecule shifts the conformational equilibrium of FtsY and helps expose its lipid-binding helix, thus facilitating the binding of additional lipid molecules.
FtsY exhibits a strong preference for anionic phospholipids such as PG and cardiolipin (de Leeuw et al., 2000; this paper). This is consistent with the abundance of basic residues on the amphiphilic lipid-binding helix of FtsY, and suggests a critical role of anionic phospholipids in cotranslational protein targeting. Anionic phospholipids have also been found to preferentially interact with and stimulate the ATPase MinD that regulates cell division (Mileykovskaya et al., 2003), the SecA ATPase that drives the posttranslational translocation of proteins (Lill et al., 1990; Hendrick and Wickner, 1991), and the integration of membrane proteins in Sec-independent pathways (Ridder et al., 2001). These biochemical observations are corroborated by in vivo experiments that showed that depletion of PG and cardiolipin in E. coli leads to severe defects in preprotein translocation, and that these defects can be rescued by restoring anionic phospholipids into membrane vesicles (de Vrije et al., 1988; Kusters et al., 1991). As PG and cardiolipin comprise a minor fraction of E. coli lipids, how do they stimulate protein function and targeting in vivo? Two speculative models could be envisioned. First, biophysical analyses showed that anionic phospholipids and PE are segregated in bacterial membrane with an extremely low extent of mixing, in contrast to model liposomes in which different phospholipids are well mixed (Fishov and Woldringh, 1999; Vanounou et al., 2003). It is possible that there are sites on E. coli membrane enriched in anionic phospholipids where FtsY could preferentially bind and be activated. Alternatively or in addition, the SecYEG machinery associates tightly with anionic phospholipids, cardiolipin and PG (Gold et al., 2010), which could provide sites for preferential FtsY binding and activation. Regardless of the molecular model, the results of this and previous work emphasize the crucial roles that anionic phospholipids play in the targeting and translocation of proteins across the bacterial inner membrane, and invite additional studies to delineate their precise distributions and mechanisms of action in vivo.
Materials and methods
Materials
Ffh, 4.5S RNA, FtsY, and FtsY-NG were expressed and purified as described previously (Montoya et al., 1997b; Peluso et al., 2001). The expression plasmid for full-length FtsY was a gift from W. Wintermeyer (Max Planck Institute, Leipzig, Germany). The expression plasmid for FtsY-NG+1 was based on pMal-c2X (New England Biolabs), in which the PCR fragment encoding FtsY-NG+1 was inserted between the BamHI and SalI restriction sites. The factor Xa cleavage site in pMal-c2X was replaced with a thrombin cleavage site using the QuikChange protocol (Agilent Technologies). The maltose-binding protein (MBP) fusion protein of FtsY-NG+1 was purified by affinity chromatography using Ni-NTA and digested with thrombin. Then, MBP and uncleaved MBP fusion proteins were removed using amylose resin (New England Biolabs), and FtsY-NG+1 was further purified by anion exchange chromatography over monoQ (GE Healthcare) using a linear gradient of 50–300 mM NaCl.
Phospholipids were from Avanti Polar Lipids, Inc. Large unilamellar vesicles were freshly prepared before each experiment by extruding lipid solutions 21 times through 100-nm pore polycarbonate filters (de Leeuw et al., 2000; Parlitz et al., 2007). In general, the liposomes thus prepared have diameters twofold larger than the indicated filter pore size. The lipid concentrations throughout the text denote that of total phospholipids, 50% of which will be present on the outer leaflet of vesicles for interaction with FtsY. In general, a total lipid concentration of 1 mM corresponds to ∼1.35 nM liposomes 200 nm in diameter, according to the surface area of a lipid molecule of 0.65–0.7 nm2.
GTPase assay
GTP hydrolysis reactions were performed in SRP buffer (50 mM KHepes, pH 7.5, 150 mM potassium acetate, 1.5 mM magnesium acetate, 0.01% Nikkol, and 2 mM DTT) using 100–200 µM GTP doped with γ-[32P]GTP. The extent of reaction at specified time points was analyzed by thin layer chromatography (PEI cellulose F) and quantified with a phosphorimager (Storm 840; GE Healthcare; Peluso et al., 2001). The detergent Nikkol was used to partially mimic the effect of signal peptides bound to SRP (Bradshaw et al., 2009; Zhang et al., 2009). The presence of the small amount of Nikkol increases the apparent lipid-binding constant by 30% for FtsY’s basal GTPase reaction, and did not significantly affect the lipid concentration dependence of the stimulated GTPase reaction (Fig. S5). As these are small effects and the same buffer was used for all the experiments, conclusions regarding the changes in FtsY’s lipid-binding affinity with changing conformational states and liposome compositions are unaffected. Before initiation of the reaction, the proteins were preincubated with liposomes for at least 10 min. Varying this incubation time did not affect the reaction rate constants, which suggests that equilibrium binding between FtsY and liposomes had been reached. Michaelis-Menten analysis of FtsY’s basal GTPase reaction was performed using 0.5 µM FtsY and 2–100 µM GTP. The GTP concentration dependence of the observed rate constants (kobsd) was fit to Eq. 1,
| (1) |
in which kcat is the rate constant at saturating GTP concentrations and Km is the GTP concentration required to reach half saturation.
The lipid concentration dependence of the basal GTPase reactions of FtsY was measured using 2–5 µM FtsY and 100 µM GTP doped with γ-[32P]GTP. To measure SRP–FtsY complex assembly rates, stimulated GTPase reactions were performed at subsaturating protein concentrations (100 nM SRP and 100–200 nM FtsY) in the presence of saturating GTP (100 µM) so that the second-order reaction GTP•SRP + FtsY•GTP → products was followed. To measure the effect of lipids on the GTPase rate of the GTP•SRP–FtsY•GTP complex, stimulated GTPase reactions were performed at saturating FtsY concentrations (10–25 µM). Varying the concentration of FtsY in this range did not affect the observed rate constant, confirming that FtsY is saturating and that the first-order reaction GTP•SRP–FtsY•GTP → products was followed. The lipid concentration dependences were fit to Eq. 2:
| (2) |
in which kobsd is the observed rate constant, k0 is the rate constant in the absence of lipids, k1 is the rate constant at saturating lipid concentrations, n is the Hill coefficient, and Kd is the apparent equilibrium dissociation constant for FtsY–lipid binding. Note that the values of Kd from this analysis are only apparent and did not represent the true binding constants, because FtsY–lipid interaction is cooperative; i.e., binding of the first lipid molecule strengthens the subsequent binding of additional lipid molecules to FtsY. The apparent Kd value from this analysis represents a mean of these different lipid-binding affinities. For example, if four lipid molecules bind to FtsY with Kd values of Kd,1, Kd,2, Kd,3, and Kd,4, then apparent .
Fluorescence measurements
Fluorescence measurements were performed as described previously (Zhang et al., 2008, 2009). When labeled SRP was used and the concentration of FtsY was varied, equilibrium titrations were fit to Eq. 3,
| (3) |
in which Fobsd is the observed FRET value or fluorescence change at a particular FtsY concentration, F1 is the FRET value or fluorescence change at saturating FtsY concentrations, and Kd is the equilibrium dissociation constant of the complex being measured. An analogous quadratic equation was used in cases where the fluorescence of labeled FtsY was monitored and the concentration of SRP was varied, except that the denominator in Eq. 3 becomes 2 × [FtsY].
Observed rate constants for assembly of the activated SRP–FtsY complex (kobsd) were measured at varying SRP concentrations using a stopped-flow apparatus (KinTek). The SRP concentration dependence of kobsd was fit to Eq. 4,
| (4) |
in which kon is the rate constant for complex assembly and koff is the rate constant for complex disassembly.
Cotranslational protein targeting and translocation
A previously established heterologous protein targeting assay (Powers and Walter, 1997; Shan et al., 2007) was used in this study. The model SRP substrate preprolactin (pPL) was translated by wheat germ ribosomes in the presence of [S35]methionine. Shortly after initiation of translation, the cap analogue 7-methyl-GTP was added to synchronize the ribosomes, followed by the addition of 200 nM of E. coli SRP, varying amounts of FtsY or FtsY-NG+1, and 4 equivalent (unit defined as described in Walter et al., 1981) of trypsin digested and salt-washed microsomal membrane (TKRM). Translocation of pPL across the microsomal membrane results in efficient cleavage of the signal sequence, allowing quantification of the targeting and translocation efficiency by SDS-PAGE and phosphorimaging.
Density gradient flotation
Lipid flotation assays were performed as described previously (Valent et al., 1998; Parlitz et al., 2007), with slight modifications. For free FtsY, 0.8 nmol of protein was incubated with 4 mg/ml of E. coli liposomes in SRP buffer at 37°C for 30 min. For the SRP–FtsY complex, 20 µM FtsY and Ffh was preincubated with 0.5 mM GppNHp for 2 h at 25°C, and then incubated at 37°C for 30 min in the presence of 10 mg/ml of liposomes. The protein–lipid mixture was overlaid with density gradients and ultracentrifuged as described previously (Valent et al., 1998; Parlitz et al., 2007). The gradient was collected in four fractions (600 µl, 400 µl, 400 µl, and 600 µl) from the top, TCA precipitated, dissolved in SDS-PAGE sample buffer, and then analyzed by 10% Tris-glycine gels. The images were acquired on a Universal Hood II (Bio Rad Laboratories) and analyzed with ImageJ software.
Site-directed spin labeling and EPR measurements
Spin labeling reactions were performed in 20 mM Hepes, pH 8.0, 300 mM NaCl, and 2 mM EDTA. Reduced and degassed single cysteine mutants of FtsY-NG+1 were labeled with a three- to fivefold molar excess of MTSSL (Toronto Research Chemicals) at room temperature in the dark for 2–3 h. Excess MTSSL was removed by gel filtration, and the efficiency of spin-labeling (80–100%) was determined by EPR using a TEMPO calibration curve according to the manufacturer’s instructions (Bruker). EPR spectra were acquired using a 9.4-GHz (X-band) EMX EPR spectrometer (Bruker) equipped with an ER 4119HS cavity at 20–23°C. The concentrations of spin-labeled samples were 30–100 µM for apo-FtsY and ∼30 µM for the early and closed/activated complexes. 40% glycerol was present in all samples to remove motions arising from the global tumbling of protein. 32–64 scans were accumulated and averaged using microwave power of 5 mW with modulation amplitude set at 1 gauss and a magnetic field sweep width of 100 gauss. The central linewidth is the same from 0.2–5 mW microwave power. Less than 2% background labeling was observed; background subtraction was therefore not necessary.
SPR
SPR experiments were performed on a Biacore T100 instrument provided by the Protein Expression Center (PEC) or by the Tirrell group at Caltech. Anti-His monoclonal antibody was immobilized onto the surface of CM5 chips at levels that ranged from 12,000 to 23,000 resonance units (RU). Changing the surface density of the antibody within this range had no effect on FtsY–lipid interaction. All the results here were obtained with a single IgG-derivatized biosensor chip in SRP buffer. Two IgG-derivatized flow cells were used: the sample cell contained immobilized FtsY or FtsY-NG (at a surface density of ∼250 RU), and the reference cell provided negative control whose changes in RU were subtracted from that of the sample cell. Liposomes at varying concentrations in SRP buffer were flowed in for 200–270 s at a rate of 30 µl/min. When equilibrium was reached, liposomes were allowed to dissociate for 60 s in SRP buffer. After each cycle of binding and dissociation, the surface was regenerated by 10 mM glycine buffer, pH 2.5, and FtsY constructs were reimmobilized. To determine Kd, the RU values 5 s before initiating dissociation of the liposomes were plotted against liposome concentration. The data were fit to Eq. 5,
| (5) |
in which RUobsd is the observed resonance units, RU0 is the resonance signal in the absence of lipids, RU1 is the resonance signal at saturating liposome concentrations, Kd is the apparent equilibrium dissociation constant for FtsY-lipid binding, and h is the Hill coefficient.
Online supplemental material
Fig. S1 shows that phospholipids specifically stimulate FtsY’s basal GTPase rate but do not affect its GTP binding affinity. Fig. S2 shows that GTPase activity of SRP was not affected by phospholipids. Fig. S3 shows the EPR spectra of all the nitroxide spin probes labeled at individual residues on FtsY’s lipid binding helix, and the data for the spin label at residue 229, which served as a negative control. Fig. S4 presents SPR data that show that lipids bind to FtsY threefold stronger than FtsY-NG+1. Fig. S5 shows that the presence of the detergent Nikkol affected lipid concentration dependences of FtsY’s activities by <30%. Table S1 lists the GTPase rate constants of all the spin-labeled FtsY constructs. Online supplemental material is available at http://www.jcb.org/cgi/content/full/jcb.201004129/DC1.
Acknowledgments
We thank Oded Lewinson in the Rees group for help and advice on liposome experiments, Jost Vielmetter at the Protein Expression Center (PEC) at Caltech and J. Van Deventer of the Tirrel group for help in SPR experiments, and Ray Deshaies and members of the Shan laboratory for comments on the manuscript.
This work was supported by National Institutes of Health (NIH) grant GM078024, and career awards from the Burroughs Welcome Foundation, the Henry and Camille Dreyfus foundation, the Arnold and Mabel Beckman foundation, and the David and Lucile Packard foundation to S. Shan. D. Akopian and M. Rome were supported by NIH/National Research Service Award training grant 5T32GM07616. The Biacore instrument at the PEC is funded by the Moore Foundation grant for “Center for Integrative Study of Cell Regulation” and in part by Caltech’s Beckman Institute Funds.
Footnotes
Abbreviations used in this paper:
- EPR
- electron paramagnetic resonance
- FRET
- fluorescence resonance energy transfer
- GppNHp
- 5′-guanylyl imido-diphosphate
- MBP
- maltose-binding protein
- MTSSL
- (1-oxyl-2,2,5,5,-tetramethyl-3-pyrroline-3-methyl) methanethiosulfonate
- PC
- phosphatidylcholine
- PE
- phosphatidylethanolamine
- PG
- phosphatidylglycerol
- pPL
- preprolactin
- RNC
- ribosome–nascent chain complex
- RU
- resonance units
- SPR
- surface plasmon resonance
- SR
- SRP receptor
- SRP
- signal recognition particle
References
- Angelini S., Deitermann S., Koch H.-G. 2005. FtsY, the bacterial signal-recognition particle receptor, interacts functionally and physically with the SecYEG translocon. EMBO Rep. 6:476–481 10.1038/sj.embor.7400385 [DOI] [PMC free article] [PubMed] [Google Scholar]
- Angelini S., Boy D., Schiltz E., Koch H.-G. 2006. Membrane binding of the bacterial signal recognition particle receptor involves two distinct binding sites. J. Cell Biol. 174:715–724 10.1083/jcb.200606093 [DOI] [PMC free article] [PubMed] [Google Scholar]
- Bahari L., Parlitz R., Eitan A., Stjepanovic G., Bochkareva E.S., Sinning I., Bibi E. 2007. Membrane targeting of ribosomes and their release require distinct and separable functions of FtsY. J. Biol. Chem. 282:32168–32175 10.1074/jbc.M705429200 [DOI] [PubMed] [Google Scholar]
- Bradshaw N., Neher S.B., Booth D.S., Walter P. 2009. Signal sequences activate the catalytic switch of SRP RNA. Science. 323:127–130 10.1126/science.1165971 [DOI] [PMC free article] [PubMed] [Google Scholar]
- Connolly T., Rapiejko P.J., Gilmore R. 1991. Requirement of GTP hydrolysis for dissociation of the signal recognition particle from its receptor. Science. 252:1171–1173 10.1126/science.252.5009.1171 [DOI] [PubMed] [Google Scholar]
- Cross B.C.S., Sinning I., Luirink J., High S. 2009. Delivering proteins for export from the cytosol. Nat. Rev. Mol. Cell Biol. 10:255–264 10.1038/nrm2657 [DOI] [PubMed] [Google Scholar]
- de Leeuw E., te Kaat K., Moser C., Menestrina G., Demel R., de Kruijff B., Oudega B., Luirink J., Sinning I. 2000. Anionic phospholipids are involved in membrane association of FtsY and stimulate its GTPase activity. EMBO J. 19:531–541 10.1093/emboj/19.4.531 [DOI] [PMC free article] [PubMed] [Google Scholar]
- de Vrije T., de Swart R.L., Dowhan W., Tommassen J., de Kruijff B. 1988. Phosphatidylglycerol is involved in protein translocation across Escherichia coli inner membranes. Nature. 334:173–175 10.1038/334173a0 [DOI] [PubMed] [Google Scholar]
- Egea P.F., Shan S.O., Napetschnig J., Savage D.F., Walter P., Stroud R.M. 2004. Substrate twinning activates the signal recognition particle and its receptor. Nature. 427:215–221 10.1038/nature02250 [DOI] [PubMed] [Google Scholar]
- Eitan A., Bibi E. 2004. The core Escherichia coli signal recognition particle receptor contains only the N and G domains of FtsY. J. Bacteriol. 186:2492–2494 10.1128/JB.186.8.2492-2494.2004 [DOI] [PMC free article] [PubMed] [Google Scholar]
- Fishov I., Woldringh C.L. 1999. Visualization of membrane domains in Escherichia coli. Mol. Microbiol. 32:1166–1172 10.1046/j.1365-2958.1999.01425.x [DOI] [PubMed] [Google Scholar]
- Focia P.J., Shepotinovskaya I.V., Seidler J.A., Freymann D.M. 2004. Heterodimeric GTPase core of the SRP targeting complex. Science. 303:373–377 10.1126/science.1090827 [DOI] [PMC free article] [PubMed] [Google Scholar]
- Freymann D.M., Walter P. 2000. GTPases in protein translocation and protein elongation. Frontiers in Molecular Biology: GTPases. Hall A., editor Oxford University Press, London: 222–243 [Google Scholar]
- Gawronski-Salerno J., Freymann D.M. 2007. Structure of the GMPPNP-stabilized NG domain complex of the SRP GTPases Ffh and FtsY. J. Struct. Biol. 158:122–128 10.1016/j.jsb.2006.10.025 [DOI] [PMC free article] [PubMed] [Google Scholar]
- Gold V.A.M., Robson A., Bao H., Romantsov T., Duong F., Collinson I. 2010. The action of cardiolipin on the bacterial translocon. Proc. Natl. Acad. Sci. USA. 107:10044–10049 10.1073/pnas.0914680107 [DOI] [PMC free article] [PubMed] [Google Scholar]
- Halic M., Gartmann M., Schlenker O., Mielke T., Pool M.R., Sinning I., Beckmann R. 2006. Signal recognition particle receptor exposes the ribosomal translocon binding site. Science. 312:745–747 10.1126/science.1124864 [DOI] [PubMed] [Google Scholar]
- Hendrick J.P., Wickner W. 1991. SecA protein needs both acidic phospholipids and SecY/E protein for functional high-affinity binding to the Escherichia coli plasma membrane. J. Biol. Chem. 266:24596–24600 [PubMed] [Google Scholar]
- Hu Z., Gogol E.P., Lutkenhaus J. 2002. Dynamic assembly of MinD on phospholipid vesicles regulated by ATP and MinE. Proc. Natl. Acad. Sci. USA. 99:6761–6766 10.1073/pnas.102059099 [DOI] [PMC free article] [PubMed] [Google Scholar]
- Hubbell W.L., Mchaourab H.S., Altenbach C., Lietzow M.A. 1996. Watching proteins move using site-directed spin labeling. Structure. 4:779–783 10.1016/S0969-2126(96)00085-8 [DOI] [PubMed] [Google Scholar]
- Hubbell W.L., Altenbach C., Hubbell C.M., Khorana H.G. 2003. Rhodopsin structure, dynamics, and activation: a perspective from crystallography, site-directed spin labeling, sulfhydryl reactivity, and disulfide cross-linking. Adv. Protein Chem. 63:243–290 10.1016/S0065-3233(03)63010-X [DOI] [PubMed] [Google Scholar]
- Hustedt E.J., Beth A.H. 1999. Nitroxide spin-spin interactions: applications to protein structure and dynamics. Annu. Rev. Biophys. Biomol. Struct. 28:129–153 10.1146/annurev.biophys.28.1.129 [DOI] [PubMed] [Google Scholar]
- Kusters R., Dowhan W., de Kruijff B. 1991. Negatively charged phospholipids restore prePhoE translocation across phosphatidylglycerol-depleted Escherichia coli inner membranes. J. Biol. Chem. 266:8659–8662 [PubMed] [Google Scholar]
- Lill R., Dowhan W., Wickner W. 1990. The ATPase activity of SecA is regulated by acidic phospholipids, SecY, and the leader and mature domains of precursor proteins. Cell. 60:271–280 10.1016/0092-8674(90)90742-W [DOI] [PubMed] [Google Scholar]
- Luirink J., ten Hagen-Jongman C.M., van der Weijden C.C., Oudega B., High S., Dobberstein B., Kusters R. 1994. An alternative protein targeting pathway in Escherichia coli: studies on the role of FtsY. EMBO J. 13:2289–2296 [DOI] [PMC free article] [PubMed] [Google Scholar]
- Marty N.J., Rajalingam D., Kight A.D., Lewis N.E., Fologea D., Kumar T.K., Henry R.L., Goforth R.L. 2009. The membrane-binding motif of the chloroplast signal recognition particle receptor (cpFtsY) regulates GTPase activity. J. Biol. Chem. 284:14891–14903 10.1074/jbc.M900775200 [DOI] [PMC free article] [PubMed] [Google Scholar]
- Mileykovskaya E., Fishov I., Fu X., Corbin B.D., Margolin W., Dowhan W. 2003. Effects of phospholipid composition on MinD-membrane interactions in vitro and in vivo. J. Biol. Chem. 278:22193–22198 10.1074/jbc.M302603200 [DOI] [PubMed] [Google Scholar]
- Mircheva M., Boy D., Weiche B., Hucke F., Graumann P., Koch H.G. 2009. Predominant membrane localization is an essential feature of the bacterial signal recognition particle receptor. BMC Biol. 7:76 10.1186/1741-7007-7-76 [DOI] [PMC free article] [PubMed] [Google Scholar]
- Montoya G., Svensson C., Luirink J., Sinning I. 1997a. Crystal structure of the NG domain from the signal-recognition particle receptor FtsY. Nature. 385:365–368 10.1038/385365a0 [DOI] [PubMed] [Google Scholar]
- Montoya G., Svensson C., Luirink J., Sinning I. 1997b. Expression, crystallization and preliminary X-ray diffraction study of FtsY, the docking protein of the signal recognition particle of E. coli. Proteins. 28:285–288 [DOI] [PubMed] [Google Scholar]
- Neher S.B., Bradshaw N., Floor S.N., Gross J.D., Walter P. 2008. SRP RNA controls a conformational switch regulating the SRP-SRP receptor interaction. Nat. Struct. Mol. Biol. 15:916–923 10.1038/nsmb.1467 [DOI] [PMC free article] [PubMed] [Google Scholar]
- Parlitz R., Eitan A., Stjepanovic G., Bahari L., Bange G., Bibi E., Sinning I. 2007. Escherichia coli signal recognition particle receptor FtsY contains an essential and autonomous membrane-binding amphipathic helix. J. Biol. Chem. 282:32176–32184 10.1074/jbc.M705430200 [DOI] [PubMed] [Google Scholar]
- Peluso P., Shan S.O., Nock S., Herschlag D., Walter P. 2001. Role of SRP RNA in the GTPase cycles of Ffh and FtsY. Biochemistry. 40:15224–15233 10.1021/bi011639y [DOI] [PubMed] [Google Scholar]
- Pool M.R., Stumm J., Fulga T.A., Sinning I., Dobberstein B. 2002. Distinct modes of signal recognition particle interaction with the ribosome. Science. 297:1345–1348 10.1126/science.1072366 [DOI] [PubMed] [Google Scholar]
- Powers T., Walter P.W. 1997. Co-translational protein targeting catalyzed by the Escherichia coli signal recognition particle and its receptor. EMBO J. 16:4880–4886 10.1093/emboj/16.16.4880 [DOI] [PMC free article] [PubMed] [Google Scholar]
- Rapoport T.A. 2007. Protein translocation across the eukaryotic endoplasmic reticulum and bacterial plasma membranes. Nature. 450:663–669 10.1038/nature06384 [DOI] [PubMed] [Google Scholar]
- Ridder A.N.J.A., Kuhn A., Killian J.A., de Kruijff B. 2001. Anionic lipids stimulate Sec-independent insertion of a membrane protein lacking charged amino acid side chains. EMBO Rep. 2:403–408 [DOI] [PMC free article] [PubMed] [Google Scholar]
- Rubio A., Jiang X., Pogliano K. 2005. Localization of translocation complex components in Bacillus subtilis: enrichment of the signal recognition particle receptor at early sporulation septa. J. Bacteriol. 187:5000–5002 10.1128/JB.187.14.5000-5002.2005 [DOI] [PMC free article] [PubMed] [Google Scholar]
- Schwartz T., Blobel G. 2003. Structural basis for the function of the beta subunit of the eukaryotic signal recognition particle receptor. Cell. 112:793–803 10.1016/S0092-8674(03)00161-2 [DOI] [PubMed] [Google Scholar]
- Scotti P.A., Valent Q.A., Manting E.H., Urbanus M.L., Driessen A.J., Oudega B., Luirink J. 1999. SecA is not required for signal recognition particle-mediated targeting and initial membrane insertion of a nascent inner membrane protein. J. Biol. Chem. 274:29883–29888 10.1074/jbc.274.42.29883 [DOI] [PubMed] [Google Scholar]
- Shan S.O., Stroud R.M., Walter P. 2004. Mechanism of association and reciprocal activation of two GTPases. PLoS Biol. 2:e320 10.1371/journal.pbio.0020320 [DOI] [PMC free article] [PubMed] [Google Scholar]
- Shan S.O., Chandrasekar S., Walter P. 2007. Conformational changes in the GTPase modules of the signal reception particle and its receptor drive initiation of protein translocation. J. Cell Biol. 178:611–620 10.1083/jcb.200702018 [DOI] [PMC free article] [PubMed] [Google Scholar]
- Shan S.O., Schmid S.L., Zhang X. 2009. Signal recognition particle (SRP) and SRP receptor: a new paradigm for multistate regulatory GTPases. Biochemistry. 48:6696–6704 10.1021/bi9006989 [DOI] [PMC free article] [PubMed] [Google Scholar]
- Shepotinovskaya I.V., Freymann D.M. 2002. Conformational change of the N-domain on formation of the complex between the GTPase domains of Thermus aquaticus Ffh and FtsY. Biochim. Biophys. Acta. 1597:107–114 [DOI] [PMC free article] [PubMed] [Google Scholar]
- Simon S.M., Blobel G. 1991. A protein-conducting channel in the endoplasmic reticulum. Cell. 65:371–380 10.1016/0092-8674(91)90455-8 [DOI] [PubMed] [Google Scholar]
- Valent Q.A., Scotti P.A., High S., de Gier J.W.L., von Heijne G., Lentzen G., Wintermeyer W., Oudega B., Luirink J. 1998. The Escherichia coli SRP and SecB targeting pathways converge at the translocon. EMBO J. 17:2504–2512 10.1093/emboj/17.9.2504 [DOI] [PMC free article] [PubMed] [Google Scholar]
- Vanounou S., Parola A.H., Fishov I. 2003. Phosphatidylethanolamine and phosphatidylglycerol are segregated into different domains in bacterial membrane. A study with pyrene-labelled phospholipids. Mol. Microbiol. 49:1067–1079 10.1046/j.1365-2958.2003.03614.x [DOI] [PubMed] [Google Scholar]
- Walter P., Johnson A.E. 1994. Signal sequence recognition and protein targeting to the endoplasmic reticulum membrane. Annu. Rev. Cell Biol. 10:87–119 10.1146/annurev.cb.10.110194.000511 [DOI] [PubMed] [Google Scholar]
- Walter P., Ibrahimi I., Blobel G. 1981. Translocation of proteins across the endoplasmic reticulum. I. Signal recognition protein (SRP) binds to in-vitro-assembled polysomes synthesizing secretory protein. J. Cell Biol. 91:545–550 10.1083/jcb.91.2.545 [DOI] [PMC free article] [PubMed] [Google Scholar]
- Weiche B., Bürk J., Angelini S., Schiltz E., Thumfart J.O., Koch H.-G. 2008. A cleavable N-terminal membrane anchor is involved in membrane binding of the Escherichia coli SRP receptor. J. Mol. Biol. 377:761–773 10.1016/j.jmb.2008.01.040 [DOI] [PubMed] [Google Scholar]
- Zhang X., Kung S., Shan S.O. 2008. Demonstration of a multistep mechanism for assembly of the SRP x SRP receptor complex: implications for the catalytic role of SRP RNA. J. Mol. Biol. 381:581–593 10.1016/j.jmb.2008.05.049 [DOI] [PMC free article] [PubMed] [Google Scholar]
- Zhang X., Schaffitzel C., Ban N., Shan S.O. 2009. Multiple conformational switches in a GTPase complex control co-translational protein targeting. Proc. Natl. Acad. Sci. USA. 106:1754–1759 10.1073/pnas.0808573106 [DOI] [PMC free article] [PubMed] [Google Scholar]