

Abstract
Fiber tracts should use space and energy efficiently, because both resources constrain neural computation. We found for a myelinated tract (optic nerve) that astrocytes use nearly 30% of the space and >70% of the mitochondria, establishing the significance of astrocytes for the brain's space and energy budgets. Axons are mostly thin with a skewed distribution peaking at 0.7 μm, near the lower limit set by channel noise. This distribution is matched closely by the distribution of mean firing rates measured under naturalistic conditions, suggesting that firing rate increases proportionally with axon diameter. In axons thicker than 0.7 μm, mitochondria occupy a constant fraction of axonal volume—thus, mitochondrial volumes rise as the diameter squared. These results imply a law of diminishing returns: twice the information rate requires more than twice the space and energy capacity. We conclude that the optic nerve conserves space and energy by sending most information at low rates over fine axons with small terminal arbors and sending some information at higher rates over thicker axons with larger terminal arbors but only where more bits per second are needed for a specific purpose. Thicker axons seem to be needed, not for their greater conduction velocity (nor other intrinsic electrophysiological purpose), but instead to support larger terminal arbors and more active zones that transfer information synaptically at higher rates.
Introduction
Axons in the mammalian CNS exhibit a broad range of diameters. The thinnest axons, which arise from the smallest neurons, are ∼0.2 μm, approaching the limit set by channel noise (Faisal et al., 2005). The thickest axons, which arise from the largest neurons, reach ∼20 μm. In many tracts, the distribution of axon diameters is highly skewed, such that thin axons are numerous, and thick ones are rare (Biedenbach et al., 1986; Wang et al., 2008). This distribution, a basic feature of brain structure, has never been explained.
The standard explanation for thick axons is that their higher conduction velocities are needed to reduce conduction times (Hursh, 1939; Rushton, 1951; Waxman and Bennett, 1972; Koch, 1999). For example, Ia fibers conduct impulses from muscle spindles up to 120 m/s (Hunt, 1954; Eccles et al., 1962). This speed is essential, because Ia axons form the afferent limb of a feedback loop with a long conduction distance. Slow conduction would cause long conduction times, so error messages would always be outdated. Yet, were it generally true that conduction time sets axon diameter, thick fibers might predominate in long tracts and thin fibers in short ones, but this is not so (Friede et al., 1984). Furthermore, even if the increased conduction velocity could explain why certain axons need to be thick, it does not explain why they are mostly thin.
One obvious need is to conserve space: fiber volume increases as the radius squared, so the volume occupied by the thickest axon could accommodate 10,000 of the thinnest ones. Therefore, a brain with mostly thin axons can make more connections (Wen and Chklovskii, 2005). Another need might be to save energy: action potentials may consume up to 35% of the cortical energy budget (Attwell and Laughlin, 2001; Laughlin and Sejnowski, 2003; Lennie, 2003). Thus, if spiking by a thick axon uses more energy, a brain with mostly thin axons could afford more spikes. These considerations led us to quantify how space, energy capacity, and firing rate are related in a particular central tract, the optic nerve. We studied guinea pig because in this species, the spike rates to naturalistic stimuli were known for the smallest and largest ganglion cell types (Koch et al., 2006); thus, we hoped with further recordings to relate fiber size to information rate.
First, we asked how is space apportioned in the optic nerve between axons versus glia and between axons of different caliber? Second, how are mitochondria apportioned: across cell types (axons vs glia), across subcellular compartments (e.g., nodes of Ranvier), across axons of different caliber, and across myelinated and unmyelinated regions of the same axons? Finally, we asked how does the distribution of ganglion cell firing rates (and thus information rates) correspond to the distributions of fiber size and oxidative capacity? We found that optic axons, like fly photoreceptors (Niven et al., 2007), follow a law of diminishing returns: twice the information rate requires more than twice the space and energy capacity.
Materials and Methods
Electron microscopy.
Retinas and optic nerves were prepared from three adult male guinea pigs (400–500 g). An animal was anesthetized with ketamine (100 mg/kg), xylazine (20 mg/kg), and pentobarbital (50 mg/kg) and then perfused with 2% paraformaldehyde plus 2% glutaraldehyde in 0.1 m phosphate buffer. Tissue was stored overnight at 4°C and then dissected, osmicated, soaked in uranyl acetate, and prepared for electron microscopy (EM) as described previously (Tsukamoto et al., 1992). The method of fixation followed here results in no measurable tissue shrinkage (Tsukamoto et al., 1992). Electron micrographs were taken at 5000 times magnification and digitized.
Data analysis.
Axonal profiles were identified by custom software written in MATLAB. Mitochondrial identification and the correction of misidentified axons (∼5% of the profiles) were done manually using Adobe PhotoShop 8. Because axon profiles are not precisely circular, we measured the area of each profile and then calculated the diameter of the equivalent circle.
If this method were applied to an axon sectioned obliquely, the elliptical profile would produce a spuriously large diameter. However, this effect would be small. Considering a perfectly cylindrical axon, a section deviating by 20° from perpendicular would overestimate the diameter by only 2.8%. For the most common axon (0.7 μm), the error would amount to 0.02 μm, and for the thickest axon (3.5 μm), the error would amount to <0.1 μm. Also, because the axons run parallel, obliquely sectioned axons would produce elliptical profiles with the same orientation. Yet, the distribution of orientations among 1400 axons was flat. This indicates that the axons were cut perpendicular to their long axes.
To calculate average mitochondrial volumes, we pooled axons into bins that were separated by at least 0.1 μm and adjusted to contain at least 20 axons. Since the largest axons were sparse, this “adaptive binning” led to larger bins for the widest diameters (see Fig. 4). Because the mitochondrial concentration was approximately constant for large axon diameters, we knew that mitochondrial volume would be well described by a quadratic function of diameter. Thus, we fit the mitochondrial volume to a general quadratic function of diameter parameterized as follows: Vm = A (d − s) [(d − s) + B], where the shift s is meant to reflect the absence of very small axons, perhaps because of their unreliable spike timing (Faisal and Laughlin, 2007).
Figure 4.

Energy capacity versus axon caliber. A, Mitochondria in myelinated axons thicker than ∼0.7 μm occupy ∼1.5% of the cytoplasm—independently of axon diameter. Profiles thinner than 0.7 μm had lower mitochondrial concentrations. Mitochondria in unmyelinated segments (within the retina) that are thicker than ∼0.6 μm occupy ∼4% of cytoplasm. Horizontal error bars indicate SD for axon diameter (adaptive binning; see Materials and Methods); vertical bars indicate SEM. B, Mitochondrial volume per unit axonal length rises linearly with axon diameter for small profiles (d <0.7 μm) and quadratically for larger axons. Solid curves indicate quadratic polynomial fits.
Measurements of ganglion cell firing rates.
In vitro guinea pig retinas were prepared for extracellular recordings as described previously (Koch et al., 2004). A variety of naturalistic movies (optic flow, saccades, etc.) were used for visual stimulation (Koch et al., 2006). Movies were displayed on a 1 inch CRT monitor with a P43 phosphor (545 nm, 640 × 480 pixels, 60 Hz frame rate), projected through the top port of the microscope, and focused onto the retina at a magnification of 7.6. Ganglion cells were recorded using a multielectrode array (Segev et al., 2004) or a loose-patch electrode (Koch et al., 2004), and cell types were identified by spike responses and morphology.
For all types of guinea pig retinal ganglion cells, and all naturalistic stimuli, mean firing rates (Hz) have been related to information rates (bits/s) by the following formula: I = − 0.26 [(r δ) log2(r δ) + (1 − r δ) log2(1 − r δ)]/δ, where δ = 5 ms is a time bin used to relate firing rates to firing probabilities, and 0.26 represents the net loss of information to noise and correlations in the single-cell response (Koch et al., 2006). We used this formula to convert measured mean firing rates into estimated information rates.
Fits to diameter and rate distributions.
The axon diameter and firing rate distributions were fit to lognormal functions, y = (A/2 π σ x) exp(− ln(x/xc)2/2 σ2), by minimizing the square deviation of the data from the function (see Figs. 1E, 5B, 6B). Here, A reflects the area under the data histogram, xc is the mean value of the natural logarithm of the independent variable x (axon diameter or firing rate), and σ is the SD of ln(x). To carry out the fits, axon diameters were binned at 0.1 μm, whereas firing rates were binned at 1 Hz.
Figure 1.
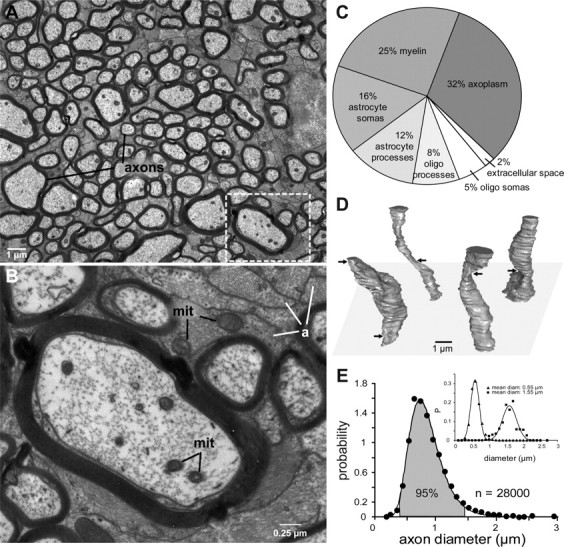
Retinal ganglion cell axons are mostly thin. A, Myelinated axons in the optic nerve vary in diameter by ∼10-fold and are separated from each other by astrocyte processes (electron micrograph). Boxed region is enlarged in B. B, Higher magnification shows mitochondria (mit) in axons and astrocyte processes (a). C, Allocation of space in the optic nerve: 28% to astrocytes. D, Optic axons reconstructed from inner diameters. Over this length scale (12 μm), each axon varies markedly in caliber (max/min = 2.0 ± 0.6; n = 1200). Arrows mark constrictions. None of these constrictions were nodes of Ranvier. E, Distribution of diameters is skewed with thin axons predominating. Shaded area includes 95% of the total and corresponds to the range (0.5–1.5 μm) where probability values were >10% of the peak. Solid line is a lognormal fit. Inset, Distribution of diameters along the reconstructed segments (D) for a subset of axons with mean diameter 0.55 μm (n = 1100) and 1.55 μm (n = 500). Solid lines are Gaussian fits.
Figure 5.

Unmyelinated axons and retinal glia. A, Ganglion cell axons within the retina are unmyelinated and run in dense bundles toward the optic disk. The bundles are wrapped by processes of Muller glia. gc, Ganglion cell. B, Higher magnification of boxed region in A. Retinal axons contain mitochondria (mit), but the Muller processes do not. Instead, they are dark from accumulated glycogen. C, Distribution of diameters for unmyelinated segments is skewed like the distribution for myelinated segments (Fig. 1E). Shaded area (95%) corresponds to the range (0.3–1.1 μm) where probability values were >10% of the peak. Solid line, lognormal fit. D, Subcellular distribution of mitochondria seen as red fluorescence after staining with TMRE. Mitochondria are numerous in ganglion cell somas (gc) distinguished by their eccentrically located nuclei (n) (Kao and Sterling, 2006) and in ganglion cell dendrites and axon bundles (ab). Muller cell processes are dark, as expected from electron microscopy (A). dpa, Displaced amacrine cell.
Figure 6.

Retinal ganglion cells mostly fire at low rates. A, Multiple ganglion cells responding to naturalistic movies were recorded simultaneously on a multielectrode array (shown here are 2 examples). The smallest cells (local-edge) had the lowest mean and peak rates, whereas largest cells (brisk-transient) had the highest rates (Koch et al., 2006). B, Distribution of firing rates shows mostly low rates and skew toward high rates. Solid line indicates lognormal fit. C, Distribution of firing rates compared with distribution of axon diameters from Figure 1 by assuming a linear relation between rate and diameter. The match seems close, especially considering that the sample sizes differ by two orders of magnitude.
We had reason to expect that the highest firing rates came from cells with the largest axons and that the lowest rates were associated to the thinnest axons. To test a possible linear relationship between rate and diameter (r = K (d − s)), we applied this linear transformation to the independent variable (x) in lognormal curve that described the diameter distribution and searched for the values of K and s that minimized the squared error of this transformed curve from the rate distribution data. We similarly tested a possible quadratic relation, r = K2 (d − s)2 + K1 (d − s), between rate and diameter, as well as a possible linear relation between the logarithms of the rate and the diameter (log(R) = log(C) + E log(d), or, equivalently, r = C dE). We tried the latter relation because any two lognormal curves can be transformed into each other by shifting the mean and rescaling the SD of the logarithm of the independent variable (x)—i.e., by a linear transformation on log(x). We used this observation to directly derive the constants C and E that cause the rate and diameter lognormal fits to coincide.
Confocal microscopy.
To investigate mitochondrial distribution at the light microscopic level, we used the mitochondria-specific fluorescent dye tetramethylrhodamine ethyl ester (TMRE). The dye specifically stains live mitochondria by accumulating in the mitochondrion in proportion to membrane potential (Scaduto and Grotyohann, 1999). In vitro guinea pig retinal preparation was loaded with 50 nm TMRE dissolved in Ames' bathing solution for 15 min. Images were acquired with an Olympus BX61WI confocal laser-scanning microscope (Olympus America) under a 60× water-immersion objective (NA 0.9) and Rhodamine RedX setting.
Calculation of Na+ accumulation based on a multicompartment model.
Computer simulations of impulse propagation and Na+ accumulation were based on compartmental models of myelinated and unmyelinated axons using a version of a multichannel model (Fohlmeister and Miller, 1997a,b) modified to work at 37°C (Fohlmeister, 2009;) (J. F. Fohlmeister, personal communication) (see supplemental material, available at www.jneurosci.org). A key improvement for this study was that the Na current was evaluated as a permeability change—with each iteration of the simulation (0.025–0.00025 ms), [Na]i and INa was re-evaluated based on Na entering the compartment. The rate of Na diffusion to the flanking internodal compartments was set by a single time constant. Each iteration of the Na change used the new Na value as the driving force for the Na current. Supplemental Table 1, available at www.jneurosci.org as supplemental material, summarizes the model parameters after tuning INa and IK to obtain ∼100 mV response amplitudes and realistic shapes of action potentials without signs of aberrant impulse peak broadening. Action potential shapes and conduction velocities were robust to changes in parameters—e.g., a 25% change in the sodium conductance only changes the peak heights and the velocities by a few percent. The model was formulated in the NEURON simulation environment (Hines and Carnevale, 1997). We specifically focused on the range of spike rates observed in previous studies (Koch et al., 2006) to determine whether their fidelity required the observed range of axon diameters.
Calculation of Na+ accumulation based on membrane capacitance.
We also estimated Na+ influx for an action potential by the amount of charge required for a voltage change, ΔV = 100 mV, assuming a membrane capacitance, Cm = 1 μF/cm2, for a unit length axon segment (Attwell and Laughlin, 2001). We increased our estimates by fourfold to take account of simultaneous activation of Na+ and K+ channels (Hodgkin, 1975). In unmyelinated axons, capacitance, therefore, Na+ influx estimates were proportional to surface area.
In myelinated axons, we set the nodal length constant (2 μm) and defined internodal distance and myelin thickness in proportion to axon diameter (Rushton, 1951). Since capacitance is inversely proportional to the number of membrane layers, myelin capacitance was Cmyelin = Cm/nlayers. To calculate the number of membrane layers, we assumed a membrane diameter of 5 nm (as we confirmed by EM) and used the known relationship between myelin thickness and axon diameter (Williams and Chalupa, 1983; Guy et al., 1989), thus, nlayers = dmyelin/dmembrane. Larger diameter resulted in fewer nodes of Ranvier and thicker myelin sheaths, keeping the total membrane capacitance unchanged. These estimates of Na+ influx were consistent with the results of the multicompartment model.
Results
How the optic nerve allocates space
We quantified how space is apportioned in a cross-section through the nerve by identifying and measuring all the processes in a montage of electron micrographs covering ∼3300 μm2 (Fig. 1A–C). Axoplasm (1480 axons) occupied 32% of the total area. Every axon was myelinated, the number of wraps forming a constant proportion of axon diameter (Williams and Chalupa, 1983; Friede and Beuche, 1985; Guy et al., 1989). Myelin accounted for 25% of the nerve's cross-section, so the axons plus their sheaths occupied 57%.
The axons were separated by astrocyte processes (pale, with bundles of 10 nm filaments) and by oligodendrocyte processes (dark, with microtubules but not filaments). Astrocyte processes occupied 12% of the area, and their somas occupied 16%; oligodendrocyte processes occupied 8% of the area, and their somas occupied 5%. Extracellular space was 2%. Our sample did not include microglia (Peters et al., 1991). Of course, astrocytes are a common constituent of central tracts, but it surprised us to learn that in the optic nerve, they occupy such a large fraction (nearly 30%) of the total cross-section (Fig. 1C).
We then measured the axon inner diameters. The nerve cross-section was systematically sampled along a transect through its center. Included were 23 patches, each with ∼1200 fibers, for a total of ∼28,000 fibers. We found no evidence for topographic variation in the distribution of diameters, confirming Guy et al. (1989). In further agreement, we calculated that the whole nerve contained ∼100,000 fibers.
The narrowest profiles were ∼0.2 μm diameter, and the widest were ∼3.5 μm. This suggested that axon caliber varies by 17.5-fold and that volume (proportional to r2) varies by ∼300-fold. We checked this by reconstructing a patch of ∼1200 axons from electron micrographs of serial sections and found that over a distance of 12 μm, individual axons vary considerably in caliber—by a factor of ∼2 (Fig. 1E, inset). Thus, the finest profiles in a cross-section actually represent constrictions in axons of larger mean diameter (Fig. 1D).
The distribution of axon diameters rose steeply, peaking at ∼0.7 μm. The distribution was strongly skewed (Fig. 1E). Correcting for the significant variation in caliber of individual axons (Fig. 1E, inset) slightly narrowed the axon diameter distribution at both ends but hardly changed its overall shape. The distribution was well described by a lognormal function (see Materials and Methods), i.e., the natural logarithm of the diameter was distributed as a Gaussian, and χ2 error (assuming SE for bins with N counts) was minimized when the Gaussian had a mean of log[0.86] and an SD of 0.30. The parameters were well constrained—a 10% change more than doubled the χ2 error. The diameter range containing 95% percent of the axons was 0.5–1.5 μm; thus, the ratio of the volumes varied by ∼10-fold.
How the optic nerve allocates energy capacity
Astrocytes are supposed to split glucose anaerobically to lactate and shuttle it to neuronal mitochondria for oxidation (Pellerin and Magistretti, 1994; Poitry-Yamate et al., 1995). Nevertheless, astrocytes in the optic nerve contain abundant mitochondria (Fig. 1B). In fact, mitochondrial volume in astrocytes was 3.2% of cytoplasmic volume, exceeding by nearly twofold their volume fraction in axoplasm (see below). Astrocytes contained ∼72% of the optic nerve's mitochondria. These mitochondria displayed a dense matrix and relatively little inner membrane structure, which apparently reflects a lower oxidation rate (Hackenbrock, 1968a,b).
Axonal mitochondria were cigar shaped and oriented approximately parallel with the axon's long axis (Fig. 2A). Measured from serial, longitudinal sections, they were 2.9 ± 2.3 μm long (n = 24); measured from cross-sections, they were 0.22 ± 0.05 μm wide (n = 7100). Mitochondrial size was approximately constant across axon diameters. Based on mitochondrial size and total volume, we estimated that the mean separation between mitochondria along an axon (between their midpoints) was 3.2 μm. Given their mean lengths (nearly 3 μm), the mitochondria distributed fairly evenly along the axons, and no point in the axon could be even as much as 1 μm from an intracellular fountain of ATP (Fig. 2A).
Figure 2.

Energy capacity distributes evenly along the axon. A, Mitochondria distribute evenly along the axon [except at constrictions (B) and nodes of Ranvier (Fig. 3A)]. Mean distance from ATP source to axonal membrane (site of Na/K-ATPase) is <1 μm. B, Mitochondria avoid the narrowest constrictions (<0.3 μm) but maintain a constant concentration in axons whose narrowest regions ≥0.6 μm. Dashed line indicates mean mitochondrial concentration across all axons. C, EM section through a mitochondrion. Inner membrane forms numerous tubules that expand its surface area. Inner membrane cut perpendicularly forms a sharp image in this section (∼90 nm thick), and these regions were traced to obtain a measure of inner membrane area. D, Mitochondrial volume correlates strongly with inner membrane area [which sets the number of respiratory units and thus energy capacity (Weibel, 2000)].
The narrowest axonal profiles, now recognized as constrictions, never contained a mitochondrion. Furthermore, as a fine axon re-expanded from its narrowest point, the probability of finding a mitochondrion increased smoothly, reaching the mean value for all axons within ∼2.5 μm. Profiles narrower than 0.6 μm at the constriction showed this behavior, but wider profiles showed a constant probability (Fig. 2B).
The slenderest mitochondria were slightly thicker than the constrictions and were absent from them. Immediately beyond a constriction, mitochondrial concentration (mitochondrial volume per unit axoplasmic volume) rose sharply, so the center of a constriction would be not much more than 1 μm from a mitochondrion (Fig. 2B). In thicker axons, where the narrowest regions could accommodate a mitochondrion with room to spare, their concentration was essentially constant (Fig. 2B). This suggests that the constrictions exist in vivo and that mitochondria simply wriggle through them on their anterograde and retrograde journeys.
To test whether mitochondrial volume, our primary measurement, reasonably estimates the distribution of oxidative capacity, we plotted volume versus area of the inner mitochondrial membrane—which bears the terminal elements of the respiratory cascade at fixed density (Weibel, 2000). Longitudinal slices through axonal mitochondria showed the inner membrane evaginating to form a convoluted mass of tubules that expand its surface area (Fig. 2C). Where the inner membrane was seen on edge, forming a sharp image, it was traced to obtain the total length. Depth was estimated as the section thickness (∼90 nm). Because the tubules showed no particular orientation, their partial areas are unbiased reflections of the total tubular surface area. Thus, each slice provided a measure of inner membrane area, and this correlated strongly with the volume of the slice (Fig. 2D). Consequently, mitochondrial volume predicts oxidative capacity. Thus, in the remainder of this study, we take mitochondrial volume as a measure of energy capacity, i.e., the power or energy per unit time.
Mitochondria avoid nodes of Ranvier
Given that nodes of Ranvier, plus their flanking paranodes, are major sites of cation flux during an action potential (Scherer, 1999), we had expected to find an increased concentration of mitochondria. However, analyzing 51 nodes of Ranvier, we found that mitochondria, far from concentrating at nodes, actually avoided them (Fig. 3A,C). The distance from the center of a node to the nearest mitochondrion was ∼3 μm, and by ∼4 μm, mitochondria reached their mean axoplasmic concentration. Thus, the nodal region represents a zone of ∼6 μm that is depleted in mitochondria. This has been reported also for axons in mice (Edgar et al., 2008).
Figure 3.

Mitochondria avoid nodes of Ranvier. A, Longitudinal section through a node of Ranvier. B, Mitochondria are present in astrocytes, but they do not cluster at the node (nr). This point is quantified in D. C, Mitochondria are rare in nodal axoplasm but reach the mean level (−) within ∼4 μm. D, A “node-centered average” of astrocytic mitochondria was obtained by aligning the three-dimensional mitochondrial distribution, around 51 nodes, and collapsing them to one dimension. Thus, astrocytic mitochondria avoid the nodes of Ranvier. E, Sodium diffuses longitudinally from its entry point at the node, falling by 90% within a millisecond (inset).
Noticing that astrocytes are rich in mitochondria, we wondered if astrocyte mitochondria might concentrate near nodes of Ranvier and by some unsuspected mechanism supply the node with ATP. To investigate this, we plotted the locations of all astrocytic mitochondria within 10 μm of one node (Fig. 3B). Mitochondria did not cluster near the node. Analyzing 51 nodes confirmed that mitochondria are rare near a node but rise to asymptote within a few micrometers (Fig. 3D). Thus, astrocytes do not supply ATP to the nodes.
To understand why mitochondria do not concentrate at the node of Ranvier, we calculated from Fick's law how rapidly sodium entering a node would redistribute. A pulse of sodium at the center of a node diffuses away from the node in both directions, and the nodal sodium concentration decreases exponentially, falling by 90% within 1 ms (Fig. 3E). This suggests that sodium extrusion occurs mainly in the internodes, and that is where the mitochondria occur.
Energy capacity versus fiber caliber
We measured the mitochondrial volume per unit length in axons of different caliber. Volume was measured as the area of a mitochondrial cross-section times the section thickness (∼90 nm). These measurements yielded the concentration of mitochondria in axonal cytoplasm (Fig. 4A). Mitochondrial concentration rose steeply for the finest axons, then leveled off at ∼1.6% for diameters greater than ∼0.7 μm. Thus, mitochondrial volume (Vm) had a quadratic relation to axonal diameter (d). Fitting a quadratic polynomial in d by minimizing squared error gave a relation of the form Vm = 0.0044 (d − 0.46) [(d − 0.46) + 4.7]. The parameters are well constrained by the fit—5% change in any of them increased χ2 by a factor of 2–3. Thus, for small diameters (∼0.5 μm), the mitochondrial volume rose linearly in diameter, whereas for larger diameters (>0.7 μm), the relation was quadratic. The initial subquadratic rise probably reflects the exclusion of mitochondria from the smallest profiles, which are constrictions (Fig. 2B).
Unmyelinated axons in retina
Axons emerging from ganglion cell somas collect in the nerve fiber layer and run toward the optic disk. Over this course, they remain unmyelinated. Because their firing rates are the same as for the myelinated segments, we thought to compare their structures and energy capacities. Unmyelinated axons in retina showed a similar range of diameters as for the myelinated segments and a similar skewed distribution (Fig. 5A,C). The shape of the distribution for unmyelinated segments was well described by a lognormal curve; i.e., the natural logarithm of the diameter was distributed as a Gaussian with a mean of log[0.62] and an SD of 0.31. Here, the best-fitting parameters were determined by minimizing χ2 (assuming SE for bins with N counts). An ∼10% variation in the parameters more than doubled χ2. The diameter range containing 95% of the axons was 0.3–1.1 μm. Although the unmyelinated and myelinated distributions differed slightly, the samples came from different animals and probably from different eccentricities, so it is unclear whether these fine differences are reliable.
Unmyelinated axons were not separated by glial processes, as in the nerve, but instead were packed together in tight bundles (Fig. 5A,B). The bundles were enveloped by processes of Muller glia. These appeared dark in electron micrographs, attributable to abundant glycogen (Fig. 5A,B). Mitochondria were absent from Muller processes but were abundant in ganglion cell somas, dendrites, and axons (Fig. 5B,D) (Kageyama and Wong-Riley, 1984). The absence of mitochondria in Muller processes of the guinea pig inner retina (Germer et al., 1998), and their abundance in retinal neurons, render this brain region a “poster child” for the lactate shuttle hypothesis (Pellerin and Magistretti, 1994; Poitry-Yamate et al., 1995).
In the unmyelinated segments, mitochondria were 0.27 ± 0.05 μm in diameter (n = 2450)—similar to the nerve. Mitochondrial concentration increased steeply with fiber caliber, reaching a plateau of 3.5% for fibers >0.7 μm diameter and then relaxing slightly (Fig. 4A). Because the mitochondrial concentration was approximately constant over a large range of diameters, the mitochondrial volume (Vm), increased quadratically with diameter (d) over this range (Fig. 4B). Fitting a quadratic polynomial in d gave a relation of the form Vm = 0.017 (d − 0.44) [(d − 0.44) + 2.5]. A 5% change in any of the parameters increased χ2 by a factor of 2–3. Thus, the pattern of mitochondrial concentration in the unmyelinated segments resembled that of the myelinated segments, but for fibers thicker than 0.7 μm, the volume fraction was twofold greater (Fig. 4A).
How the optic nerve allocates spikes
The smallest ganglion cell with the finest axon is the “local-edge” type, whereas the largest ganglion cell with the thickest axon is the “brisk-transient” type. The local-edge cells respond to movies of natural scenes with mean firing rates of ∼4 spikes s−1 (range, 1–7 Hz), whereas the ON brisk-transient cells respond to the same movies with twofold higher mean rates (Koch et al., 2006). For example, Figure 6A shows a local-edge and a brisk-transient cell responding simultaneously to 2 s of a 20 s natural movie clip. Each cell type responds with a characteristic firing pattern, which leads to different average firing rate. If firing rates for the thinnest and thickest axons reflect a general relationship, then the distribution of firing rates should match the distribution of axon diameters. To test this, we recorded 234 neurons in three retinas during stimulation with naturalistic movies. The distribution of mean firing rates was well described by a lognormal function, i.e., the natural logarithm of the firing rate was distributed as a Gaussian with a mean of log[4.3 ± 0.8] and an SD of 0.72 ± 0.7 (Fig. 6B). Here, the best-fitting parameters were derived by minimizing χ2 (assuming SE for bins with N counts), and the ranges indicate variations that doubled χ2.
Given that small axons fire rarely and large axons fire more, we asked if there might be a simple relationship between mean firing rate and axon diameter. We considered a relationship between axon diameter and mean firing rate, rather than peak rate, because the rapid diffusion of sodium out of the nodes (Fig. 3E) suggested that even at the highest observed firing rates, the relatively slow restoration of overall ionic concentrations in an axon is the dominant consideration. This was confirmed by compartmental modeling (see below).
The simplest possible relationship between axon diameter and mean firing rate would be linear: r = K (d − s), where R is the firing rate, d is the diameter, K is a proportionality constant, and s is a minimal axon diameter. If firing rate were indeed linear with diameter, a shifted and rescaled firing rate distribution would match the axon diameter distribution. Testing this, we found that these distributions match best for K = 10.0, s = 0.46 μm (Fig. 6C). This value of s is near the finest fiber diameters in our measurements (Figs. 1E, 5C); it is the diameter below which local fluctuations in channel density apparently cause noise in spike timing (Faisal et al., 2005). A similar analysis for unmyelinated axons showed that the best match occurred for r = 13.4 (d − 0.32). An ∼20% variation in the parameters in both cases increased the squared deviation between the matched distributions by a factor of ∼2.
We similarly tested a possible quadratic relation between rate and diameter (r = K2 (d − s)2 + K1 (d − s)), as well a possible linear relation between the logarithms of the rate and the diameter (log(R) = log(C) + E log(d), or, equivalently, r = C dE). (We tried the latter relation because any two lognormal curves can be transformed into each other by shifting the mean and rescaling the SD of the logarithm of the independent variable (x)—i.e., by a linear transformation on log(x).) The best-fitting nonlinear models (quadratic: K2 = 7.2, K1 = 0, s = 0.1; log-linear: C = 2.4, E = 0.4) gave mean squared deviations between the rate and diameter distributions that were similar to the linear model. However, although they matched the shape of the distributions well near their peaks, the nonlinear models predicted that the largest axons in our dataset (d ∼3.5 μm) would have mean firing rates of ∼80–120 Hz, but such high rates are not seen. In contrast, the linear hypothesis maps diameters of 3.5 μm to firing rates of ∼30 Hz, which were the highest seen in our data. Consequently, we accept the hypothesis of a linear relationship between fiber diameter and firing rate. Most of the information transmitted to the brain by the eye is sent at lowest mean firing rates (Koch et al., 2006). Any monotonic relation between rate and diameter thus implies that most information is carried by the thinnest fibers.
The conclusion relating firing rates to axon diameter (Fig. 6) come from recordings in vitro. However, recordings in vivo generally yield higher spontaneous firing rates (Troy and Robson, 1992), so one might wonder whether this linear relationship holds in the intact, behaving animal. The actual firing rates in an intact animal remain unknown for two reasons: (1) the in vivo rates derive from acute preparations that are highly stressed and influenced by various anesthetics; (2) the average response rates to naturalistic stimuli have not been studied in the acute preparation.
However, there is some evidence that in vivo rates (evoked and spontaneous) increase proportionally. First, ganglion cell detection thresholds (which depend on the ratio of evoked to spontaneous rates) are similar in vitro and in vivo. These thresholds apparently account for behavioral detection (Borghuis et al., 2008), suggesting that the evoked/spontaneous ratio might hold across recording conditions. Second, the differences between types, sluggish versus brisk, and brisk-transient versus brisk-sustained are seen under both conditions (Troy and Shou, 2002). Thus, the relationships between cell types, and between evoked and spontaneous firing rates, seem similar under both recording conditions. Since these relationships drive our analysis, we expect that it will extend to the intact animal. In particular, if all rates (evoked and spontaneous) for all cell types increase proportionally, the relation between rate and diameter that we find will continue to hold. In any case, as we will see, our broad conclusions will not depend specifically on a linear relationship between rate and diameter.
How the optic nerve relates energy and information
For the unmyelinated region within the retina, an axon's energy cost per spike corresponds to the number of sodium ions needed to discharge its membrane capacitance. This rises linearly with axon diameter d (see Materials and Methods) (Fig. 7A). The precise slope is proportional to the assumed capacitance, but for our purposes, the key point is the linear increase in sodium flux, and hence, energy cost, as a function of diameter.
Figure 7.

Metabolic cost of spiking. A, Sodium entry for one action potential based on capacitance calculations and a compartmental model (see Materials and Methods; see supplemental material, available at www.jneurosci.org). Sodium entry per spike for myelinated axons is constant but for unmyelinated axons rises with axon diameter. B, Energy capacity per spike, calculated by dividing the mitochondrial volume for each axon diameter (Fig. 4B) by the corresponding estimated firing rate [Fig. 6C or r = 10 (d − 0.46) for myelinated axons, and r = 13.4 (d − 0.32) for unmyelinated axons]. C, Information rises more slowly than energy capacity, giving a law of diminishing returns. Information rate was calculated from firing rates associated with different axon calibers (Koch et al., 2006).
For the myelinated region within the nerve, the energy cost per spike corresponds to the number of sodium ions needed to discharge axonal capacitance at a node of Ranvier times the number of nodes. The length of a node was invariant with axon caliber, so nodal capacitance rises simply with d. However, the distance between nodes also rises with d (Hess and Young, 1949, 1952). Therefore, nodal membrane capacitance per unit length should be invariant with axon caliber. Internodal membrane capacitance per unit length should also be invariant, because thicker axons have thicker sheaths (Guy et al., 1989).
We estimated sodium entry (including both the nodal and internodal regions) both by calculating the capacitance and from a multicompartmental model tuned to operate at 37°C. Both methods gave the same result, entry of ∼1200 Na+ spike−1 μm−1 (Fig. 7A) (see Materials and Methods). The precise value depends on the assumed membrane capacitance and the conductances in the model, but for our purposes, the key point is that both methods of analysis show sodium entry to be independent of diameter for myelinated axons. Importantly, both estimates assume that internodal length = axon diameter × 100 (Rushton, 1951). If this scaling relation fails for small central axons (Waxman and Bennett, 1972), our model estimates would be off. Yet, since the function of myelin is clearly to reduce capacitance and increase the space constant, one would not expect the error to be very large.
To assess the energy cost per spike in real axons, we divided the mitochondrial volume for axons of each diameter (Fig. 4B) by the associated firing rate (Fig. 6B,C) (rate-diameter match for unmyelinated axons not shown), assuming our hypothesized linear relation between rate and diameter. For unmyelinated regions, energy capacity per spike increased linearly over the range of measured axon diameters (Fig. 7B)—as expected from theory (Fig. 7A). Therefore, under naturalistic conditions, energy capacity of unmyelinated axons apparently matches the cost of spiking. However, for myelinated regions, energy capacity per spike was approximately constant over the range of measured axon diameters (Fig. 7B). This was also expected from theory, because the capacitance of a myelinated axon is approximately independent of diameter.
Yet, the slope deviated slightly from zero (4.89*10−04/μm), suggesting that there must be some additional cost beyond sodium pumping. If we assumed a quadratic relation between rate and diameter (rejected above because of the poor match between the ranges of firing rates and axon diameters), the myelinated energy capacity per spike would have been constant, as expected from theory. However, in that case, the unmyelinated energy capacity per spike would have failed to rise linearly as expected. This gave an additional reason to reject the hypothesis of quadratic dependence of rate on diameter.
An axonal firing rate can be converted into an estimated information rate following a simple formula (Koch et al., 2006). For each axonal diameter, using the formula and the linear relation between diameter and firing rate (Fig. 6C), we computed the information rate. Plotting these information rates against the mitochondrial volume of axons of the associated diameter, we found that information increases sublinearly with energy capacity (Fig. 7C). Thus, doubling the information requires more than double the energy capacity (e.g., a twofold change from 6 bits s−1 to 12 bits s−1 is associated to a 2.6-fold increase in mitochondrial volume). This law of diminishing returns was expected on information theoretic grounds (Levy and Baxter, 1996; Sarpeshkar, 1998; Balasubramanian et al., 2001; de Polavieja, 2002) and is here confirmed in the data. This principle was robust to substantial changes in the assumed relationship between rate and diameter—specifically, it held even for an assumed quadratic relationship between rate and diameter.
Sodium buffering does not explain the need for larger axons
Because Na+ accumulation in a small axon during a burst of spikes might delay or block conduction, we asked whether larger axon diameters are essential for buffering sodium. To test this, we used the multicompartment model that reproduced the known spike shape in mammalian myelinated axons (Fig. 8A) (Koch, 1999) and the known relationship between fiber diameter and conduction velocity (Fig. 8B). We then evaluated the change in internal sodium concentration [Na+]i in the nodal compartment of the smallest diameter axon (0.2 μm). Testing the highest observed instantaneous firing rate (300 impulses s−1) (Koch et al., 2006), we extended the longest observed duration by 10-fold (30 impulses/100 ms). Under these conditions, [Na+]i in the nodal compartment steadily increased by ∼10 mm (Fig. 8C, gray line), in agreement with the observed [Na+]i change in Purkinje dendritic processes (Rose, 2003). Introducing Na+ diffusion into the internodal region completely eliminated this concentration increase (Fig. 8C, black line). These results were robust to changes in model parameters—e.g., a 25% change in assumed sodium conductance only changes the action potential shape and propagation velocity by a few percent, leaving the above conclusions unchanged. We conclude that under natural conditions increases in sodium concentration are small and, even in the finest myelinated axon, would not affect spiking. Therefore, larger axons are not needed to buffer sodium.
Figure 8.

Larger axons are not required for sodium buffering. A, Compartmental model correctly reproduces the action potential shape and conduction delays between successive nodes of Ranvier. B, Model reproduces the known relationships between axon diameter and conduction velocity for myelinated and unmyelinated axons. C, Model shows that a train of spikes in a fine, myelinated axon (d = 0.2 μm) raises the local concentration of sodium (gray line). However, when the model allows diffusion to the internodes (τ ∼ 1 ms), sodium does not accumulate (black line).
Discussion
Allocation of space and energy
We expected that most space and energy capacity in a central tract would be devoted to nerve fibers. However, we found that ∼30% of the space is devoted to astrocytes (vs 11% in mouse cortex) (Schüz and Palm, 1989). Furthermore, 72% of the mitochondria are in astrocytes, and their volume fraction is twice that in axoplasm. Thus, although astrocytes may operate anaerobically to some degree, in the nerve they appear also to maintain considerable intrinsic oxidative capacity, and one wonders what function requires this.
Each spike dumps a K+ pulse into the extracellular space. Because all fibers are firing, individual pulses are not spatially buffered and thus cause sharp, local rises in potassium. The concentration is restored in two phases: rapidly by the glial Na/K-ATPase with a low affinity for K+ and slowly by the axonal Na/K-ATPase with a high affinity for K+ (Ransom et al., 2000). Thus, the role of astrocytes in rapidly reducing extracellular potassium may explain their large proportion of space and energy capacity (Fig. 1).
Because the node of Ranvier is the main site of sodium influx during the action potential, we expected to find mitochondria concentrated there, similar to high mitochondrial concentrations at other sites of major cation flux, e.g., photoreceptor inner segments, basal membranes of renal tubules, and salt glands (Bloom, 1968). However, mitochondria were absent from the node (Fig. 3). This seemed less surprising when we calculated that sodium entering focally at a node would diffuse rapidly to the internodes (Fig. 3E). That is where the sodium-extruding Na/K-ATPase is located (McGrail and Sweadner, 1990; McGrail et al., 1991). Thus, the mitochondria in myelinated axons are actually located where they are needed.
Why optic axons are mostly thin
Optic axons were rarely thinner than 0.5 μm, probably because below this diameter spontaneous channel fluctuations cause variations in spike timing sufficient to degrade the message (Faisal and Laughlin, 2007). However, starting from the smallest diameters, the distribution rises to a sharp peak near 0.7 μm (Fig. 1). This predominance of small diameters may occur because, although thicker axons increase firing proportionally to diameter (Fig. 6C), their mitochondrial volume (hence energy capacity) increases as the diameter squared. This implies a law of diminishing returns: information rises sublinearly with energy capacity (Fig. 7C) (Levy and Baxter, 1996; Sarpeshkar, 1998; Balasubramanian et al., 2001; Balasubramanian and Berry, 2002; de Polavieja, 2002; Niven et al., 2007). Thus, efficient energy use splits the information stream among many thin, low-rate carriers (Koch et al., 2006).
Why some axons are thick
The standard idea is that thick axons are required to achieve higher conduction velocity and shorter conduction times. This is true where conduction distances are long and rapid responses are essential—e.g., fast reflex loops, certain pyramidal tract fibers (Biedenbach et al., 1986), certain corticocortical connections in larger brains (Wang et al., 2008), and certain optic fibers in large, aquatic mammals (Mazzatenta et al., 2001). However, the need for larger axons in the optic nerve of smaller mammals does not seem to be explained by this “conduction time” hypothesis.
First, conduction distances to the lateral geniculate nucleus (LGN) are sufficiently short (17 mm in guinea pig) that difference in conduction times between the thinnest and thickest axons is only ∼3.2 ms. This is comparable with the shortest interspike interval and considerably shorter than typical temporal response variability of 10–30 ms across repetitions of a stimulus (Meister and Berry, 1999; Koch et al., 2006). Thus, the conduction advantage of the thick axons is unlikely to play a role in detection of visual stimuli [see Troy and Lennie (1987) for a similar conclusion from measurements in cat LGN]. Nevertheless, one may wonder whether spikes in a fast-conducting axon could have conditioning effects on cells postsynaptic to a slow-conducting axon. This seems unlikely: (1) the large temporal variability of spike generation would render such conditioning unreliable; (2) different ganglion cell types maintain separate pathways to their postsynaptic neurons and do not show convergence. For example, X, Y, and W ganglion cells drive X, Y, and W geniculate neurons, without cross talk (Raczkowski et al., 1988). Overall, it seems implausible that the brain would devote significantly more space and energy for such an apparently minor reduction in conduction time.
Second, the conduction time hypothesis suggests that increasing conduction distance would shift the whole-fiber distribution toward larger diameters. This is not supported by cross-species comparisons (mouse to man), where the optic nerve varies in length by 10-fold. The fiber distributions in all species are skewed and, far from shifting toward larger calibers with longer distances, the distributions essentially superimpose (Fig. 9A). Thus, although instances certainly exist where larger axons are used to reduce conduction time, this does not explain the larger optic axons studied here.
Figure 9.

The distribution of axon diameters in conserved across species. A, The distribution of optic nerve axon diameters is conserved, with mostly small diameters, peaking near 0.7 μm and skewed. This is despite a 10-fold difference in conduction distance. In fact, human, with the longest conduction distance, has the finest fibers. Most axons in the human optic nerve derive from midget ganglion cells with input from a single cone. Thus, these cells should have low-firing and low-information rates consistent with their fine caliber. B, Optimizing information with respect to energy cost can select the most common axon diameter. The total power associated to a unit length of axon was assumed to be E = Vm + C, where Vm is the mitochondrial volume per unit length (Fig. 4B) and C is an additional constant cost, expressed in the same units, that is independent of firing rate. Bits per energy was computed by dividing the information rate associated to an axon of a given diameter by E (Materials and Methods). The constant C was adjusted to give an extremum at 0.7 μm.
Alternatively, if high spike rates would raise the sodium concentration in fine axons, thicker axons might be needed to increase axoplasmic volume as a buffer. However, a compartmental model showed that firing rates far exceeding the natural rates would not alter the sodium concentration even in the finest axon (Fig. 8C). Thus, fine axons should easily support the highest spike rates without refractoriness.
Here, we propose a new hypothesis for why some axons are thick. First, recall that information represented by Poisson release of n transmitter quanta rises as log2 of the signal/noise ratio. Doubling this ratio would require at least quadrupling n. Consequently, an axon carrying twice the information rate should require more than four times the number of active zones to transfer this information at its output. Indeed, it is clear that the photoreceptors and bipolar cells with higher information rates use thicker axons and larger terminals with more active zones (Sterling, 2004; Sterling and Freed, 2007).
Ganglion cell central arbors apparently also follow this rule: (1) brisk-transient (Y) cells with higher information rates have a thicker axon with more central boutons than brisk-sustained (X) cells (Bowling and Michael, 1984; Humphrey et al., 1985a,b; Roe et al., 1989). Moreover, Y boutons are larger and contain more active zones (Hamos et al., 1985). Sluggish (W) cells with the lowest information rates have the thinnest axons and contact W cells in the LGN via fewer synapses than used by Y or X cells (Raczkowski et al., 1988). Given these facts, we propose that axon caliber in the optic nerve increases with mean spike rate, not to achieve any intrinsic electrophysiological advantage, but rather to support larger terminal arbors and the extra active zones needed to transfer information synaptically at higher rates. Cells with higher information rates may also supply more central nuclei, and this would further increase their needs for axonal transport (Tamamaki et al., 1995).
This hypothesis might also fit other types of central neuron. For example, pyramidal neurons with higher firing rates (thus higher information rates) have faster conducting, i.e., thicker, axons (Armstrong and Drew, 1984). And Drosophila neurons with more voluminous terminal arbors express more active zones (Egger et al., 1997).
These points suggest a broad conclusion: an axon's cross-sectional area rises proportionally with the number of active zones at its output. This expanded cross-section accommodates additional microtubules to serve the added burden of axonal transport (Sterling and Freed, 2007). Microtubules in fine axons exhibit fixed spacing (Peters et al., 1991; Hsu et al., 1998), so increasing their number requires expansion of the axonal cross-section. Thicker axons also contain neurofilaments as cytoskeletal elements (Peters et al., 1991) that contribute to the expansion. Thus, the increase in axon volume with spike rate may be fundamentally set by the need to supply larger central arbors that transfer higher information rates.
What sets the most common axon diameter?
The optic nerve's most common axon diameter is 0.7 μm. Perhaps this value is set to reduce the cost of communication by ganglion cells. Suppose, for example, that optic axons with their terminal arbors maximize their information per unit energy. Assume that a neuron's total cost is proportional to E = Vm+ C, where Vm is the mitochondrial volume, and C (in units of mitochondrial volume per unit axonal length, μm3) reflects basal costs that are independent of firing rate. Then information/E can be computed numerically from Figure 7C. The result is that bits per cost is maximized at a diameter of 0.7 μm—if C = 0.0015 μm3, which is comparable with the mitochondrial volumes in very fine axons (diameter, ∼0.5 μm) (Fig. 9B). Thus, optimizing neuronal communication with respect to energy use might determine the typical axonal diameter. The existence of such an optimum simply requires a law of diminishing returns relating information to energy (Fig. 7C); it does not require the linear relation between rate and diameter for which we found evidence. This optimization includes one parameter, a basal cost C, whose measurement would allow one to evaluate this model.
Footnotes
This work was supported by National Institutes of Health (NIH) Grants EY 08124 and R01 EY03014, and National Science Foundation Grant IBN-0344678. V.B. was supported in part as the Helen and Martin Chooljian member of the Institute for Advanced Study. We thank Jian Li for electron microscopy and Sharron Fina for help with the figures. In addition, we are grateful to Michael Sikora for programming, Quan Wen for providing software, and Michael Berry for the use of his multielectrode recording system. We also benefited from discussions with Jurgen Fohlmeister and Robert Smith and from comments on this manuscript by Steven Scherer, Gary Matthews, and Simon Laughlin.
References
- Armstrong DM, Drew T. Discharges of pyramidal tract and other motor cortical neurones during locomotion in the cat. J Physiol. 1984;346:471–495. doi: 10.1113/jphysiol.1984.sp015036. [DOI] [PMC free article] [PubMed] [Google Scholar]
- Attwell D, Laughlin SB. An energy budget for signaling in the grey matter of the brain. J Cereb Blood Flow Metab. 2001;21:1133–1145. doi: 10.1097/00004647-200110000-00001. [DOI] [PubMed] [Google Scholar]
- Balasubramanian V, Berry MJ., 2nd A test of metabolically efficient coding in the retina. Network. 2002;13:531–552. [PubMed] [Google Scholar]
- Balasubramanian V, Kimber D, Berry MJ. Metab lically efficient information processing. Neural Comp. 2001;13:799–815. doi: 10.1162/089976601300014358. [DOI] [PubMed] [Google Scholar]
- Biedenbach MA, De Vito JL, Brown AC. Pyramidal tract of the cat: axon size and morphology. Exp Brain Res. 1986;61:303–310. doi: 10.1007/BF00239520. [DOI] [PubMed] [Google Scholar]
- Bloom W. A textbook of histology. Philadelphia: W. B. Saunders; 1968. [Google Scholar]
- Borghuis BG, Ratliff CP, Smith RG, Sterling P, Balasubramanian V. Design of a neuronal array. J Neurosci. 2008;28:3178–3189. doi: 10.1523/JNEUROSCI.5259-07.2008. [DOI] [PMC free article] [PubMed] [Google Scholar]
- Bowling DB, Michael CR. Terminal patterns of single, physiologically characterized optic tract fibers in the cat's lateral geniculate nucleus. J Neurosci. 1984;4:198–216. doi: 10.1523/JNEUROSCI.04-01-00198.1984. [DOI] [PMC free article] [PubMed] [Google Scholar]
- de Polavieja GG. Errors drive the evolution of biological signalling to costly codes. J Theor Biol. 2002;214:657–664. doi: 10.1006/jtbi.2001.2498. [DOI] [PubMed] [Google Scholar]
- Eccles JC, Kostyuk PG, Schmidt RF. Central pathways responsible for depolarization of primary afferent fibres. J Physiol. 1962;161:237–257. doi: 10.1113/jphysiol.1962.sp006884. [DOI] [PMC free article] [PubMed] [Google Scholar]
- Edgar JM, McCulloch MC, Thomson CE, Griffiths IR. Distribution of mitochondria along small diameter myelinated central nervous system axons. J Neurosci Res. 2008;86:2250–2257. doi: 10.1002/jnr.21672. [DOI] [PubMed] [Google Scholar]
- Egger MD, Nowakowski RS, Peng B, Wyman RJ. Patterns of connectivity in a Drosophila nerve. J Comp Neurol. 1997;387:63–72. [PubMed] [Google Scholar]
- Faisal AA, Laughlin SB. Stochastic simulations on the reliability of action potential propagation in thin axons. PLoS Comput Biol. 2007;3:e79. doi: 10.1371/journal.pcbi.0030079. [DOI] [PMC free article] [PubMed] [Google Scholar]
- Faisal AA, White JA, Laughlin SB. Ion-channel noise places limits on the miniaturization of the brain's wiring. Curr Biol. 2005;15:1143–1149. doi: 10.1016/j.cub.2005.05.056. [DOI] [PubMed] [Google Scholar]
- Fohlmeister JF. A nerve model of greatly increased energy-efficient and encoding flexibility over the Hodgkin-Huxley model. Brain Res. 2009 doi: 10.1016/j.brainres.2009.06.101. in press. [DOI] [PMC free article] [PubMed] [Google Scholar]
- Fohlmeister JF, Miller RF. Impulse encoding mechanisms of ganglion cells in the tiger salamander retina. J Neurophysiol. 1997a;78:1935–1947. doi: 10.1152/jn.1997.78.4.1935. [DOI] [PubMed] [Google Scholar]
- Fohlmeister JF, Miller RF. Mechanisms by which cell geometry controls repetitive impulse firing in retinal ganglion cells. J Neurophysiol. 1997b;78:1948–1964. doi: 10.1152/jn.1997.78.4.1948. [DOI] [PubMed] [Google Scholar]
- Friede RL, Beuche W. A new approach toward analyzing peripheral nerve fiber populations: I. Variance in sheath thickness corresponds to different geometric proportions of the internodes. J Neuropathol Exp Neurol. 1985;44:60–72. doi: 10.1097/00005072-198501000-00005. [DOI] [PubMed] [Google Scholar]
- Friede RL, Benda M, Dewitz A, Stoll P. Relations between axon length and axon clier. “Is maximum conduction velocity the factor controlling the evolution of nerve structure”? J Neurol Sci. 1984;63:369–380. doi: 10.1016/0022-510x(84)90160-6. [DOI] [PubMed] [Google Scholar]
- Germer A, Biedermann B, Wolburg H, Schuck J, Grosche J, Kuhrt H, Reichelt W, Schousboe A, Paasche G, Mack AF, Reichenbach A. Distribution of mitochondria within Muller cells. I. Correlation with retinal vascularization in different mammlian species. J Neurocytol. 1998;27:329–345. doi: 10.1023/a:1006934724566. [DOI] [PubMed] [Google Scholar]
- Guy J, Ellis EA, Kelley K, Hope GM. Spectra of G ratio, myelin sheath thickness, and axon and fiber diameter in the guinea pig optic nerve. J Comp Neurol. 1989;287:446–454. doi: 10.1002/cne.902870404. [DOI] [PubMed] [Google Scholar]
- Hackenbrock CR. Chemical and physical fixation ofisolated mitochondria in low-energy and high-energy states. Proc Natl Acad Sci U S A. 1968a;61:598–605. doi: 10.1073/pnas.61.2.598. [DOI] [PMC free article] [PubMed] [Google Scholar]
- Hackenbrock CR. Ultrastructural bases for metabolically linked mechanical activity in itochondria. II. Electron transport-linked ultrastructural transformations in mitochondria. J Cell Biol. 1968b;37:345–369. doi: 10.1083/jcb.37.2.345. [DOI] [PMC free article] [PubMed] [Google Scholar]
- Hamos JE, Van Horn SC, Raczkowski D, Uhlrich DJ, Sherman SM. Synaptic connectivity of a local circuit neruone in lateral geniculate nucleus of the cat. Nature. 1985;317:618–621. doi: 10.1038/317618a0. [DOI] [PubMed] [Google Scholar]
- Hess A, Young JZ. Nodes of Ranvier in the central nervous system. J Physiol. 1949;108 Proc., 52. [PubMed] [Google Scholar]
- Hess A, Young JZ. The nodes of Ranvier. Proc R Soc Lond B Biol Sci. 1952;140:301–320. doi: 10.1098/rspb.1952.0063. [DOI] [PubMed] [Google Scholar]
- Hines ML, Carnevale NT. The NEURON simulation environment. Neural Comput. 1997;9:1179–1209. doi: 10.1162/neco.1997.9.6.1179. [DOI] [PubMed] [Google Scholar]
- Hodgkin A. The optimum density of sodium channels in an unmyelinated nerve. Philos Trans R Soc Lond B Biol Sci. 1975;270:297–300. doi: 10.1098/rstb.1975.0010. [DOI] [PubMed] [Google Scholar]
- Hsu SC, Hazuka CD, Roth R, Foletti DL, Heuser J, Scheller RH. Subunit composition, protein interactions, and structures of the mammalian brain sec 6/8 complex and septin filaments. Neuron. 1998;20:1111–1122. doi: 10.1016/s0896-6273(00)80493-6. [DOI] [PubMed] [Google Scholar]
- Humphrey AL, Sur M, Uhlrich DJ, Sherman SM. Projection patterns of individual X- and Y-cell axons from the lateral geniculate nucleus to cortical area 17 in the cat. J Comp Neurol. 1985a;233:159–189. doi: 10.1002/cne.902330203. [DOI] [PubMed] [Google Scholar]
- Humphrey AL, Sur M, Uhlrich DJ, Sherman SM. Termination patterns of individual X- and Y-cell axons in the visual cortex of the cat: projections to area 18, to the 17/18 border region, and to both areas. J Comp Neurol. 1985b;233:190–212. doi: 10.1002/cne.902330204. [DOI] [PubMed] [Google Scholar]
- Hunt CC. Relation of function to diameter in afferent fiers of muscle nerves. J Gen Physiol. 1954;38:117–131. doi: 10.1085/jgp.38.1.117. [DOI] [PMC free article] [PubMed] [Google Scholar]
- Hursh JB. Conduction velocity and diameter of nerve fibers. Am J Physiol. 1939;127:131–139. [Google Scholar]
- Kageyama GH, Wong-Riley MT. The histochemical localization of cytochrome oxidase in the retina and lateral geniculate nucleus of the ferret, cat, and monkey, with particular reference to retinal mosaics and ON/OFF-center visual channels. J Neurosci. 1984;4:2445–2459. doi: 10.1523/JNEUROSCI.04-10-02445.1984. [DOI] [PMC free article] [PubMed] [Google Scholar]
- Kao YH, Sterling P. Displaced GAD65 amacrine cells of the guinea pig retina are morphologically diverse. Vis Neurosci. 2006;23:931–939. doi: 10.1017/S0952523806230293. [DOI] [PubMed] [Google Scholar]
- Koch C. Biophysics of computation: information processing in single neurons. New York: Oxford UP; 1999. [Google Scholar]
- Koch K, McLean J, Berry M, Sterling P, Balasubramanian V, Freed MA. Efficiency of information transmission by retinal ganglion cells. Curr Biol. 2004;14:1523–1530. doi: 10.1016/j.cub.2004.08.060. [DOI] [PubMed] [Google Scholar]
- Koch K, McLean J, Segev R, Freed MA, Berry MJ, 2nd, Balasubramanian V, Sterling P. How much the eye tells the brain. Curr Biol. 2006;16:1428–1434. doi: 10.1016/j.cub.2006.05.056. [DOI] [PMC free article] [PubMed] [Google Scholar]
- Laughlin SB, Sejnowski TJ. Communication in neuronal networks. Science. 2003;301:1870–1874. doi: 10.1126/science.1089662. [DOI] [PMC free article] [PubMed] [Google Scholar]
- Lennie P. The cost of cortical computation. Curr Biol. 2003;13:493–497. doi: 10.1016/s0960-9822(03)00135-0. [DOI] [PubMed] [Google Scholar]
- Levy WB, Baxter RA. Energy efficient neural codes. Neural Comput. 1996;8:531–543. doi: 10.1162/neco.1996.8.3.531. [DOI] [PubMed] [Google Scholar]
- Mazzatenta A, Caleo M, Baldaccini NE, Maffei L. A comparative morphometric analysis of the optic nerve in two cetacean species, the striped dolphin (Stenella coeruleoalba) and fin whale (Balaenoptera physalus) Vis Neurosci. 2001;18:319–325. doi: 10.1017/s0952523801182155. [DOI] [PubMed] [Google Scholar]
- McGrail KM, Sweadner KJ. Complex expression patterns for Na+, K+,-ATPase isoforms in retina and optic nerve. Eur J Neurosci. 1990;2:170–176. doi: 10.1111/j.1460-9568.1990.tb00409.x. [DOI] [PubMed] [Google Scholar]
- McGrail KM, Phillips JM, Sweadner KJ. Immunofluorescent localization of three Na, K-ATPase isozymes in the rat central nervous system: both neurons and glia can express more than one Na, K-ATPase. J Neurosci. 1991;11:381–391. doi: 10.1523/JNEUROSCI.11-02-00381.1991. [DOI] [PMC free article] [PubMed] [Google Scholar]
- Meister M, Berry MJ., 2nd The neural code of the retina. Neuron. 1999;22:435–450. doi: 10.1016/s0896-6273(00)80700-x. [DOI] [PubMed] [Google Scholar]
- Niven JE, Anderson JC, Laughlin SB. Fly photoreceptors demonstrate energy-information trade-offs in neural coding. PLoS Biol. 2007;5:e116. doi: 10.1371/journal.pbio.0050116. [DOI] [PMC free article] [PubMed] [Google Scholar]
- Pellerin L, Magistretti PJ. Glutamate uptake into astrocytes stimulates aerobic glycolysis: a mechanism coupling neuronal activity to glucose utilization. Proc Natl Acad Sci U S A. 1994;91:10625–10629. doi: 10.1073/pnas.91.22.10625. [DOI] [PMC free article] [PubMed] [Google Scholar]
- Peters A, Palay SL, Webster H. The fine structure of the nervous system: neurons and their supporting cells. New York: Oxford UP; 1991. [Google Scholar]
- Poitry-Yamate CL, Poitry S, Tsacopoulos M. Lactate released by Müller glial cells is metabolized by photoreceptors from mammalian retina. J Neurosci. 1995;15:5179–5191. doi: 10.1523/JNEUROSCI.15-07-05179.1995. [DOI] [PMC free article] [PubMed] [Google Scholar]
- Raczkowski D, Hamos JE, Sherman SM. Synaptic circuitry of physiologically identified W-cells in the cat's dorsal lateral geniculate nucleus. J Neurosci. 1988;8:31–48. doi: 10.1523/JNEUROSCI.08-01-00031.1988. [DOI] [PMC free article] [PubMed] [Google Scholar]
- Ransom CB, Ransom BR, Sontheimer H. Activity-dependent extracellular K+ accumulation in rat optic nerve: the role of glial and axonal Na+ pumps. J Physiol. 2000;522:427–442. doi: 10.1111/j.1469-7793.2000.00427.x. [DOI] [PMC free article] [PubMed] [Google Scholar]
- Roe AW, Garraghty PE, Sur M. Terminal arbors of single ON-center and OFF-center X and Y retrinal ganglion cell axons within the ferret's lateral geniculate nucleus. J Comp Neurol. 1989;288:208–242. doi: 10.1002/cne.902880203. [DOI] [PubMed] [Google Scholar]
- Rose CR. High-resolution Na+ imaging in dendrites and spines. Pflugers Arch. 2003;446:317–321. doi: 10.1007/s00424-003-1036-9. [DOI] [PubMed] [Google Scholar]
- Rushton WA. A theory of the effects of fibre size in medullated nerve. J Physiol. 1951;115:101–122. doi: 10.1113/jphysiol.1951.sp004655. [DOI] [PMC free article] [PubMed] [Google Scholar]
- Sarpeshkar R. Analog versus digital: extrapolating from electronics to neurobiology. Neural Comput. 1998;10:1601–1638. doi: 10.1162/089976698300017052. [DOI] [PubMed] [Google Scholar]
- Scaduto RC, Jr, Grotyohann LW. Measurement of mitochondrial membrane potential using fluorescent rhodamine derivatives. Biophys J. 1999;76:469–477. doi: 10.1016/S0006-3495(99)77214-0. [DOI] [PMC free article] [PubMed] [Google Scholar]
- Scherer SS. Nodes, paranodes, and incisures: from form to function. Ann N Y Acad Sci. 1999;883:131–142. doi: 10.1111/j.1749-6632.1999.tb08576.x. [DOI] [PubMed] [Google Scholar]
- Schüz A, Palm G. Density of neurons and synapses in the cerebral cortex of the mouse. J Comp Neurol. 1989;286:442–455. doi: 10.1002/cne.902860404. [DOI] [PubMed] [Google Scholar]
- Segev R, Goodhouse J, Puchalla J, Berry MJ., 2nd Recording spikes from a large fraction of the ganglion cells in a retinal patch. Nat Neurosci. 2004;7:1154–1161. doi: 10.1038/nn1323. [DOI] [PubMed] [Google Scholar]
- Sterling P. How retinal circuits optimize the transfer of visual information. In: Chalupa LM, Werner JS, editors. The visual neurosciences. Cambridge, MA: MIT; 2004. pp. 243–268. [Google Scholar]
- Sterling P, Freed MA. How robust is a neural circuit? Vis Neurosci. 2007;24:563–571. doi: 10.1017/S0952523807070526. [DOI] [PubMed] [Google Scholar]
- Tamamaki N, Uhlrich DJ, Sherman SM. Morphology of physiologically identified retinal X and Y axons in the cat's thalamus and midbrain as revealed by intraaxonal injection of biocytin. J Comp Neurol. 1995;354:583–607. doi: 10.1002/cne.903540408. [DOI] [PubMed] [Google Scholar]
- Troy JB, Lennie P. Detection latencies of X and Y type cells of the cat's dorsal lateral geniculte nucleus. Exp Brain Res. 1987;65:703–706. doi: 10.1007/BF00235998. [DOI] [PubMed] [Google Scholar]
- Troy JB, Robson JG. Steady discharges of X and Y retinal ganglion cells of cat under photopic illuminance. Vis Neurosci. 1992;9:535–553. doi: 10.1017/s0952523800001784. [DOI] [PubMed] [Google Scholar]
- Troy JB, Shou T. The receptive fields of cat retinal ganglion cells in physiological and pathological states: where we are after half a century of research. Prog Retin Eye Res. 2002;21:263–302. doi: 10.1016/s1350-9462(02)00002-2. [DOI] [PubMed] [Google Scholar]
- Tsukamoto Y, Masarachia P, Schein SJ, Sterling P. Gap junctions between the pedicles of macaque foveal cones. Vision Res. 1992;32:1809–1815. doi: 10.1016/0042-6989(92)90042-h. [DOI] [PubMed] [Google Scholar]
- Wang SS, Shultz JR, Burish MJ, Harrison KH, Hof PR, Towns LC, Wagers MW, Wyatt KD. Functional trade-offs in white matter axonal scaling. J Neurosci. 2008;28:4047–4056. doi: 10.1523/JNEUROSCI.5559-05.2008. [DOI] [PMC free article] [PubMed] [Google Scholar]
- Waxman SG, Bennett MV. Relative conduction velocities of small myeliinated and non-myelinated fibres in the central nervous system. Nat New Biol. 1972;238:217–219. doi: 10.1038/newbio238217a0. [DOI] [PubMed] [Google Scholar]
- Weibel ER. Symmorphosis. Cambridge, MA: Harvard UP; 2000. [Google Scholar]
- Wen Q, Chklovskii DB. Segregation of the brain into gray and white matter: a design minimizing conduction delays. PLoS Comput Biol. 2005;1:e78. doi: 10.1371/journal.pcbi.0010078. [DOI] [PMC free article] [PubMed] [Google Scholar]
- Williams RW, Chalupa LM. An analysis of axon caliber within the optic nerve of the cat: evidence of size groupings and regional organization. J Neurosci. 1983;3:1554–1564. doi: 10.1523/JNEUROSCI.03-08-01554.1983. [DOI] [PMC free article] [PubMed] [Google Scholar]