

Abstract
Beckwith-Wiedemann syndrome (BWS) is a clinical diagnosis; however, molecular confirmation via abnormal methylation of DMR2(LIT1) and/or DMR1(H19) has clinical utility due to epigenotype-tumor association. Despite the strong link between H19 hypermethylation and tumor risk, several diagnostic laboratories only test for hypomethylation of LIT1. We assessed the added diagnostic value of combined LIT1 and H19 testing in a large series of referred samples from 1298 patients, including 53 well-characterized patients from the St. Louis Children's Hospital BWS-Registry (validation samples) and 1245 consecutive nationwide referrals (practice samples). Methylation-sensitive enzymatic digestion with Southern hybridization assessed loss of normal imprinting. In the validation group, abnormal LIT1 hypomethylation was detected in 60% (32/52) of patients but LIT1/H19-combined testing was abnormal in 68% (36/53); sensitivity in the practice setting demonstrated 27% (342/1245) abnormal LIT1 and 32% (404/1245) abnormal LIT1/H19-combined. In addition, H19 methylation was abnormal in 7% of LIT1-normal patients. We observed absence of uniparental disomy (UPD) in 27% of combined LIT1/H19-abnormal samples, diagnostic of multilocus methylation abnormalities; in contrast to studies implicating that combined LIT1/H19 abnormalities are diagnostic of UPD. The overall low detection rate, even in validated patient samples and despite characterization of both loci and UPD status, emphasizes the importance of clinical diagnosis in BWS.
Beckwith-Wiedemann Syndrome (BWS) is a congenital overgrowth disorder with a predisposition for development of aggressive embryonal-type tumors, particularly Wilms’ tumor.1,2,3,4,5,6 BWS is primarily a clinical diagnosis and relies on the hallmark features, including macroglossia, facial dysmorphology, visceromegaly, and macrosomia at birth (>90th percentile), abdominal wall defects, neonatal hypoglycemia, and ear creases or pits.2,7,8,9,10,11 Accurate diagnosis is critical to establish effective tumor surveillance via serial abdominal ultrasounds and serum α-fetoprotein monitoring throughout childhood.2,12 Molecularly, BWS is a prototypical imprinting disorder with unequal gene expression at 11p15.5 (Figure 1, A–D).7,13,14,15,16,17,18,19,20,21,22,23,24,25,26,27,28,29,30,31,32,33,34,35,36,37,38 In addition to genetic counseling and screening in siblings, the clinical utility of molecular confirmation is twofold. The BWS phenotype is highly variable,2,10,11,39,40 visceral manifestations may not be obvious at birth,10,40 facial features normalize across childhood,2,40 and hemihyperplasia may be the only presenting feature.6,41,42,43,44,45 In these atypical or ‘variant’ cases with a milder phenotype, laboratory confirmation may be helpful.2,6,43,46 Second, an epigenotype-phenotype correlation not only with specific birth defects7,47 but also with tumor-risk2,7,12,22,23,45,46 has been shown.
Figure 1.
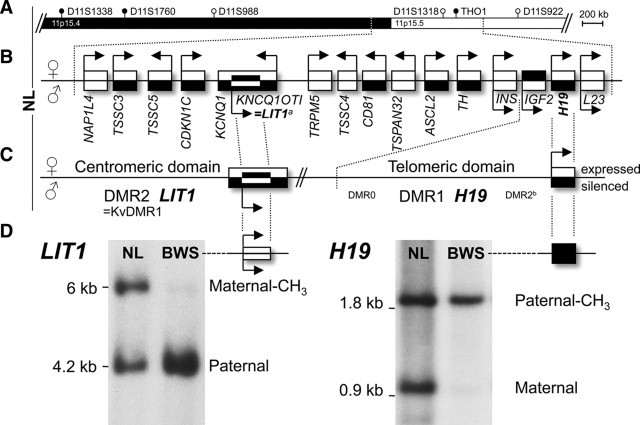
Normal and abnormal methylation in Beckwith-Wiedemann syndrome. A: Location of markers used for UPD-analysis (filled circles, practice group; open circles, validation group). B: Chromosomal region 11p15.5 involved in BWS-associated genomic imprinting defects. With the exception of IGF2 and LIT1, all imprinted genes are expressed (open boxes) from the maternal allele (arrows in transcription direction); silenced genes, black boxes. C: The region can be divided into a centromeric and telomeric domain. Mitsuya et al16 described the existence of a long QT intronic transcript (LIT1) within KCNQ1OT1 that was transcribed in antisense orientation and is referred to as KCNQ1 overlapping transcript 1 (KCNQ1OT1). The assay targets a NotI site in the CpG island within intron 10 of the KCNQ1 gene and at the 5′ end of KCNQ1OT1 known as DMR217,18 (synonyms are IC2, ICR2, BWSIC2 and KvDMR1). H19 is also known as BWS, and the assay targets a SmaI site 5 kb upstream of the H19 promoter between exon 3 and 4 of IGF2 known as DMR119 (synonyms are: IC1, ICR1, BWSIC1, H19DMR, and CTCF binding region). Because DMR2 can refer to a centromeric17,20 or telomeric19 methylation center, in the diagnostic setting LIT1/H19 are the preferred terms. Other differentially methylated regions (DMR) upstream of H19, not assayed here, are depicted (DMR0 located 5′ of the main IGF2 promoter,20 and DMR2 located between intron 7 and 9 of IGF219); composed after previous studies.7,13,22,23,24,25,26,27,28,29,30,31,32,33,34,35,36,37,38D: Validation of cloned probe DNA fragments in a known BWS-UPD case. There are no methylated LIT1 and no unmethylated H19 bands; methylation index (MI) = top band/sum approximates 0 and 1, respectively. NL, nonaffected individual; BWS, clinical diagnosis of BWS.
The BWS critical region at 11p15.5 can be divided into at least two functionally independent imprinting domains: a centromeric domain, DMR2 (TSSC3-KCNQ1) and a telomeric domain, DMR1 (INS-H19).14 Normally, at least two imprinting control regions [ICR, also referred to as differentially methylated regions (DMR)] regulate differential expression.12,13,48,49,50,51 In BWS, abnormal imprinting may result from a variety of defects including abnormal methylation (∼55%), paternal segmental uniparental disomy (UPD, ∼20%), mutations/microdeletions (<5%), and translocations of the maternal gene (<2%).22,23,51,52,53 With this heterogeneity of molecular aberrations, BWS poses significant challenges to the design and validation of diagnostic assays. Typically, molecular defects are identified in ∼2/3 of clinically characterized BWS patients reported in research studies.7,22,23,24,25,54 Several studies examined molecular detection in milder phenotypes42,43,45,46; however, detection rates in patients referred for molecular BWS testing (eg, rule out BWS) is to our knowledge unexplored. Thus, detection rates cited in reviews of BWS literature frequently refer to clinically well-characterized BWS patients derived from research-type settings.2,11,43,46,55,56 To systematically address BWS laboratory test performance, this study assessed molecular detection rates in the practice setting of a clinical molecular genetics laboratory.
One successful molecular diagnostic approach is detection of aberrant methylation of DMR2(LIT1) and/or DMR1(H19) via loss of imprinting (LOI) analysis.7,22,23,24,25 In the diagnostic setting we refer to these loci as LIT1 and H19 (Figure 1).7,13,14,15,16,17,18,19,20,21,22,23,24,25,26,27,28,29,30,31,32,33,34,35,36,37,38 The methylation status of these two functionally independent loci normally occurs in an inverse fashion (Figure 1C)7,13,14,15,16,17,18,19,20,21,22,23,24,25,26,27,28,29,30,31,32,33,34,35,36,37,38 and has been shown to be representative of regulatory control by the two major methylation domains.13,26,49,50,51,57,58 LIT1 is normally expressed only from the paternally inherited gene copy, and H19 is normally expressed only from the maternally inherited gene copy. Despite a high epigenotype-phenotype correlation of tumor risk associated with H19 hypermethylation status (inverse of IGF2), it is surprising that several clinical molecular laboratories only evaluate the hypomethylation status of LIT1 (GeneTests, http://www.ncbi.nlm.nih.gov/sites/GeneTests/?db=GeneTests, Copyright 1993–2010, University of Washington, Seattle, last accessed Feb 23, 2010). A negative test result may lead to a false diagnosis without recognition of the appropriate clinical context. Our main study objective was to review BWS test performance in the clinical practice setting, by comparing the diagnostic yield of LIT1 testing alone compared with combined LIT1/H19 assessment.
Furthermore, we have previously provided evidence for a potentially inadequate classification of UPD in BWS.7 In general, it is believed that combined LIT1/H19-methylation abnormalities are diagnostic of UPD. While this may be the case in the majority of patients, we have previously demonstrated LOI throughout the entire BWS-domains in the absence of UPD.7 Such multilocus methylation abnormalities/mutations require exclusion of UPD via combined testing of patient and parental DNA. Again, reports on frequencies in the practice setting are lacking. Therefore, an additional objective of the study is to determine the ratio of UPD and non-UPD in the practice samples with combined LIT1/H19 abnormalities.
To answer these questions, we use our experience from analysis of more than 1000 nationwide referrals for molecular testing received over an 8-year period and comparison with data from patients with BWS from the St. Louis Children's Hospital–Washington University School of Medicine BWS-registry. Our data emphasize the importance of combined LIT1/H19 assessment as well as availability of parental samples for UPD assessment when indicated. A low sensitivity of detection by molecular assays underscores the incomplete understanding of BWS disease biology and highlights the essential role of clinical diagnosis. The genomic Southern-based dataset presented here forms a large-scale reference point for new diagnostic approaches.
Materials and Methods
Patient Samples
This study includes analysis of a total of 1461 de-identified patients comprising 139 samples used for methylation threshold determination, 53 patients in the validation group, and 1269 consecutive referred samples in the practice group. In this report, we focus on detection rates and analytical aspects pertinent to molecular diagnostics and do not include epidemiological data, tumor incidence, follow-up, epigenotype-phenotype correlation, or other demographic characteristics.
Methylation threshold determination samples comprised two sets: replicates and controls. Replicates consisted of paired normal (age-matched) and abnormal DNA with known methylation status for H19 and LIT1.54 Four laboratory technologists assayed these samples as 30 and 32 replicates for LIT1 and H19 pairs (×2), respectively.54 Each pair was individually digested and hybridized (see below); the 124 results in 4 groups are referred to as R30/32 (Figure 2B). In addition to these 124 samples, fifteen unrelated, age-matched, nonaffected samples were assessed for each marker and formed the controls set; referred to as N15 (Figure, 2A and 2B). Control samples were derived from healthy age-matched controls, available from the initial phase of diagnostic testing associated with the BWS-registry.
Figure 2.
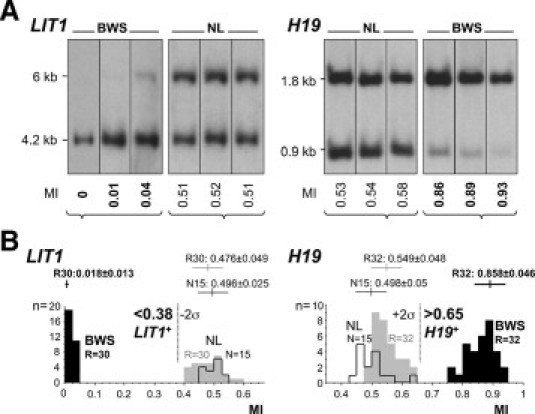
Threshold determination in BWS via methylation hybridization. A: Examples of autoradiographs from the validation group for the two loci. Absence of maternal methylation pattern is more obvious and complete in LIT1 when compared with the mostly incomplete hypermethylation of H19. Methylation index (MI) = top band/sum (see Materials and Methods) provided below. B: Based on the methylation indices for the validation group, diagnostic thresholds for the diagnosis of BWS were determined as <0.38 (LIT1) and >0.65 (H19), corresponding to mean control ± 2 σ (details see methods; P values provided in Table 3). NL, nonaffected individual; BWS, clinical diagnosis of BWS.
Validation group refers to 53 well-characterized and consented patients from the BWS Registry. Aiming at better understanding of the natural history and genetics of BWS, the registry was established in 1994 at the Genetic Epidemiology Branch of the National Cancer Institute by one of the authors (M.R.D.)7 and moved to the St. Louis Children's Hospital and Washington University School of Medicine in 1999 (Beckwith-Wiedemann Syndrome Registry, http://www.bws.wustl.edu/, last accessed Feb 23, 2010). Previously presented work established diagnostic criteria as well as compelling epigenotype-phenotype correlation in BWS, for example with respect to tumor risk7 (Table 1).
Table 1.
Proposed Tumor Risk Estimates for BWS and Molecular Subgroups
| Group | Overall | H19− | LIT1+ H19+ | LIT1− H19+ | LIT1− H19− |
|---|---|---|---|---|---|
| Estimated risk (%) | ∼7.5% | ∼2% | 25% | 35% | 10% |
| Reported range (%) | 4–21 | 1–5 | 25–30 | 35–45 | 10–15 |
Tumor risk correlates with H19-status; compiled from 2,4,6,8,10–12,23, 24,39,40,45,59.
Practice group refers to all consecutive samples from nationwide test referrals received over an 8.5-year period (January 2001 to June 2009, n = 1269) after exclusion of inconclusive test results. These 1245 samples (see results) include 149 ‘in-house’ patients (St. Louis Children's Hospital, Barnes-Jewish Hospital and affiliated hospitals, representing 12% of 1245) and 1096 referred patients (88%). Referral settings of the tests in the practice group were reviewed and analyzed for detection rates.
LIT1/H19 Methylation Assay
DNA isolation was performed from peripheral blood using the Puregene DNA Isolation Kit according to established protocols (Qiagen Inc., Valencia, CA).
Plasmid probe isolation was performed using subcloning efficiency competent cells DH5 α (Invitrogen # 44-0 098, Carlsbad, CA) and Qiagen Plasmid Maxi Prep (# 12143, Valencia, CA). Probes for H19 (CpG island) and LIT1 (EST592241) were used to isolate cloned human DNA fragments for Southern hybridization. The plasmids were digested with either Pst1/Sma1 or EcoR1/Xho1 for H19 for LIT1, respectively. Cloned Probe DNA fragments (750 bp LIT1; 1kb H19) were purified/isolated from plasmids using the QIAquick gel extraction system (Qiagen) and initial probe validation (assay development) was performed using previously tested samples (Figure 1D).7,13,14,15,16,17,18,19,20,21,22,23,24,25,26,27,28,29,30,31,32,33,34,35,36,37,38
Restriction endonuclease digestion of patient samples was performed using two double enzyme digestions of genomic DNA. Briefly, the DNA methylation status was determined using a 1.8-kb Pst1 fragment of the H19 CpG-island and a 6-kb BamHI fragment of the LIT1 CpG-island, which were each analyzed by digestion with the methylcytosine-sensitive restriction endonucleases Sma1 and Not1, respectively (New England Biolabs, Beverley, MA). To assure complete digestion, in the H19 reaction Pst1 and Sma1 restriction enzymes were added first as 10 U/μg of DNA and then a second addition of 10 U/μg of DNA (to “boost” the reaction) after at least 1.5–2 hours of incubation. The Sma1 digestion was incubated overnight at 25°C per manufacturer's instructions. Not1 (10U/μg DNA) and BamH1 (4U/μg DNA) enzymes were added together to the LIT1 reaction, which was incubated for at least 2 hours at 37°C. The H19 digestion products were recovered by ethanol precipitation before electrophoretic fragment separation.
Agarose Gel Electrophoresis and Southern Transfer of Genomic Digests
Fragments were separated on 1.5% (LIT1) or 2.5% (H19) agarose (SeaKem LE, cat. No. 50004; FMC Bioproducts, Rockland, ME) and transferred to Zetaprobe nylon membranes (Bio-Rad Laboratories, Hercules, CA) by a capillary transfer technique in 0.4 N NaOH. Because H19 fragments are small (1.8 and 0.9 kb, see below), only the LIT1 gel (6 and 4.2 kb) was depurinated with 0.03 N HCl before Southern transfer.
Hybridization and Autoradiography
Cloned probe DNA fragments [either the 1kb Pst1/Sma1 (H19) or the EST 592241 (LIT1)] were radiolabeled using random priming with [α-32P]dCTP and then incubated with membranes for approximately 16 hours with at 65°C or 62°C, respectively; membranes were subsequently washed and subjected to autoradiography. Every experiment in the practice group included the following reference materials: i) Negative control DNA (unaffected individual), ii) Positive control DNA (ie, validation group/BWS registry sample or previously tested positive samples), and iii) bacteriophage lambda DNA HindIII -digested size ladder (500 bp–24kb).
Quantification of signals followed previously published protocols.23,54,60 Briefly, signals from the autoradiographs were scanned and quantified using scientific imaging software (Kodak Digital Science 1D) and ImageJ (http://rsbweb.nih.gov/ij/, last accessed Feb 23, 2010). The intensities of the LIT1− (6 kb and 4.2 kb) and H19 bands (1.8 kb and 0.9 kb) bands were used to calculate methylation index values (MI) according to the following formula: MI = intensity top band/(intensity top band + intensity bottom band). Thus, the MI represents the fraction of methylated signals (Figure 2A).
Analysis of UPD in BWS followed previously established methods.7,23 Briefly, multiplex PCR analysis for UPD was performed when the proband's DNA showed abnormal LOI of both LIT1and H19 and samples were available from the affected individuals’ parents [validation group: 100% versus practice group: 329/1245 samples (∼26%) and 28/81 combined LIT1/H19-LOI samples (∼35%)]. Patient and parental genomic DNA was typed with a panel consisting of microsatellite markers7 [Figure 1A: validation group: D11S988, D11S1318, D11S922 (open circles); practice group: D11S1338, D11S1760, THO1 (filled circles)],7,13,14,15,16,17,18,19,20,21,22,23,24,25,26,27,28,29,30,31,32,33,34,35,36,37,38 amplified with fluorescently tagged (Cy5.5, forward) PCR primers (Table 2). Products were analyzed by capillary electrophoresis, and raw data were analyzed using Genescan and Genotyper software packages (Applied Biosystems). Peak profiles of parents and proband are compared to determine loss of maternal alleles consistent with paternal UPD. To differentiate between UPD and non-UPD in the setting of combined LIT1/H19 methylation abnormalities, parental samples (or least a maternal sample) are mandatory.
Table 2.
PCR Primers (UPD Analysis)
| Marker | Repeat | Primer sequence | Product Size (bp) |
|---|---|---|---|
| D11S1338 | CA | Forward 5′-GACGGTTTAACTGTATATCTAAGAC-3’ | 255–268 |
| Reverse 5′-TAATGCTACTTATTTGGAGTGTG-3’ | |||
| D11S1760 | CA | Forward 5′-GATCTCAAGTGTTTCCCCAC-3’ | 75–110 |
| Reverse 5′-AAACGATGTCTGTCCACTCA-3’ | |||
| D11S988 | CA | Forward 5′-CAGAAAATAGTTCAGACCACCA-3’ | 112–138 |
| Reverse 5′-GGGACAAGAGAAAGTTGAACA-3’ | |||
| D11S1318 | CA | Forward 5′-CCCGTATGGCAACAGG-3’ | 123–145 |
| Reverse 5′-TGTGCATGTNCATGAGTG-3’ | |||
| THO1 | AATG | Forward 5′-GTGGGCTGAAAAGCTCCCGATTAT-3’ | 179–203 |
| Reverse 5′-ATTCAAAGGGTATCTGGGCTCTGG-3’ | |||
| D11S922 | CA | Forward 5′-GGGGCATCTTTGGCTA-3’ | 88–138 |
| Reverse 5′-TCCGGTTTGGTTCAGG-3’ |
Markers are located along 11p; see Figure 1A.
Assay Development and Validation
We assessed range, distribution, variance, average, and SD within and between groups of the 2× R30/32 samples of the replicate set as well as in and between the control set (Figure 2B). Adjusted standard deviations for each locus were calculated to account for the inherent analytical imprecision (determined in the replicates) and the biological variability (determined in the controls). Therefore we adjusted the SD according to the following formula: σadj = √ [(σR30/32)2 + (σN15)2] adapted after61
σ = SD; adj = adjusted; R30/32 = replicates; N15 = controls.
Diagnostic threshold determination was performed using i) distribution of control and replicate samples determined here (R30/32; N15; Figure 2B), ii) previously reported MI from samples in the BWS registry,7,43 and ii) the adjusted standard deviations for H19 and LIT1. An average MI for normal plus 2 standard deviations (H19) and an average MI for normal minus 2 standard deviations (LIT1) included all of the affected individuals with abnormal MI (Figure 2B). Sensitivity of the assay was determined using the validation group. ‘Diagnostic yield’ was defined as assay sensitivity in relation to the methylated regions assessed, specifically LIT1 alone versus LIT1/H19 combined. We compared detection rates in the validation group and the practice group (Figure 3, A–C).
Figure 3.
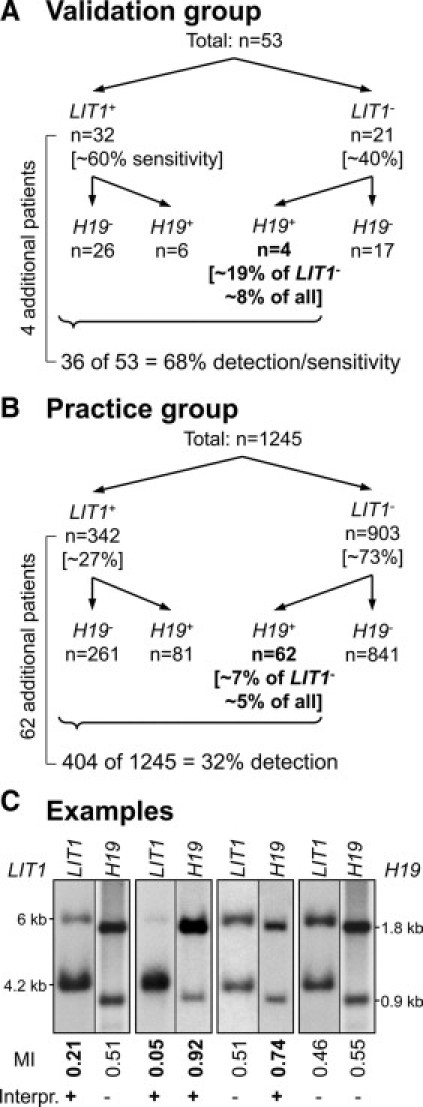
Addition of H19 increases diagnostic yield. A: In the validation group, the addition of H19-testing allows detection of four additional patients in the LIT1-normal group, which corresponds to ∼8% increased detection. B: In the practice group, the addition of H19 allows identification of 62 additional patients, missed by LIT1 testing alone. This corresponds to an overall ∼5% increased detection rate. C: Southern blot examples from the practice group illustrate the four possible band combinations and are shown as LIT1 and H19 combinations (although run as separate tests). The diagnostic interpretation (Interpr.) is provided under the methylation index (MI) = top band/sum (see Materials and Methods). +, abnormal; −, normal methylation.
Analytical variation and robustness was approximated by selection of positive control samples run at least six times (range, 6–16) during the last 2 years of the study (2007–2009). MIs for each of the five samples were compared as groups (n = 46 H19 and n = 54 LIT1), per sample (repetitive measurements), and via variances obtained during the threshold determination experiments. Controls from the last 75 runs were compared similarly and ‘new’ diagnostic thresholds were determined; robustness was assessed by comparison of these ‘new’ to the original MI threshold values.
Statistical testing includes two-tailed t-tests with Welch's correction for unequal variances, when appropriate. Gaussian distribution was confirmed via the D'Agostino-Pearson omnibus K2 normality test62 and we assessed homoscedasticity (homogeneity of variances) by F and Bartlett's tests.63,64 Statistical analysis was performed using Prism5 (GraphPad Software Inc., San Diego, CA), and P values of <0.05 were considered significant.
Results
The assay for LOI in BWS determines the methylation status of H19 and LIT1 by digestion with methylation sensitive restriction enzymes, followed by genomic Southern hybridization with DMR-specific probes. Nonaffected individuals (NL) show equally intense probe signals (Figure 1D, NL)7,13,14,15,16,17,18,19,20,21,22,23,24,25,26,27,28,29,30,31,32,33,34,35,36,37,38 equivalent to a MI of 0.5 (expressed as methylated fraction over total band intensities). In contrast, an abnormal methylation pattern (BWS) is characterized by absence of the maternal band at either one or both loci (Figure 1D, BWS).7,13,14,15,16,17,18,19,20,21,22,23,24,25,26,27,28,29,30,31,32,33,34,35,36,37,38 Probe validation using previously characterized samples showed appropriate performance. An example of a BWS patient with known UPD, confirmed by microsatellite analysis (not shown), illustrates the methylation pattern at LIT1 and H19 with inversely related MI values that approach 0 and 1, respectively (Figure 1D, BWS).
Diagnostic threshold determination for LIT1 and H19 followed previously published protocols.7,22,23,54 Distribution of MI (examples in Figure 2A) in this group, consisting of replicates and controls (Figure 2B), was used to determine the separation between normal and abnormal MI. The range of MI in the replicates was: LIT1-NL 0.4–0.59 versus LIT1-BWS 0–0.04 and H19-NL 0.48–0.64 versus H19-BWS 0.76–0.94. The range of MI in the controls was LIT1: 0.46−0.53 versus H19: 0.45–0.63. Frequency plots (distribution) and mean MI ± σ for these six groups is provided in Figure 2B. The differences in MI between NL and BWS were statistically highly significant: LIT1 R30 (n = 30 NL versus 30 BWS, P < 0.0001, t = 49.07) and H19 R32 (n = 32 NL versus 32 BWS, P < 0.0001, t = 26.26, two-tailed t-tests). Similarly, the differences between controls and BWS samples were statistically significant (H19 N15: P < 0.0001, t = 23.57; LIT1 N15: P < 0.0001, t = 68.54, two-tailed t-tests); for details see Table 3. To accurately estimate total variability, standard deviations of replicates and controls were adapted (see Materials and Methods) and the diagnostic threshold set to ± 2 σ of the normal MI for each locus. MI >0.65 for H19 and <0.38 for LIT1 are abnormal and are referred to as H19+ and LIT1+ (Figure 2B). These thresholds compare to those reported in the literature.7,22,23,24,25
Table 3.
Statistical Summary of Methylation Index Comparisons
| Comparison between | LIT1 | H19 |
|---|---|---|
| NL (Replicates) vs. BWS | P < 0.0001 | P < 0.0001 |
| CI: 0.439–0.477 | CI: 0.285–0.332 | |
| NL (Controls) vs. BWS | P < 0.0001 | P < 0.0001 |
| CI: 0.466–0.489 | CI: 0.33–0.389 | |
| NL (TD) vs. ‘new’ NL | P = 0.066 | P = 0.387 |
| CI: 0.0009–0.028 | CI: 0.026–0.066 | |
| BWS (TD) vs. ‘new’ BWS | P < 0.0001 | P = 0.55 |
| CI: 0.004−0.01 | CI: 0.057–0.11 |
P values (t-tests) and 95% confidence interval of the difference between selected groups (CI); see results for details. NL indicates nonaffected individual; BWS, clinical diagnosis of Beckwith-Wiedemann Syndrome; Replicates, 30(LIT1) and 32(H19) replicate pairs assessed by four laboratory technologists; Controls, 15 unrelated, unaffected samples; TD, threshold determination; ‘new,’ controls of the 75 most recent runs in the practice setting.
From an analytical perspective we determined normal distribution of MI (P range: 0.21–0.17; K2) and found equal variances within two (N30/32 versus BWS30/32; P range: 0.73–0.92, F test) or multiple groups (N30/32, N15, BWS; P range: 0.64–0.82 Bartlett's test). Unexpectedly, we noticed significantly different (analytical) variances when comparing between loci (LIT1 versus H19, P = 0.0064 NL; P = 0.002–0.004 F tests). The frequency plots of abnormally methylated LIT1 and H19 (black bars in Figure 2B; bin width 0.05) confirm this and illustrate i) almost complete demethylation of LIT1 versus ii) a higher proportion of incomplete hypermethylation of H19; these results have not only analytical but biological implications (see discussion).
Control DNA from cultured cells cannot be used as reference material because the methylation status is not maintained during cell culture conditions,7,27,65,66,67,68 thus we used separate reference materials (see Materials and Methods). We tested the robustness of the assay by comparison of variances of positive controls, taken from the last 2 years of the study period (P range: 0.07–0.21 Bartlett's test), as well as the simulated determination of ‘new’ methylation thresholds. When MIs were obtained from positive and negative controls in each of the 75 most recent runs [LIT1−: 0.462 ± 0.038; LIT1+: 0.011 ± 0.002; H19−: 0.518 ± 0.086; H19+: 0.833 ± 0.231] there was no significant deviation of these threshold values from the initially obtained values (t-test; Table 3), with the exception of LIT1+ samples that showed more complete hypomethylation averages (P < 0.001); ‘newly’ obtained threshold values are almost identical to those determined at the beginning of the study period: >0.69 for H19 and <0.386 for LIT1. These results confirm a substantial interrun and overall robustness of the assay.
Validation Group
All patients in the validation group were evaluated by two of the authors (M.R.D., A.P.F.) at the annual BWS Registry meeting in St. Louis and fulfilled previously published criteria.7 Briefly, each patient had a clinical diagnosis of BWS (made by a physician) with at least two of the five most common features associated with BWS,7,9,10 including macroglossia, birth weight and length >90th percentile, hypoglycemia in the first month of life, ear creases or ear pits, and midline abdominal wall defects (omphalocele, diastasis recti, or umbilical hernia). For clinical characteristics of the validation group we refer to our previously published case-cohort study.7 In addition to the well-established phenotypic traits, we specifically chose this subset of 53 patient samples because they comprised the original validation set for clinical testing.54 We determined the sensitivity of the assay by using the MI thresholds in the validation group (Figure 3A). Abnormal methylation for LIT1 was found in 32 of the 53 patients (LIT1 detection rate 60%). Testing for H19 in the validation group identified 10 patients with abnormal methylation, four of whom would have been labeled ‘negative’ based on LIT1 testing alone. Thus, H19 testing increases the overall sensitivity by 8% (combined LIT1 and H19 sensitivity 68%). Interestingly, the proportions of H19+ samples in the LIT1+ and LIT1-normal groups were equal (10%).
The six additional cases in this LIT1+ group represented paternal UPD inheritance [6/53; confirmed via parental samples (see below)] and 19% of the LIT1-normal patients had H19 abnormalities (4/21). Overall in this population, the occurrence of a single locus with aberrant methylation was found in 26 (49%) and 4 (7.5%) patients for LIT1 and H19, respectively. These proportions as well as the ∼11% UPD are in concordance with published findings in well-characterized patients with BWS7.22,23,24,25,54 In the validation group, we did not detect combined H19/LIT1-LOI in the absence of UPD, consistent with previous reports.7,24,26,69
Practice Group
First, we determined the technical/analytical sensitivity in practice by review of the inconclusive results (H19 n = 17; LIT1 n = 24) and found that insufficient quality or purification of DNA was one of the major reasons for these results (∼46% of inconclusive results). Other factors contributing to inconclusive results may be sample interference (ie, inhibiting endonuclease activity) or an undetermined factor. Based on the number of inconclusive test results from the practice group, the analytical sensitivity was determined to be 98.1% for LIT1 (1245/1269) and 98.6% for H19 (1252/1269), which further confirms the overall robustness of the assay. After exclusion of seven samples without LIT1 results, the practice group and final analysis was performed on the remaining 1245 patients’ samples.
Diagnostic yield of LIT1 testing and the addition of H19 testing were also determined in the practice group (Figure 3B); examples of Southern blots and MI for each of the four diagnostic groups are provided in Figure 3C. Of the 1245 patients we found abnormal methylation for LIT1 in 342. This LIT1-based detection rate of 27% is markedly lower than in the validation group (60%). Additional testing for H19 identified 143 abnormal patients, 62 of whom would have been labeled ‘negative’ based on LIT1 testing alone. Thus, addition of H19 testing increased the overall sensitivity by ∼5% (overall sensitivity: 32%), corresponding to a relative increase of 15.6% (5/32). In total, 7% of the LIT1 normal patients had H19 abnormalities (62/903) and the 81 additional cases in the LIT1+ group represent combined methylation abnormalities in H19 and LIT1 (6.6%). Combined methylation abnormalities of H19 and LIT1 either represent UPD or an imprinting disturbance extending throughout the 11p15 imprinted domains.7 Overall parental samples were available in ∼26% of the practice group (329/1245) and in 28 (35%) of the 81 combined H19/LIT1-abnormal samples.
In combined H19/LIT1-abnormal samples, assessment for UPD was performed whenever parental samples were available (n = 28). Lack of heterozygosity in any of the assessed alleles is considered noninformative, and we excluded six cases. Absence of peaks in the proband's traces that correspond to unique maternal peaks indicates loss of maternal alleles (consistent with paternal UPD), which we confirmed in 16 of the informative cases (73%). In 12 of these 16 cases consistent with paternal UPD, the proband's sample showed minimal evidence of maternal-specific peaks (<30% of the peak-height in comparison with paternal alleles70), which was interpreted as mosaicism (see Discussion). The remaining six informative cases showed either identical biparental allelic contribution (four cases) or minimal peak-height differences with <20% skewing7,70 (two cases). These findings exclude UPD in six of 22 informative cases (27%; this number excludes three previously reported cases7). Furthermore, cases that harbor LIT1 and H19 methylation mutations in the absence of UPD are diagnostic of multilocus methylation abnormalities that extend through both domains at 11p15.5.
Referral settings were analyzed to identify differences in detection rates. For 1213/1245 (97.4%) of the samples the referral setting was available; 32 samples had to be excluded from this analysis due to lack of specific information. First we determined the proportion of molecularly abnormal samples in the subgroup where the referral setting was known (392/1213) versus that observed in the entire practice group (404/1245) and found no statistically discernable difference (Fisher's exact test, P = 0.97). Next, we separated the referral settings into two groups: samples submitted from geneticists and designated genetics clinics in academic and non-academic settings were assigned to the ‘geneticist’ group. Samples submitted from private practice physicians or pediatricians, community hospitals, or other centers without designated genetics clinics/divisions were assigned to the ‘non-geneticist’ group (Table 4). Comparison of detection rates showed no significant difference of molecularly abnormal samples referred from the ‘geneticist’ group (313/971) versus the ‘non-geneticist’ group (79/242; χ2 = 0.015; Fisher's exact test P = 0.94).
Table 4.
Molecular Detection Rates by Referral Setting
| Practice group | ‘Geneticists’ | ‘Non-Geneticists’ | Σ |
|---|---|---|---|
| Abnormality detected | n = 313 | n = 79 | n = 392 |
| No molecular abnormality | n = 658 | n = 163 | n = 821 |
| Detection rate | 32.2% | 32.6% | 32.3% |
For explanation of ‘geneticists’ and ‘non-geneticists’ see Results and Discussion.
Discussion
We report the molecular detection rate for BWS in the practice setting with 1245 patients. LIT1 methylation testing alone was abnormal in 27% of samples, whereas combined assessment of H19 and LIT1 was abnormal in 32% of samples. Thus, 5% of children with an epigenotype that shows the highest tumor risk (H19) would be missed (false-negatives) using LIT1 LOI assessment alone. The sensitivity of the assay was determined in the validation group of 53 well-characterized patients with BWS and the result was abnormal in ∼60% of cases with LIT1 testing alone versus ∼68% of cases with combined H19/LIT1 assessment. These findings highlight the relatively low detection rate in both settings and thereby underscore the significant role of clinical diagnosis in patients with BWS (Figure, 4A and 4B). Furthermore, in the group of combined abnormal methylation status (H19/LIT1), we found UPD in 73% whereas UPD was excluded in 27%. Thereby we verify the existence of multilocus methylation mutations in the molecular diagnostic practice setting, which underscores the importance of assessment of UPD in addition to epigenetic testing in BWS.
Figure 4.
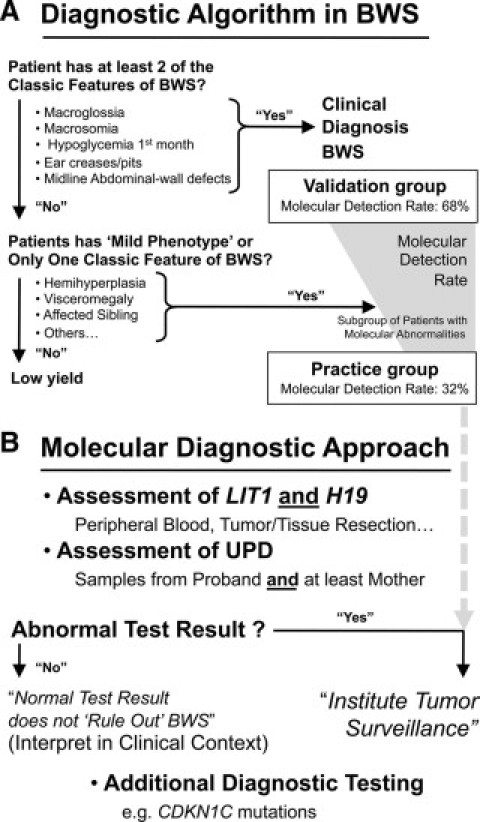
Diagnostic algorithm and molecular diagnostic approach in BWS. A: The diagnostic algorithm follows clinical (phenotypic) features and key examples are provided to illustrate the following interrelation: with decreasing clinical suspicion of BWS, the rate of molecular detection decreases; however, clinical variability or specific settings may trigger testing and confirm abnormal methylation in ‘mild phenotypes’ or hemihyperplasia6,41,42,43,44,45 (for comprehensive coverage of clinical features see Refs.7,8,9,10,59,71,72,73,74,75). As a visual estimate, the detection rates in the validation and practice group are provided (gray background). B: Epigenetic testing and assessment of uniparental disomy (UPD) should be combined, and the required samples are listed. Finally, the interpretation of the test result and institution of tumor surveillance procedures requires clinical correlation and additional diagnostic testing (eg, cytogenetics or CDKN1C sequencing).
Clinically, BWS can be separated into three major subgroups, familial, sporadic, and those with chromosome abnormalities.26,71 To account for differences in these subgroups (eg, higher rate of CDKN1C mutations in familial cases), and to decrease limitations associated with individual diagnostic methods, multimodal algorithms have been proposed.2,17 Knowing the limitations of molecular tests in these algorithms becomes paramount in the controversial context of prenatal testing or increased BWS rates in children conceived via some assisted reproductive technologies,47,76,77,78,79,80 especially because the phenotype cannot be ascertained prenatally. There is a need to diagnose the syndrome earlier, afford better counseling to the parents, and improve neonatal care of patients.81 However, in the absence of better molecular understanding of the disease biology, coupled with an absence of comprehensive diagnostic assays, BWS remains a clinical diagnosis. Thus, currently molecular testing may confirm the diagnosis but cannot rule it out2,82 (Figure 4B).
Implementation of epigenetic testing has expanded our toolkit for molecular confirmation; nonetheless one of the basic tenets in laboratory testing in BWS remains the assessment of UPD with its implications for genetic counseling83 and recurrence risk.84 Whenever possible, parental samples (or at least the maternal) should be obtained and submitted with the proband samples for epigenetic assessment. Paternal UPD in BWS is essentially always partial/segmental22,71,85,86,87,88,89 and somatically mosaic.22,23,89,90 This was confirmed by the presence of low-intensity maternal allele-peaks in the UPD-analysis, likely reflecting a low number of circulating lymphocytes that have both maternal and paternal alleles mixed with lymphocytes that are missing the maternal allele. Thus, mosaicism refers to the presence of paternal isodisomy (affecting at least a segment of 11p) in addition to a normal cell line,90 which has at least two practical implications. First, due to differential involvement of tissues, the true rate of UPD is likely higher than that reported here or elsewhere.11,23 Second, and importantly for genetic counseling, mosaicism in BWS indicates that UPD arises as a postzygotic event,72,90,91 which supports the empirically very low recurrence risk (approximating that of probands with affected siblings)2,69,84 and offers an explanation for the intriguing reports of monozygotic twin pairs discordant for BWS.92,93,94,95,96,97,98,99,100 In contrast, the exact recurrence risk in non-UPD BWS is unknown,7,11 but is likely low and cursorily mentioned as <5%101 (GeneTests, http://www.ncbi.nlm.nih.gov/sites/GeneTests/?db=GeneTests, Copyright 1993–2010, University of Washington, Seattle, last accessed Feb 23, 2010); exception CDKN1C mutations (see below). From a practical standpoint, abnormal imprinting in both domains may functionally reflect UPD and several studies have demonstrated such correlation.11,24 However, the inference that epigenetic testing is sufficient to assess UPD has to be put in perspective of our previous findings that 25% of cases with combined methylation abnormalities at H19 and LIT1 are not consistent with UPD by microsatellite analysis.7 Demonstration of a similar frequency (27% non-UPD in combined abnormal cases versus 73% UPD) in a larger series of patients suggests the existence of this molecular subgroup within the clinical genetics practice setting. The alterations are methylation abnormalities extending throughout the 11p15.5 domain.7 Underlying mechanisms, recurrence risk, and clinical significance of multilocus (‘coordinated’) methylation mutations remain to be determined. However, LOI at multiple maternally methylated loci, including loci outside of 11p15.5, has led to the proposal of a ‘maternal hypomethylation syndrome’ in BWS.102,103 Recently multilocus methylation defects with simultaneous loss of paternal and maternal imprinted loci has been demonstrated in BWS72; however, we were not able to review clinical features in our referred cases and can neither support nor refute a reported trend of tumor association in multilocus methylation defects.72 Including the phenotypic variation observed in genome-wide paternal UPD,70,104,105,106 the distinction of UPD from coordinate/multilocus methylation defects is more than an academic exercise and the extent of molecular abnormalities may determine the exact phenotype in BWS. Although the practical implications of multilocus methylation defects are uncharted, the assessment of UPD remains a cornerstone of genetic testing and counseling. Despite frequent elucidation in reviews, it is surprising that one practical aspect of BWS testing has not been emphasized strongly enough, namely the submission of parental samples. Specifically, the assessment of UPD requires microsatellite analysis that includes the proband and, at least, the mother.
Detection rates are related to diagnostic threshold cut-offs and the high-variability of the latter7,22,23,24,25,54 emphasizes the quality requirement for well-documented in-house validation.54 For instance, if thresholds as reported in the published literature were used (eg, H19: 0.50), at least seven of the fifteen normal controls would be falsely labeled as H19-positive. Because determination of diagnostic/MI-cut-off values also applies to newer methods discussed below, the importance of threshold determination and assay validation cannot be overemphasized. We recognized the critical importance of complete restriction endonuclease digestion from our prevalidation experience; the importance of complete capillary transfer of all sizes of DNA fragments during Southern blotting; and the optimization and standardization of specific radiolabeling, hybridization, autoradiography, and scanning conditions (see Materials and Methods).
In addition to analytical challenges, another reason H19 testing is not widely implemented may be biological. Epigenetic regulation of the DMR subdomains occurs independently,16,22,23,24,25,28,107 and while there is at least one imprinting center in the centromeric domain, there are at least three imprinting centers13,28,29,30 in the telomeric domain influencing H19/IGF2 expression (Figure 1B).7,13,16,17,18,19,20,21,22,23,24,25,26,27,28,29,30,31,32,33,34,35,36,37,38 This difference in organization may explain our findings of nearly complete demethylation of LIT1 (Figures, 2A and 2B, and 3C) whereas H19 is frequently incompletely hypermethylated (Figures 2B and 3C). Furthermore, despite reciprocal H19/IGF2-locus interdependence23,26,108,109,110 referred to as ‘CTCF enhancer competition model’,26,110,111,112 the complex organization in the telomeric domain may also explain biallelic IGF2 expression with normal H19 methylation.89,113,114 IGF2 is presumed to be one contributing element to the BWS overgrowth phenotype and accordingly, distinction between H19-dependent and -independent IGF2 expression has been made.22,23,26,31,110,113,114 H19-indepenent IGF2 expression has mostly been demonstrated in fibroblast cultures and maintenance of methylation pattern remains questionable.7,27,65,66,67,68 However, based on very few exceptions demonstrated in peripheral blood23,114 one may argue that addition of IGF2 testing may increase the diagnostic yield in BWS testing as well. We identified three substantial hindrances for the latter: i) There is a lack of polymorphic markers to determine uni- versus biallelic expression of IGF2 (unpublished observations). ii) To date, only a single study has combined H19/LIT1 and IGF2 testing21 and no IGF2 hypermethylation was observed when H19 imprinting was normal (>80 samples). Given the identical diagnostic yield of 68%21 and the rather high variability of IGF2 methylation assessment (personal communication, Dr. Andrea Riccio), IGF2 testing in routine diagnostics is not feasible. iii) Furthermore, conversion of IGF2 analysis from basic science into diagnostic practice is not straightforward because expression is restricted to particular tissues (eg, in tongue, kidney, placenta) and is absent in peripheral blood mononuclear cells which form the source of genomic DNA in the routine diagnostic setting.23,24,27,32,33,34,35,36,37,115 This leads to another reason for the difficulty with molecular assessment not only of H19 but BWS in general: blood cells are not involved in the BWS phenotype but used as a routine surrogate for diagnostic testing. While expression differences between blood and affected tissues is controversial for LIT1,24,25,26,69 we have previously shown that there is no difference in the frequency of increased H19 methylation when comparing BWS samples from lymphoctyes or BWS samples from fibroblasts.7 Thus, part of the low detection rate derives from our incomplete understanding of BWS genetics and how to transition the best targets into diagnostic practice. Our data specify the presence of a substantial number of LIT1-normal patients with H19 abnormalities, indicating that established targets should be used in a meaningful way.
The overall low detection rate in the practice setting with 27% (LIT1 testing alone) and 32% (combined LIT1/H19 testing) goes beyond the known limitations of molecular diagnostic testing in BWS and suggests other restrictions. For example, we know that the practice group is more heterogeneous because samples were submitted for various reasons (eg, “exclude BWS”) and testing was not refused based on the absence of published BWS criteria (eg, “atypical features,” “isolated hemihyperplasia”). In fact, individual ‘in house’ cases did not show the classic diagnostic features but had an abnormal methylation pattern. Although the clinical diversity of BWS has very recently been extended to include a neurobehavioral phenotype with genotype correlation,116 our samples were referred for testing before the description of these ‘new’ phenotypic features. In another approach to explain the substantially lower percentage of molecularly abnormal samples in the practice group, we compared detection rates based on referral setting and found no difference (Table 4). The distinction of referral setting is inexact and therefore a weak estimate for the influences of subspecialty expertise on detection rates. Due to limited availability, we did not review reasons for referral to a geneticist, reasons for molecular testing (for example, insurance coverage), or the fact that not all patients chose to be tested, which may introduce selection bias. However, because the authors were not involved in any of these decisions, ultimately selection of the practice group relied on clinical diagnostic judgment of the referring physicians, which fulfills the designation, ‘practice setting.’
Although the methods applied here are considered the ‘gold-standard’ in BWS molecular testing, some of the genomic Southern hybridization associated limitations are: technical difficulty, large quantities of required input DNA (∼10 μg), significant time commitment with extended turn-around-time, and high personnel cost. Furthermore, each locus must be analyzed separately and information about copy number cannot be reliably obtained. PCR-based methods overcome some of these limitations, and distinction of methylation status can be achieved via sodium bisulfite modification of the genomic DNA before PCR (methylation of cytosine conveys resistance to bisulfite treatment whereas unmethylated cytosines are deaminated to uracil). Methylation-specific PCR (MS-PCR) has been established in BWS diagnostics117 and other variations include combined bisulfite restriction assay (COBRA: bisulfite PCR+ restriction enzyme step),118 bisulfite pyrosequencing,119,120,121 or high-resolution melting analysis (HRM).122,123,124 Despite several advantages of these approaches, recently, methylation-sensitive multiplex ligation probe analysis (MS-MLPA) has been introduced and deemed the ‘platinum-standard.’ MS-MLPA can detect microdeletions, microduplications, alterations in gene dosage, as well as DNA methylation, including UPD.2,17,73 Notwithstanding these advantages, MS-MLPA-detection rates are similar to former standards and ∼78% in well-characterized patients with BWS.125 Therefore, none of the current methods, including those applied here, are able to replace a multimodal approach including detection of translocations/inversion via karyotyping and CDKN1C alterations by DNA sequencing.2 Cytogenetic abnormalities are observed in ∼1% (FISH: ∼2%) and CDKN1C mutations (occurring independent of H19/LIT122,38,46,52,69,126) have been described in 1–3% of sporadic and 5–10% of familial BWS.11,22,53 We are aware of at least three families (∼2%) in the 149 ‘in house’ patients with CDKN1C mutations. On the other hand, the recurrent theme in BWS testing is that ∼20% of well-characterized patients with BWS do not have currently-known molecular abnormalities at 11p15.5. Consequently, epigenetic alterations other than methylation have been proposed,26,113 and recently two new genes, NALP2127 and ZFP57,74 located on chromosomes 19q13.42 and 6p22.1, respectively, have been linked to BWS. Interestingly, these genetic abnormalities outside the 11p15.5 domains were restricted to individuals with LIT1 abnormalities,128,129 arguing that multilocus methylation abnormalities extend beyond 11p15.5 but also that current testing strategies capture these subgroups. Nonetheless, it remains to be determined to what extent new approaches may increase diagnostic sensitivity and how to explore the challenging group of molecularly negative patients with BWS.
Acknowledgements
We thank the patients and families who have participated in the BWS-registry and our colleagues for referral of analytical samples to our laboratory. Finally, we are very grateful for the expertise of Emily Niemitz who helped in early phases of the assay development and acknowledge Beverly Gibson, Jack Shields, Jeanne Anderson, Stephanie Adelsberger, Brooke Stroup, and Holly Simon for excellent technical assistance during the study period.
Footnotes
Supported by National Institutes of Health grant CA54358 (to A.P.F.).
Preliminary parts of this study have been presented at the Association of Molecular Pathology meeting in 2002 and 2009.
D.K.G. has been a consultant for Biomarin Pharmaceutical, Inc.
References
- 1.Beckwith JB: Extreme cytomegaly of the adrenal cortex, omphalocele, hyperplasia of kidneys and pancreas, and Leydig-cell hyperplasia: another syndrome? Abstract, Western Society for Pediatric Research 1963
- 2.Weksberg R, Shuman C, Beckwith JB. Beckwith-Wiedemann syndrome. Eur J Hum Genet. 2010;18:8–14. doi: 10.1038/ejhg.2009.106. [DOI] [PMC free article] [PubMed] [Google Scholar]
- 3.Wiedemann HR. [Familial Malformation Complex with Umbilical Hernia and Macroglossia–a “New Syndrome?”] J Genet Hum. 1964;13:223–232. [PubMed] [Google Scholar]
- 4.DeBaun MR, Tucker MA. Risk of cancer during the first four years of life in children from The Beckwith-Wiedemann Syndrome Registry. J Pediatr. 1998;132:398–400. doi: 10.1016/s0022-3476(98)70008-3. [DOI] [PubMed] [Google Scholar]
- 5.DeBaun MR, Siegel MJ, Choyke PL. Nephromegaly in infancy and early childhood: a risk factor for Wilms tumor in Beckwith-Wiedemann syndrome. J Pediatr. 1998;132:401–404. doi: 10.1016/s0022-3476(98)70009-5. [DOI] [PubMed] [Google Scholar]
- 6.Tan TY, Amor DJ. Tumour surveillance in Beckwith-Wiedemann syndrome and hemihyperplasia: a critical review of the evidence and suggested guidelines for local practice. J Paediatr Child Health. 2006;42:486–490. doi: 10.1111/j.1440-1754.2006.00908.x. [DOI] [PubMed] [Google Scholar]
- 7.DeBaun MR, Niemitz EL, McNeil DE, Brandenburg SA, Lee MP, Feinberg AP. Epigenetic alterations of H19 and LIT1 distinguish patients with Beckwith-Wiedemann syndrome with cancer and birth defects. Am J Hum Genet. 2002;70:604–611. doi: 10.1086/338934. [DOI] [PMC free article] [PubMed] [Google Scholar]
- 8.Elliott M, Bayly R, Cole T, Temple IK, Maher ER. Clinical features and natural history of Beckwith-Wiedemann syndrome: presentation of 74 new cases. Clin Genet. 1994;46:168–174. doi: 10.1111/j.1399-0004.1994.tb04219.x. [DOI] [PubMed] [Google Scholar]
- 9.Elliott M, Maher ER. Beckwith-Wiedemann syndrome. J Med Genet. 1994;31:560–564. doi: 10.1136/jmg.31.7.560. [DOI] [PMC free article] [PubMed] [Google Scholar]
- 10.Pettenati MJ, Haines JL, Higgins RR, Wappner RS, Palmer CG, Weaver DD. Wiedemann-Beckwith syndrome: presentation of clinical and cytogenetic data on 22 new cases and review of the literature. Hum Genet. 1986;74:143–154. doi: 10.1007/BF00282078. [DOI] [PubMed] [Google Scholar]
- 11.Weksberg R, Shuman C, Smith AC. Beckwith-Wiedemann syndrome. Am J Med Genet C Semin Med Genet. 2005;137C:12–23. doi: 10.1002/ajmg.c.30058. [DOI] [PubMed] [Google Scholar]
- 12.Rump P, Zeegers MP, van Essen AJ. Tumor risk in Beckwith-Wiedemann syndrome: a review and meta-analysis. Am J Med Genet A. 2005;136:95–104. doi: 10.1002/ajmg.a.30729. [DOI] [PubMed] [Google Scholar]
- 13.Reik W, Brown KW, Schneid H, Le Bouc Y, Bickmore W, Maher ER. Imprinting mutations in the Beckwith-Wiedemann syndrome suggested by altered imprinting pattern in the IGF2–H19 domain. Hum Mol Genet. 1995;4:2379–2385. doi: 10.1093/hmg/4.12.2379. [DOI] [PubMed] [Google Scholar]
- 14.Delaval K, Wagschal A, Feil R. Epigenetic deregulation of imprinting in congenital diseases of aberrant growth. Bioessays. 2006;28:453–459. doi: 10.1002/bies.20407. [DOI] [PubMed] [Google Scholar]
- 15.Delaval K, Feil R. Epigenetic regulation of mammalian genomic imprinting. Curr Opin Genet Dev. 2004;14:188–195. doi: 10.1016/j.gde.2004.01.005. [DOI] [PubMed] [Google Scholar]
- 16.Mitsuya K, Meguro M, Lee MP, Katoh M, Schulz TC, Kugoh H, Yoshida MA, Niikawa N, Feinberg AP, Oshimura M. LIT1, an imprinted antisense RNA in the human KvLQT1 locus identified by screening for differentially expressed transcripts using monochromosomal hybrids. Hum Mol Genet. 1999;8:1209–1217. doi: 10.1093/hmg/8.7.1209. [DOI] [PubMed] [Google Scholar]
- 17.Scott RH, Douglas J, Baskcomb L, Nygren AO, Birch JM, Cole TR, Cormier-Daire V, Eastwood DM, Garcia-Minaur S, Lupunzina P, Tatton-Brown K, Bliek J, Maher ER, Rahman N. Methylation-specific multiplex ligation-dependent probe amplification (MS-MLPA) robustly detects and distinguishes 11p15 abnormalities associated with overgrowth and growth retardation. J Med Genet. 2008;45:106–113. doi: 10.1136/jmg.2007.053207. [DOI] [PubMed] [Google Scholar]
- 18.Coffee AL, Kuehl TJ, Willis S, Sulak PJ. Oral contraceptives and premenstrual symptoms: comparison of a 21/7 and extended regimen. Am J Obstet Gynecol. 2006;195:1311–1319. doi: 10.1016/j.ajog.2006.05.012. [DOI] [PubMed] [Google Scholar]
- 19.Weber M, Hagege H, Murrell A, Brunel C, Reik W, Cathala G, Forne T. Genomic imprinting controls matrix attachment regions in the Igf2 gene. Mol Cell Biol. 2003;23:8953–8959. doi: 10.1128/MCB.23.24.8953-8959.2003. [DOI] [PMC free article] [PubMed] [Google Scholar]
- 20.Coffee B, Muralidharan K, Highsmith WE, Jr, Lapunzina P, Warren ST. Molecular diagnosis of Beckwith-Wiedemann syndrome using quantitative methylation-sensitive polymerase chain reaction. Genet Med. 2006;8:628–634. doi: 10.1097/01.gim.0000237770.42442.cc. [DOI] [PubMed] [Google Scholar]
- 21.Murrell A, Ito Y, Verde G, Huddleston J, Woodfine K, Silengo MC, Spreafico F, Perotti D, De Crescenzo A, Sparago A, Cerrato F, Riccio A. Distinct methylation changes at the IGF2–H19 locus in congenital growth disorders and cancer. PLoS One. 2008;3:e1849. doi: 10.1371/journal.pone.0001849. [DOI] [PMC free article] [PubMed] [Google Scholar]
- 22.Bliek J, Maas SM, Ruijter JM, Hennekam RC, Alders M, Westerveld A, Mannens MM. Increased tumour risk for BWS patients correlates with aberrant H19 and not KCNQ1OT1 methylation: occurrence of KCNQ1OT1 hypomethylation in familial cases of BWS. Hum Mol Genet. 2001;10:467–476. doi: 10.1093/hmg/10.5.467. [DOI] [PubMed] [Google Scholar]
- 23.Weksberg R, Nishikawa J, Caluseriu O, Fei YL, Shuman C, Wei C, Steele L, Cameron J, Smith A, Ambus I, Li M, Ray PN, Sadowski P, Squire J. Tumor development in the Beckwith-Wiedemann syndrome is associated with a variety of constitutional molecular 11p15 alterations including imprinting defects of KCNQ1OT1. Hum Mol Genet. 2001;10:2989–3000. doi: 10.1093/hmg/10.26.2989. [DOI] [PubMed] [Google Scholar]
- 24.Gaston V, Le Bouc Y, Soupre V, Burglen L, Donadieu J, Oro H, Audry G, Vazquez MP, Gicquel C. Analysis of the methylation status of the KCNQ1OT and H19 genes in leukocyte DNA for the diagnosis and prognosis of Beckwith-Wiedemann syndrome. Eur J Hum Genet. 2001;9:409–418. doi: 10.1038/sj.ejhg.5200649. [DOI] [PubMed] [Google Scholar]
- 25.Lee MP, DeBaun MR, Mitsuya K, Galonek HL, Brandenburg S, Oshimura M, Feinberg AP. Loss of imprinting of a paternally expressed transcript, with antisense orientation to KVLQT1, occurs frequently in Beckwith-Wiedemann syndrome and is independent of insulin-like growth factor II imprinting. Proc Natl Acad Sci USA. 1999;96:5203–5208. doi: 10.1073/pnas.96.9.5203. [DOI] [PMC free article] [PubMed] [Google Scholar]
- 26.Maher ER, Reik W. Beckwith-Wiedemann syndrome: imprinting in clusters revisited. J Clin Invest. 2000;105:247–252. doi: 10.1172/JCI9340. [DOI] [PMC free article] [PubMed] [Google Scholar]
- 27.Reik W, Constancia M, Dean W, Davies K, Bowden L, Murrell A, Feil R, Walter J, Kelsey G. Igf2 imprinting in development and disease. Int J Dev Biol. 2000;44:145–150. [PubMed] [Google Scholar]
- 28.Murrell A, Heeson S, Cooper WN, Douglas E, Apostolidou S, Moore GE, Maher ER, Reik W. An association between variants in the IGF2 gene and Beckwith-Wiedemann syndrome: interaction between genotype and epigenotype. Hum Mol Genet. 2004;13:247–255. doi: 10.1093/hmg/ddh013. [DOI] [PubMed] [Google Scholar]
- 29.Caspary T, Cleary MA, Perlman EJ, Zhang P, Elledge SJ, Tilghman SM. Oppositely imprinted genes p57(Kip2) and igf2 interact in a mouse model for Beckwith-Wiedemann syndrome. Genes Dev. 1999;13:3115–3124. doi: 10.1101/gad.13.23.3115. [DOI] [PMC free article] [PubMed] [Google Scholar]
- 30.Feil R, Walter J, Allen ND, Reik W. Developmental control of allelic methylation in the imprinted mouse Igf2 and H19 genes. Development. 1994;120:2933–2943. doi: 10.1242/dev.120.10.2933. [DOI] [PubMed] [Google Scholar]
- 31.Sperandeo MP, Ungaro P, Vernucci M, Pedone PV, Cerrato F, Perone L, Casola S, Cubellis MV, Bruni CB, Andria G, Sebastio G, Riccio A. Relaxation of insulin-like growth factor 2 imprinting and discordant methylation at KvDMR1 in two first cousins affected by Beckwith-Wiedemann and Klippel-Trenaunay-Weber syndromes. Am J Hum Genet. 2000;66:841–847. doi: 10.1086/302811. [DOI] [PMC free article] [PubMed] [Google Scholar]
- 32.Sullivan MJ, Taniguchi T, Jhee A, Kerr N, Reeve AE. Relaxation of IGF2 imprinting in Wilms tumours associated with specific changes in IGF2 methylation. Oncogene. 1999;18:7527–7534. doi: 10.1038/sj.onc.1203096. [DOI] [PubMed] [Google Scholar]
- 33.Cui H, Onyango P, Brandenburg S, Wu Y, Hsieh CL, Feinberg AP. Loss of imprinting in colorectal cancer linked to hypomethylation of H19 and IGF2. Cancer Res. 2002;62:6442–6446. [PubMed] [Google Scholar]
- 34.Eden S, Constancia M, Hashimshony T, Dean W, Goldstein B, Johnson AC, Keshet I, Reik W, Cedar H. An upstream repressor element plays a role in Igf2 imprinting. EMBO J. 2001;20:3518–3525. doi: 10.1093/emboj/20.13.3518. [DOI] [PMC free article] [PubMed] [Google Scholar]
- 35.Constancia M, Dean W, Lopes S, Moore T, Kelsey G, Reik W. Deletion of a silencer element in Igf2 results in loss of imprinting independent of H19. Nat Genet. 2000;26:203–206. doi: 10.1038/79930. [DOI] [PubMed] [Google Scholar]
- 36.Murrell A, Heeson S, Bowden L, Constancia M, Dean W, Kelsey G, Reik W. An intragenic methylated region in the imprinted Igf2 gene augments transcription. EMBO Rep. 2001;2:1101–1106. doi: 10.1093/embo-reports/kve248. [DOI] [PMC free article] [PubMed] [Google Scholar]
- 37.Constancia M, Hemberger M, Hughes J, Dean W, Ferguson-Smith A, Fundele R, Stewart F, Kelsey G, Fowden A, Sibley C, Reik W. Placental-specific IGF-II is a major modulator of placental and fetal growth. Nature. 2002;417:945–948. doi: 10.1038/nature00819. [DOI] [PubMed] [Google Scholar]
- 38.Smilinich NJ, Day CD, Fitzpatrick GV, Caldwell GM, Lossie AC, Cooper PR, Smallwood AC, Joyce JA, Schofield PN, Reik W, Nicholls RD, Weksberg R, Driscoll DJ, Maher ER, Shows TB, Higgins MJ. A maternally methylated CpG island in KvLQT1 is associated with an antisense paternal transcript and loss of imprinting in Beckwith-Wiedemann syndrome. Proc Natl Acad Sci USA. 1999;96:8064–8069. doi: 10.1073/pnas.96.14.8064. [DOI] [PMC free article] [PubMed] [Google Scholar]
- 39.Sotelo-Avila C, Gonzalez-Crussi F, Fowler JW. Complete and incomplete forms of Beckwith-Wiedemann syndrome: their oncogenic potential. J Pediatr. 1980;96:47–50. doi: 10.1016/s0022-3476(80)80322-2. [DOI] [PubMed] [Google Scholar]
- 40.Weng EY, Moeschler JB, Graham JM., Jr Longitudinal observations on 15 children with Wiedemann-Beckwith syndrome. Am J Med Genet. 1995;56:366–373. doi: 10.1002/ajmg.1320560405. [DOI] [PubMed] [Google Scholar]
- 41.Goldman M, Smith A, Shuman C, Caluseriu O, Wei C, Steele L, Ray P, Sadowski P, Squire J, Weksberg R, Rosenblum ND. Renal abnormalities in beckwith-wiedemann syndrome are associated with 11p15.5 uniparental disomy. J Am Soc Nephrol. 2002;13:2077–2084. doi: 10.1097/01.asn.0000023431.16173.55. [DOI] [PubMed] [Google Scholar]
- 42.Hoyme HE, Seaver LH, Jones KL, Procopio F, Crooks W, Feingold M. Isolated hemihyperplasia (hemihypertrophy): report of a prospective multicenter study of the incidence of neoplasia and review. Am J Med Genet. 1998;79:274–278. [PubMed] [Google Scholar]
- 43.Martin RA, Grange DK, Zehnbauer B, Debaun MR. LIT1 and H19 methylation defects in isolated hemihyperplasia. Am J Med Genet A. 2005;134A:129–131. doi: 10.1002/ajmg.a.30578. [DOI] [PubMed] [Google Scholar]
- 44.Shuman C, Smith AC, Steele L, Ray PN, Clericuzio C, Zackai E, Parisi MA, Meadows AT, Kelly T, Tichauer D, Squire JA, Sadowski P, Weksberg R. Constitutional UPD for chromosome 11p15 in individuals with isolated hemihyperplasia is associated with high tumor risk and occurs following assisted reproductive technologies. Am J Med Genet A. 2006;140:1497–1503. doi: 10.1002/ajmg.a.31323. [DOI] [PubMed] [Google Scholar]
- 45.Wiedemann HR. Tumors and hemihypertrophy associated with Wiedemann-Beckwith syndrome. Eur J Pediatr. 1983;141:129. [Google Scholar]
- 46.Cooper WN, Luharia A, Evans GA, Raza H, Haire AC, Grundy R, Bowdin SC, Riccio A, Sebastio G, Bliek J, Schofield PN, Reik W, Macdonald F, Maher ER. Molecular subtypes and phenotypic expression of Beckwith-Wiedemann syndrome. Eur J Hum Genet. 2005;13:1025–1032. doi: 10.1038/sj.ejhg.5201463. [DOI] [PubMed] [Google Scholar]
- 47.DeBaun MR, Niemitz EL, Feinberg AP. Association of in vitro fertilization with Beckwith-Wiedemann syndrome and epigenetic alterations of LIT1 and H19. Am J Hum Genet. 2003;72:156–160. doi: 10.1086/346031. [DOI] [PMC free article] [PubMed] [Google Scholar]
- 48.Bliek J, Gicquel C, Maas S, Gaston V, Le Bouc Y, Mannens M. Epigenotyping as a tool for the prediction of tumor risk and tumor type in patients with Beckwith-Wiedemann syndrome (BWS) J Pediatr. 2004;145:796–799. doi: 10.1016/j.jpeds.2004.08.007. [DOI] [PubMed] [Google Scholar]
- 49.Feil R. Epigenetics: ready for the marks. Nature. 2009;461:359–360. doi: 10.1038/461359a. [DOI] [PubMed] [Google Scholar]
- 50.Feil R. Epigenetic asymmetry in the zygote and mammalian development. Int J Dev Biol. 2009;53:191–201. doi: 10.1387/ijdb.082654rf. [DOI] [PubMed] [Google Scholar]
- 51.Li M, Squire JA, Weksberg R. Molecular genetics of Wiedemann-Beckwith syndrome. Am J Med Genet. 1998;79:253–259. [PubMed] [Google Scholar]
- 52.Lam WW, Hatada I, Ohishi S, Mukai T, Joyce JA, Cole TR, Donnai D, Reik W, Schofield PN, Maher ER. Analysis of germline CDKN1C (p57KIP2) mutations in familial and sporadic Beckwith-Wiedemann syndrome (BWS) provides a novel genotype-phenotype correlation. J Med Genet. 1999;36:518–523. [PMC free article] [PubMed] [Google Scholar]
- 53.Li M, Squire J, Shuman C, Fei YL, Atkin J, Pauli R, Smith A, Nishikawa J, Chitayat D, Weksberg R. Imprinting status of 11p15 genes in Beckwith-Wiedemann syndrome patients with CDKN1C mutations. Genomics. 2001;74:370–376. doi: 10.1006/geno.2001.6549. [DOI] [PubMed] [Google Scholar]
- 54.Timmerman RJ, DeBaun MR, Feinberg AP, Zehnbauer B. Establishing thresholds for assessing imprinting abnormalities in Beckwith-Wiedemann syndrome by methylation hybridization. J Mol Diagn. 2002;4:237A. [Google Scholar]
- 55.Riccio A, Sparago A, Verde G, De Crescenzo A, Citro V, Cubellis MV, Ferrero GB, Silengo MC, Russo S, Larizza L, Cerrato F. Inherited and Sporadic Epimutations at the IGF2–H19 locus in Beckwith-Wiedemann syndrome and Wilms' tumor. Endocr Dev. 2009;14:1–9. doi: 10.1159/000207461. [DOI] [PubMed] [Google Scholar]
- 56.Maher ER, Afnan M, Barratt CL. Epigenetic risks related to assisted reproductive technologies: epigenetics, imprinting. ART and icebergs? Hum Reprod. 2003;18:2508–2511. doi: 10.1093/humrep/deg486. [DOI] [PubMed] [Google Scholar]
- 57.Robertson KD. DNA methylation and human disease. Nat Rev Genet. 2005;6:597–610. doi: 10.1038/nrg1655. [DOI] [PubMed] [Google Scholar]
- 58.Li M, Squire JA, Weksberg R. Molecular genetics of Beckwith-Wiedemann syndrome. Curr Opin Pediatr. 1997;9:623–629. doi: 10.1097/00008480-199712000-00012. [DOI] [PubMed] [Google Scholar]
- 59.Schneid H, Vazquez MP, Vacher C, Gourmelen M, Cabrol S, Le Bouc Y. The Beckwith-Wiedemann syndrome phenotype and the risk of cancer. Med Pediatr Oncol. 1997;28:411–415. doi: 10.1002/(sici)1096-911x(199706)28:6<411::aid-mpo3>3.0.co;2-j. [DOI] [PubMed] [Google Scholar]
- 60.Reik W, Brown KW, Slatter RE, Sartori P, Elliott M, Maher ER. Allelic methylation of H19 and IGF2 in the Beckwith-Wiedemann syndrome. Hum Mol Genet. 1994;3:1297–1301. doi: 10.1093/hmg/3.8.1297. [DOI] [PubMed] [Google Scholar]
- 61.Meyer SL. Data analysis for scientists and engineers. Wiley; New York: 1975. p. 18. [Google Scholar]
- 62.D'Agostino RB, Stephens MA. Goodness-of-fit techniques. M. Dekker; New York: 1986. p. 390. [Google Scholar]
- 63.Bartlett M. Properties of sufficiency and statistical tests. Proceedings of the Royal Statistical Society. 1937;Series A:268–282. [Google Scholar]
- 64.Levene H. Robust tests for equality of variances. In: Olkin I., Ghurye SG, Hoeffding W, Madow WG, Mann HB, editors. Contributions to probability and statistics. Essays in honor of Harold Hotelling. Stanford University Press; Stanford, Carolina: 1960. pp. 278–292. [Google Scholar]
- 65.Schumacher A, Doerfler W. Influence of in vitro manipulation on the stability of methylation patterns in the Snurf/Snrpn-imprinting region in mouse embryonic stem cells. Nucleic Acids Res. 2004;32:1566–1576. doi: 10.1093/nar/gkh322. [DOI] [PMC free article] [PubMed] [Google Scholar]
- 66.Dean W, Bowden L, Aitchison A, Klose J, Moore T, Meneses JJ, Reik W, Feil R. Altered imprinted gene methylation and expression in completely ES cell-derived mouse fetuses: association with aberrant phenotypes. Development. 1998;125:2273–2282. doi: 10.1242/dev.125.12.2273. [DOI] [PubMed] [Google Scholar]
- 67.Szabo PE, Mann JR. Biallelic expression of imprinted genes in the mouse germ line: implications for erasure, establishment, and mechanisms of genomic imprinting. Genes Dev. 1995;9:1857–1868. doi: 10.1101/gad.9.15.1857. [DOI] [PubMed] [Google Scholar]
- 68.Olek A, Walter J. The pre-implantation ontogeny of the H19 methylation imprint. Nat Genet. 1997;17:275–276. doi: 10.1038/ng1197-275. [DOI] [PubMed] [Google Scholar]
- 69.Engel JR, Smallwood A, Harper A, Higgins MJ, Oshimura M, Reik W, Schofield PN, Maher ER. Epigenotype-phenotype correlations in Beckwith-Wiedemann syndrome. J Med Genet. 2000;37:921–926. doi: 10.1136/jmg.37.12.921. [DOI] [PMC free article] [PubMed] [Google Scholar]
- 70.Wilson M, Peters G, Bennetts B, McGillivray G, Wu ZH, Poon C, Algar E. The clinical phenotype of mosaicism for genome-wide paternal uniparental disomy: two new reports. Am J Med Genet A. 2008;146A:137–148. doi: 10.1002/ajmg.a.32172. [DOI] [PubMed] [Google Scholar]
- 71.Slavotinek A, Gaunt L, Donnai D. Paternally inherited duplications of 11p15.5 and Beckwith-Wiedemann syndrome. J Med Genet. 1997;34:819–826. doi: 10.1136/jmg.34.10.819. [DOI] [PMC free article] [PubMed] [Google Scholar]
- 72.Azzi S, Rossignol S, Steunou V, Sas T, Thibaud N, Danton F, Le Jule M, Heinrichs C, Cabrol S, Gicquel C, Le Bouc Y, Netchine I. Multilocus methylation analysis in a large cohort of 11p15-related foetal growth disorders (Russell Silver and Beckwith Wiedemann syndromes) reveals simultaneous loss of methylation at paternal and maternal imprinted loci. Hum Mol Genet. 2009;18:4724–4733. doi: 10.1093/hmg/ddp435. [DOI] [PubMed] [Google Scholar]
- 73.Bartholdi D, Krajewska-Walasek M, Ounap K, Gaspar H, Chrzanowska KH, Ilyana H, Kayserili H, Lurie IW, Schinzel A, Baumer A. Epigenetic mutations of the imprinted IGF2–H19 domain in Silver-Russell syndrome (SRS): results from a large cohort of patients with SRS and SRS-like phenotypes. J Med Genet. 2009;46:192–197. doi: 10.1136/jmg.2008.061820. [DOI] [PubMed] [Google Scholar]
- 74.Mackay DJ, Callaway JL, Marks SM, White HE, Acerini CL, Boonen SE, Dayanikli P, Firth HV, Goodship JA, Haemers AP, Hahnemann JM, Kordonouri O, Masoud AF, Oestergaard E, Storr J, Ellard S, Hattersley AT, Robinson DO, Temple IK. Hypomethylation of multiple imprinted loci in individuals with transient neonatal diabetes is associated with mutations in ZFP57. Nat Genet. 2008;40:949–951. doi: 10.1038/ng.187. [DOI] [PubMed] [Google Scholar]
- 75.Cytrynbaum CS, Smith AC, Rubin T, Weksberg R. Advances in overgrowth syndromes: clinical classification to molecular delineation in Sotos syndrome and Beckwith-Wiedemann syndrome. Curr Opin Pediatr. 2005;17:740–746. doi: 10.1097/01.mop.0000187191.74295.97. [DOI] [PubMed] [Google Scholar]
- 76.Fauque P, Ben Amor A, Joanne C, Agnani G, Bresson JL, Roux C. Use of trypan blue staining to assess the quality of ovarian cryopreservation. Fertil Steril. 2007;87:1200–1207. doi: 10.1016/j.fertnstert.2006.08.115. [DOI] [PubMed] [Google Scholar]
- 77.Gomes MV, Huber J, Ferriani RA, Amaral Neto AM, Ramos ES. Abnormal methylation at the KvDMR1 imprinting control region in clinically normal children conceived by assisted reproductive technologies. Mol Hum Reprod. 2009;15:471–477. doi: 10.1093/molehr/gap038. [DOI] [PubMed] [Google Scholar]
- 78.Maher ER, Brueton LA, Bowdin SC, Luharia A, Cooper W, Cole TR, Macdonald F, Sampson JR, Barratt CL, Reik W, Hawkins MM. Beckwith-Wiedemann syndrome and assisted reproduction technology (ART) J Med Genet. 2003;40:62–64. doi: 10.1136/jmg.40.1.62. [DOI] [PMC free article] [PubMed] [Google Scholar]
- 79.Gicquel C, Gaston V, Mandelbaum J, Siffroi JP, Flahault A, Le Bouc Y. In vitro fertilization may increase the risk of Beckwith-Wiedemann syndrome related to the abnormal imprinting of the KCN1OT gene. Am J Hum Genet. 2003;72:1338–1341. doi: 10.1086/374824. [DOI] [PMC free article] [PubMed] [Google Scholar]
- 80.Halliday J, Oke K, Breheny S, Algar E, Amor DJ. Beckwith-Wiedemann syndrome and IVF: a case-control study. Am J Hum Genet. 2004;75:526–528. doi: 10.1086/423902. [DOI] [PMC free article] [PubMed] [Google Scholar]
- 81.Reish O, Lerer I, Amiel A, Heyman E, Herman A, Dolfin T, Abeliovich D. Wiedemann-Beckwith syndrome: further prenatal characterization of the condition. Am J Med Genet. 2002;107:209–213. doi: 10.1002/ajmg.10143. [DOI] [PubMed] [Google Scholar]
- 82.Eggermann T, Schonherr N, Meyer E, Obermann C, Mavany M, Eggermann K, Ranke MB, Wollmann HA. Epigenetic mutations in 11p15 in Silver-Russell syndrome are restricted to the telomeric imprinting domain. J Med Genet. 2006;43:615–616. doi: 10.1136/jmg.2005.038687. [DOI] [PMC free article] [PubMed] [Google Scholar]
- 83.Kotzot D. Prenatal testing for uniparental disomy: indications and clinical relevance. Ultrasound Obstet Gynecol. 2008;31:100–105. doi: 10.1002/uog.5133. [DOI] [PubMed] [Google Scholar]
- 84.Chen H. Atlas of genetic diagnosis and counseling. Humana Press; Totowa NJ: 2006. p. 110. [Google Scholar]
- 85.Okano Y, Osasa Y, Yamamoto H, Hase Y, Tsuruhara T, Fujita H. An infant with Beckwith-Wiedemann syndrome and chromosomal duplication 11p13—-pter.: correlation of symptoms between 11p trisomy and Beckwith-Wiedemann syndrome. Jinrui Idengaku Zasshi. 1986;31:365–372. doi: 10.1007/BF01907937. [DOI] [PubMed] [Google Scholar]
- 86.Schinzel A. NICHD conference. Genomic imprinting: consequences of uniparental disomy for human disease. Am J Med Genet. 1993;46:683–684. doi: 10.1002/ajmg.1320460616. [DOI] [PubMed] [Google Scholar]
- 87.Waziri M, Patil SR, Hanson JW, Bartley JA. Abnormality of chromosome 11 in patients with features of Beckwith-Wiedemann syndrome. J Pediatr. 1983;102:873–876. doi: 10.1016/s0022-3476(83)80014-6. [DOI] [PubMed] [Google Scholar]
- 88.Weksberg R, Glaves M, Teshima I, Waziri M, Patil S, Williams BR. Molecular characterization of Beckwith-Wiedemann syndrome (BWS) patients with partial duplication of chromosome 11p excludes the gene MYOD1 from the BWS region. Genomics. 1990;8:693–698. doi: 10.1016/0888-7543(90)90256-t. [DOI] [PubMed] [Google Scholar]
- 89.Catchpoole D, Lam WW, Valler D, Temple IK, Joyce JA, Reik W, Schofield PN, Maher ER. Epigenetic modification and uniparental inheritance of H19 in Beckwith-Wiedemann syndrome. J Med Genet. 1997;34:353–359. doi: 10.1136/jmg.34.5.353. [DOI] [PMC free article] [PubMed] [Google Scholar]
- 90.Slatter RE, Elliott M, Welham K, Carrera M, Schofield PN, Barton DE, Maher ER. Mosaic uniparental disomy in Beckwith-Wiedemann syndrome. J Med Genet. 1994;31:749–753. doi: 10.1136/jmg.31.10.749. [DOI] [PMC free article] [PubMed] [Google Scholar]
- 91.Henry I, Puech A, Riesewijk A, Ahnine L, Mannens M, Beldjord C, Bitoun P, Tournade MF, Landrieu P, Junien C. Somatic mosaicism for partial paternal isodisomy in Wiedemann-Beckwith syndrome: a post-fertilization event. Eur J Hum Genet. 1993;1:19–29. doi: 10.1159/000472384. [DOI] [PubMed] [Google Scholar]
- 92.Berry AC, Belton EM, Chantler C. Monozygotic twins discordant for Wiedemann-Beckwith syndrome and the implications for genetic counselling. J Med Genet. 1980;17:136–138. doi: 10.1136/jmg.17.2.136. [DOI] [PMC free article] [PubMed] [Google Scholar]
- 93.Leonard NJ, Bernier FP, Rudd N, Machin GA, Bamforth F, Bamforth S, Grundy P, Johnson C. Two pairs of male monozygotic twins discordant for Wiedemann-Beckwith syndrome. Am J Med Genet. 1996;61:253–257. doi: 10.1002/(SICI)1096-8628(19960122)61:3<253::AID-AJMG9>3.0.CO;2-V. [DOI] [PubMed] [Google Scholar]
- 94.Litz CE, Taylor KA, Qiu JS, Pescovitz OH, de Martinville B. Absence of detectable chromosomal and molecular abnormalities in monozygotic twins discordant for the Wiedemann-Beckwith syndrome. Am J Med Genet. 1988;30:821–833. doi: 10.1002/ajmg.1320300316. [DOI] [PubMed] [Google Scholar]
- 95.Olney AH, Buehler BA, Waziri M. Wiedemann-Beckwith syndrome in apparently discordant monozygotic twins. Am J Med Genet. 1988;29:491–499. doi: 10.1002/ajmg.1320290304. [DOI] [PubMed] [Google Scholar]
- 96.Bose B, Wilkie RA, Madlom M, Forsyth JS, Faed MJ. Wiedemann-Beckwith syndrome in one of monozygotic twins. Arch Dis Child. 1985;60:1191–1192. doi: 10.1136/adc.60.12.1191. [DOI] [PMC free article] [PubMed] [Google Scholar]
- 97.Chien CH, Lee JS, Tsai WY, Wang TR. Wiedemann-Beckwith syndrome with congenital central hypothyroidism in one of monozygotic twins. J Formos Med Assoc. 1990;89:132–136. [PubMed] [Google Scholar]
- 98.Clayton-Smith J, Read AP, Donnai D. Monozygotic twinning and Wiedemann-Beckwith syndrome. Am J Med Genet. 1992;42:633–637. doi: 10.1002/ajmg.1320420440. [DOI] [PubMed] [Google Scholar]
- 99.Franceschini P, Guala A, Vardeu MP, Franceschini D. Monozygotic twinning and Wiedemann-Beckwith syndrome. Am J Med Genet. 1993;46:353–354. doi: 10.1002/ajmg.1320460327. [DOI] [PubMed] [Google Scholar]
- 100.Orstavik RE, Tommerup N, Eiklid K, Orstavik KH. Non-random X chromosome inactivation in an affected twin in a monozygotic twin pair discordant for Wiedemann-Beckwith syndrome. Am J Med Genet. 1995;56:210–214. doi: 10.1002/ajmg.1320560219. [DOI] [PubMed] [Google Scholar]
- 101.Engel E, Antonarakis SE. Genomic imprinting and uniparental disomy in medicine. Wiley-Liss, Inc.; New York: 2002. “Old” and “new” syndromes with uniparental disomy; pp. 133–162. [Google Scholar]
- 102.Mackay DJ, Hahnemann JM, Boonen SE, Poerksen S, Bunyan DJ, White HE, Durston VJ, Thomas NS, Robinson DO, Shield JP, Clayton-Smith J, Temple IK. Epimutation of the TNDM locus and the Beckwith-Wiedemann syndrome centromeric locus in individuals with transient neonatal diabetes mellitus. Hum Genet. 2006;119:179–184. doi: 10.1007/s00439-005-0127-4. [DOI] [PubMed] [Google Scholar]
- 103.Mackay DJ, Boonen SE, Clayton-Smith J, Goodship J, Hahnemann JM, Kant SG, Njolstad PR, Robin NH, Robinson DO, Siebert R, Shield JP, White HE, Temple IK. A maternal hypomethylation syndrome presenting as transient neonatal diabetes mellitus. Hum Genet. 2006;120:262–269. doi: 10.1007/s00439-006-0205-2. [DOI] [PubMed] [Google Scholar]
- 104.Bryke CR, Garber AT, Israel J: Evaluation of a complex phenotype in a unique patient with a paternal uniparental disomy for every chromosome cell line and a normal biparental inheritance cell line, American Society of Human Genetics 54th Annual Meeting 2004, Toronto, Canada
- 105.Giurgea I, Sanlaville D, Fournet JC, Sempoux C, Bellanne-Chantelot C, Touati G, Hubert L, Groos MS, Brunelle F, Rahier J, Henquin JC, Dunne MJ, Jaubert F, Robert JJ, Nihoul-Fekete C, Vekemans M, Junien C, de Lonlay P. Congenital hyperinsulinism and mosaic abnormalities of the ploidy. J Med Genet. 2006;43:248–254. doi: 10.1136/jmg.2005.034116. [DOI] [PMC free article] [PubMed] [Google Scholar]
- 106.Hoban PR, Heighway J, White GR, Baker B, Gardner J, Birch JM, Morris-Jones P, Kelsey AM. Genome-wide loss of maternal alleles in a nephrogenic rest and Wilms' tumour from a BWS patient. Hum Genet. 1995;95:651–656. doi: 10.1007/BF00209482. [DOI] [PubMed] [Google Scholar]
- 107.Feinberg AP. The two-domain hypothesis in Beckwith-Wiedemann syndrome. J Clin Invest. 2000;106:739–740. doi: 10.1172/JCI10911. [DOI] [PMC free article] [PubMed] [Google Scholar]
- 108.Rainier S, Johnson LA, Dobry CJ, Ping AJ, Grundy PE, Feinberg AP. Relaxation of imprinted genes in human cancer. Nature. 1993;362:747–749. doi: 10.1038/362747a0. [DOI] [PubMed] [Google Scholar]
- 109.Taniguchi T, Sullivan MJ, Ogawa O, Reeve AE. Epigenetic changes encompassing the IGF2/H19 locus associated with relaxation of IGF2 imprinting and silencing of H19 in Wilms tumor. Proc Natl Acad Sci USA. 1995;92:2159–2163. doi: 10.1073/pnas.92.6.2159. [DOI] [PMC free article] [PubMed] [Google Scholar]
- 110.Reik W, Maher ER. Imprinting in clusters: lessons from Beckwith-Wiedemann syndrome. Trends Genet. 1997;13:330–334. doi: 10.1016/s0168-9525(97)01200-6. [DOI] [PubMed] [Google Scholar]
- 111.Hark AT, Schoenherr CJ, Katz DJ, Ingram RS, Levorse JM, Tilghman SM. CTCF mediates methylation-sensitive enhancer-blocking activity at the H19/Igf2 locus. Nature. 2000;405:486–489. doi: 10.1038/35013106. [DOI] [PubMed] [Google Scholar]
- 112.Li X, Qiu Y, Shen Y, Ding C, Liu P, Zhou J, Ma Z. Splicing together different regions of a gene by modified polymerase chain reaction-based site-directed mutagenesis. Anal Biochem. 2008;373:398–400. doi: 10.1016/j.ab.2007.10.021. [DOI] [PubMed] [Google Scholar]
- 113.Joyce JA, Lam WK, Catchpoole DJ, Jenks P, Reik W, Maher ER, Schofield PN. Imprinting of IGF2 and H19: lack of reciprocity in sporadic Beckwith-Wiedemann syndrome. Hum Mol Genet. 1997;6:1543–1548. doi: 10.1093/hmg/6.9.1543. [DOI] [PubMed] [Google Scholar]
- 114.Brown KW, Villar AJ, Bickmore W, Clayton-Smith J, Catchpoole D, Maher ER, Reik W. Imprinting mutation in the Beckwith-Wiedemann syndrome leads to biallelic IGF2 expression through an H19-independent pathway. Hum Mol Genet. 1996;5:2027–2032. doi: 10.1093/hmg/5.12.2027. [DOI] [PubMed] [Google Scholar]
- 115.Weksberg R, Shen DR, Fei YL, Song QL, Squire J. Disruption of insulin-like growth factor 2 imprinting in Beckwith-Wiedemann syndrome. Nat Genet. 1993;5:143–150. doi: 10.1038/ng1093-143. [DOI] [PubMed] [Google Scholar]
- 116.Kent L, Bowdin S, Kirby GA, Cooper WN, Maher ER. Beckwith Weidemann syndrome: a behavioral phenotype-genotype study. Am J Med Genet B Neuropsychiatr Genet. 2008;147B:1295–1297. doi: 10.1002/ajmg.b.30729. [DOI] [PubMed] [Google Scholar]
- 117.Coffee B, Hjelm LN, DeLorenzo A, Courtney EM, Yu C, Muralidharan K. Characterization of an unusual deletion of the galactose-1-phosphate uridyl transferase (GALT) gene. Genet Med. 2006;8:635–640. doi: 10.1097/01.gim.0000237720.78475.fb. [DOI] [PubMed] [Google Scholar]
- 118.Xiong Z, Laird PW. COBRA: a sensitive and quantitative DNA methylation assay. Nucleic Acids Res. 1997;25:2532–2534. doi: 10.1093/nar/25.12.2532. [DOI] [PMC free article] [PubMed] [Google Scholar]
- 119.Dupont JM, Tost J, Jammes H, Gut IG. De novo quantitative bisulfite sequencing using the pyrosequencing technology. Anal Biochem. 2004;333:119–127. doi: 10.1016/j.ab.2004.05.007. [DOI] [PubMed] [Google Scholar]
- 120.Tost J, Gut IG. DNA methylation analysis by pyrosequencing. Nat Protoc. 2007;2:2265–2275. doi: 10.1038/nprot.2007.314. [DOI] [PubMed] [Google Scholar]
- 121.Tost J, Gut IG. Analysis of gene-specific DNA methylation patterns by pyrosequencing technology. Methods Mol Biol. 2007;373:89–102. doi: 10.1385/1-59745-377-3:89. [DOI] [PubMed] [Google Scholar]
- 122.Wojdacz TK, Dobrovic A, Algar EM. Rapid detection of methylation change at H19 in human imprinting disorders using methylation-sensitive high-resolution melting. Hum Mutat. 2008;29:1255–1260. doi: 10.1002/humu.20779. [DOI] [PubMed] [Google Scholar]
- 123.Wojdacz TK, Dobrovic A, Hansen LL. Methylation-sensitive high-resolution melting. Nat Protoc. 2008;3:1903–1908. doi: 10.1038/nprot.2008.191. [DOI] [PubMed] [Google Scholar]
- 124.Alders M, Bliek J, vd Lip K, vd Bogaard R, Mannens M. Determination of KCNQ1OT1 and H19 methylation levels in BWS and SRS patients using methylation-sensitive high-resolution melting analysis. Eur J Hum Genet. 2009;17:467–473. doi: 10.1038/ejhg.2008.197. [DOI] [PMC free article] [PubMed] [Google Scholar]
- 125.Priolo M, Sparago A, Mammi C, Cerrato F, Lagana C, Riccio A. MS-MLPA is a specific and sensitive technique for detecting all chromosome 11p15.5 imprinting defects of BWS and SRS in a single-tube experiment. Eur J Hum Genet. 2008;16:565–571. doi: 10.1038/sj.ejhg.5202001. [DOI] [PubMed] [Google Scholar]
- 126.Lew JM, Fei YL, Aleck K, Blencowe BJ, Weksberg R, Sadowski PD. CDKN1C mutation in Wiedemann-Beckwith syndrome patients reduces RNA splicing efficiency and identifies a splicing enhancer. Am J Med Genet A. 2004;127A:268–276. doi: 10.1002/ajmg.a.30020. [DOI] [PubMed] [Google Scholar]
- 127.Meyer E, Lim D, Pasha S, Tee LJ, Rahman F, Yates JR, Woods CG, Reik W, Maher ER. Germline mutation in NLRP2 (NALP2) in a familial imprinting disorder (Beckwith-Wiedemann Syndrome) PLoS Genet. 2009;5:e1000423. doi: 10.1371/journal.pgen.1000423. [DOI] [PMC free article] [PubMed] [Google Scholar]
- 128.Rossignol S, Steunou V, Chalas C, Kerjean A, Rigolet M, Viegas-Pequignot E, Jouannet P, Le Bouc Y, Gicquel C. The epigenetic imprinting defect of patients with Beckwith-Wiedemann syndrome born after assisted reproductive technology is not restricted to the 11p15 region. J Med Genet. 2006;43:902–907. doi: 10.1136/jmg.2006.042135. [DOI] [PMC free article] [PubMed] [Google Scholar]
- 129.Bliek J, Verde G, Callaway J, Maas SM, De Crescenzo A, Sparago A, Cerrato F, Russo S, Ferraiuolo S, Rinaldi MM, Fischetto R, Lalatta F, Giordano L, Ferrari P, Cubellis MV, Larizza L, Temple IK, Mannens MM, Mackay DJ, Riccio A. Hypomethylation at multiple maternally methylated imprinted regions including PLAGL1 and GNAS loci in Beckwith-Wiedemann syndrome. Eur J Hum Genet. 2009;17:611–619. doi: 10.1038/ejhg.2008.233. [DOI] [PMC free article] [PubMed] [Google Scholar]