

Abstract
Application of array comparative genomic hybridization (aCGH) has allowed an unprecedented high-resolution analysis of cancer genomes. We developed a custom genome-wide oligonucleotide microarray interrogating 493 genes involved in hematological disorders. We analyzed 55 patients with hematological neoplasms by using this microarray. In 33 patients with apparent normal conventional cytogenetic analysis, aneuploidy or isochromosomes were detected in 12% (4 of 33) of the patients by aCGH. The chromosomal changes included trisomy of chromosomes 10, 14, and 15, tetrasomy 11, and isochromosome 17q. In 17 patients with chronic lymphocytic leukemia who were initially investigated by using a panel of standard fluorescence in situ hybridization probes, additional copy number changes that were not interrogated by the fluorescence in situ hybridization (FISH) panel were detected in 47% (8 of 17) of the patients by aCGH. Important copy number changes included gain on 2p16 involving REL and BCL11A genes, rearrangements of chromosomes 8 and 15, and trisomy of chromosomes 19 and 22. In five patients with known abnormal karyotypes, aCGH identified the origin of two marker chromosomes and detected microdeletions at five breakpoints involved in three apparent balanced translocations. Our results suggest that a subset of potentially significant genomic alterations is missed by the currently available cytogenetic techniques. This pilot study clearly demonstrates high sensitivity of oligonucleotide aCGH for potential use in diagnosis and follow-up in patients with hematological neoplasms.
Array comparative genomic hybridization (aCGH) is one of the most significant technological developments in the molecular cytogenetics era. By comparing the fluorescence intensity of test DNA versus control DNA, aCGH enables the simultaneous testing of hundreds of loci for copy number differences with a resolution limited only by the space and density of probes placed on the array. The use of aCGH in research and diagnosis in postnatal genetics has led to the identification of many new microdeletion/microduplication syndromes and advanced our understanding of the molecular mechanisms behind many chromosomal aberrations.1,2,3
aCGH has also proved itself to be a powerful tool in cancer research. It has allowed global view of the cancer genome, a high-resolution regional analysis, thereby rapidly advancing our understanding of tumor biology. Recent discoveries in cancers by using aCGH technology have been reviewed by Kallioniemi4 and Costa et al.5 Significantly, aCGH has allowed for the discovery that a high fraction (80% to 92%) of apparent balanced translocations in prostate cancer cell lines are accompanied by focal copy number changes (CNCs),6 which may justify the application of aCGH even in cancers characterized by balanced translocation. Hematological cancers are characterized by specific chromosomal aberrations. The World Health Organization classification of tumors of hematopoietic and lymphoid tissues emphasizes the importance of the identification of the chromosome abnormalities for accurate diagnosis, appropriate treatment, and monitoring response to therapy.7 The emerging application of aCGH has improved the detection of chromosomal gains and losses. For example, a novel recurrent 9q34 duplication ranging from 3 to 11 Mb was identified in 33% of patients with pediatric T cell acute lymphoblastic leukemia (ALL) by aCGH.8 This is the most frequent cytogenetic abnormality observed in T cell ALL thus far.
The application of aCGH as a clinical tool in hematological cancers was first implemented by Schwaenen et al9 in 2004. This group developed a custom bacterial artificial chromosome (BAC) array targeting genes involved in chronic lymphocytic leukemia (CLL). They showed a high specificity and 100% sensitivity for cases with clonal abnormalities in >53% of the cell population by testing 106 CLL patients. Following their experience, our group and Gunn et al10,11 also developed a custom BAC array for CLL. Comparisons between aCGH analysis and a panel of fluorescence in situ hybridization (FISH) probes have demonstrated that aCGH analysis detects more CNCs and has better characterization of genomic alterations. Furthermore, aCGH detected additional abnormalities in ∼30% of patients compared with the standard FISH panel alone in our previous study using a CLL targeted BAC array.10 Similarly, Gunn et al11 used a whole genome BAC array and found 21% of patients showed significant genome wide alterations involving loci not interrogated by the CLL FISH panel. Nevertheless, a CLL-targeted BAC array does not contain genomic loci important in other hematological neoplasmas and BAC arrays have low sensitivity in detecting clonal chromosomal abnormalities when compared with oligonucleotide (oligo) arrays.
We hypothesized that a whole-genome oligo microarray would overcome the aforementioned limitations and could detect cryptic CNCs that are either small in size or low in frequency, thereby evading conventional cytogenetic assays. We report our experience in characterizing CNCs in hematological cancers by using a custom 44K whole-genome oligo microarray.
Materials and Methods
Patient Samples
A total of 55 bone marrow or blood samples from patients with hematological neoplasm that were received for karyotype and/or FISH analyses at the Medical Genetics Laboratories at Baylor College of Medicine were de-identified for microarray analysis. This study included 17 CLL samples irrespective of their FISH or chromosome results and 38 samples from other types of leukemia, including 33 with apparent normal karyotype and/or FISH results and five with known abnormal karyotypes. For CLL samples, B-cells were enriched first with the Rosette-Sep Human B-Cell Enrichment kit (category number 15064; StemCell Technologies, Vancouver, BC, Canada) following the manufacturer's protocol. Genomic DNA was then extracted from the enriched B-cells by using the Puregene Genomic DNA Purification Kit (Gentra, Minneapolis, MN). Genomic DNA from patients’ samples other than CLL was extracted from blood or bone marrow directly by using the Puregene DNA extraction kit according to the manufacturer's instructions.
Microarray Design
A custom genome-wide oligo microarray was designed by using the Agilent 44K platform. It specifically interrogates 497 genes (see Supplemental Table 1 at http://jmd.amjpathol.org) involved in carcinogenesis with evenly distributed probes mapped to each gene at an average spacing of 1 probe/10 kb or at least 10 probes/gene for genes less than 100 kb in size. The rest of the genome (backbone regions) was covered with evenly distributed probes, excluding regions containing highly repetitive elements, low copy repeats, and copy number polymorphisms (CNPs) annotated in public databases. Therefore, the average spatial resolution is 1 oligo probe/7.5 kb for disease gene regions and 1 oligo probe/78 kb for the backbone regions. The oligos were selected from the Agilent eArray system (Santa Clara, CA; hg18, March 2006). In total, 6627 probes cover the targeted genes, and 36,330 probes cover the backbone regions.
Array Comparative Genomic Hybridization
The procedures for DNA digestion, labeling, and hybridization for the oligo arrays were performed according to the manufacturer's instructions with minor modifications. Briefly, 1 μg of genomic DNA from patient and gender-matched reference samples were digested with AluI (10 units) and RsaI (10 units; Promega, Madison, WI) at 37°C for 2 hours. The labeling reaction was performed by using a custom reagents kit from PerkinElmer (Boston, MA) at 37°C for 2 hours in the presence of cyanine 5-dCTP (for the patient sample) or cyanine 3-dCTP (for the reference sample). Patient and reference DNA for each hybridization were purified, pooled, and incubated with human Cot-1 DNA, hybridization buffer, and blocking agent (Agilent Technologies, Santa Clara, CA). The labeled samples were hybridized for 20 to 24 hours at 65°C in a rotating hybridization oven by using microarray hybridization chamber and washed according to the manufacturer's protocol (Agilent Technologies).
Imaging and Data Analysis
The slides were scanned into image files by using an Agilent Microarray Scanner (PN G2565BA). The image files were quantified by using Agilent Feature Extraction software (version 10.5.1.1), and text file outputs from the quantification analysis were imported into the Agilent CGH Analytics software program and our custom-designed software. Our custom web-based software identified CNCs by first performing a segmentation analysis by using the circular binary segmentation algorithm12 to identify segmental events in the data. These segments were then postprocessed to remove spurious low intensity calls less than three oligos and to merge adjacent events. Additional filtering was performed to suppress segmental events less than 100 kb in nondisease associated regions. Second, a summary of the data in terms of “bins” was also performed. This summarization records the mean and variance of the oligos within fixed nondisjoint genomic intervals (bins) that span the region of the genome covered by the microarray, providing an additional check on the segmental analysis and a method to index into the data by using predefined name groupings (bins) that correspond to known landmarks in the genome. Third, all results were stored in a relational database that records both raw data and segmentation outcomes. The relational database tracks the curation and clinical review process, and provides access to historical results from all previous cases screened to provide a cross-reference for new patient results.
FISH Analysis
FISH analysis was performed by using standard methods on interphase and/or metaphase cells. Clinical probes used in the analysis were obtained from Vysis (Abbott Molecular, Des Plaines, IL) and included LSI BCR/ABL, LSI MYC, LSI IgH, and a panel of six probes for CLL samples (LSI MYB, LSI ATM, CEP 12, LSI D13S319, LSI LAMP1, and LSI TP53). Additional findings other than those detected by clinical FISH analysis were confirmed by using FISH probes localized in the altered chromosomal regions as previously described13 or centromere probes from Vysis. At least 200 interphase nuclei were scored for each probe and the number of abnormal nuclei was expressed as a percentage of the total number scored.
Results
Patients with Normal Conventional Cytogenetic Analysis
We hypothesized that aCGH could detect chromosomal changes occurring in small clonal populations that would be easily missed by conventional cytogenetic assays. We examined 32 patients with normal karyotype and/or FISH analyses. One patient (case 25) with a loss of X chromosome in 25% of the cells as a sole abnormality was also included in this category because this loss was likely caused by the aging process. Table 1 presents a comparison of aCGH results with the conventional cytogenetics results for these 33 patients. Overall, aCGH analysis detected large chromosomal changes in four patients (4 of 33 = 12%). No significant CNCs were identified in the remaining 29 cases.
Table 1.
Copy Number Changes Detected by aCGH in Patients with Normal Chromosome and/or FISH Analysis
| Case | Diagnosis | G-banding | FISH analysis | aCGH result | Gain/loss | Size (Mb) |
|---|---|---|---|---|---|---|
| 1 | AML | 46,XY[20] | nl | |||
| 2 | AML | 46,XX[20] | 17p13.3p11.2 (572,226–21,191,548)x1 | L | 20.62 | |
| 17q11.1q25.3 (22,335,132–78,089,216)x3 | G | 55.75 | ||||
| 3 | AML | 46,XY[20] | nl | |||
| 4 | CML | nl BCR/ABL | 14q11.2q32.33 (19,767,470–106,339,477)x3 | G | 86.57 | |
| 5 | CML | nl BCR/ABL | nl | |||
| 6 | ALL | 46,XY[20] | 10p15.3q26.3 (942,704–134,416,288)x3 | G | 133.47 | |
| 7 | ALL, MDS | 46,XY[20] | nl BCR/ABL | nl | ||
| 8 | MDS | 46,XY[20] | nl | |||
| 9 | MDS | 46,XY[20] | nl | |||
| 10 | CMML | 46,XY[20] | nl | |||
| 11 | CMML | 46,XY[14] | nl | |||
| 12 | MDS | 46,XX,inv(9) (p11q13)[20] | nl | |||
| 13 | MDS | 46,XX[20] | nl | |||
| 14 | MDS | 46,XX[20] | nl | |||
| 15 | MDS | 46,XX[20] | nl | |||
| 16 | MDS | 46,XY[20] | ||||
| 17 | MM | 46,XY[30] | nl | |||
| 18 | MM | 46,XX[20] | nl | |||
| 19 | MM | 46,XX[26] | nl MM FISH panel | nl | ||
| 20 | MM | 46,XY[30] | nl | |||
| 21 | MM | 46,XX[20] | nl | |||
| 22 | MM | 46,XY[20] | ||||
| 23 | MM | 46,XY[20] | nl MM FISH panel | |||
| 24 | MM | 46,XX[20] | ||||
| 25 | MM | 45,X,-X[5]/46,XX[15] | nl MM FISH panel | 11p15.5q25 (186,855–134,203,983)x3 | G | 134.02 |
| 15q11.2q26.3 (21,142,828–100,071,568)x3 | G | 78.93 | ||||
| Xp22.33q28 (2,886678–154,643,903)x1 | L | 151.76 | ||||
| 26 | Burkitt's like lymphoma staging | 46,XY[20] | nl Myc | nl | ||
| 27 | Large B-cell lymphoma | 46,XX[30] | nl | |||
| 28 | NHL, T-cell | 46,XY[40] | nl | |||
| 29 | NHL, B cell | 46,XY[25] | nl | |||
| 30 | NHL | 46,XX[20] | nl | |||
| 31 | NHL, T-cell | 46,XX[20] | nl | |||
| 32 | MPD | 46,XY[20] | nl | |||
| 33 | Essential thrombocythemia | 46,XY[20] | nl |
ALL, acute lymphoblastic leukemia; AML, acute myeloid leukemia; CML, chronic myeloid leukemia; CMML, chronic myelomonocytic leukemia; MDS, myeldysplastic syndrome; MPD, myeloid proliferative disorder; MM, multiple myeloma; NHL, non-Hodgkins Lymphoma; nl, normal; G, Gain; L, Loss.
Case 2 had a relapse for acute myeloid leukemia (AML) and presented with normal chromosome analysis. aCGH analysis identified a loss of 17p and a gain of 17q (Figure 1A). FISH analysis using probes from 17p and 17q showed that the loss of 17p and the gain of 17q were present in the same interphase nuclei in 57% of the cells examined. These results suggested the presence of an isochromosome composed of two copies of the long arm of chromosome 17 [i(17q)]. However, all of the metaphase cells examined had normal chromosome 17. It is possible that the abnormal cells failed to grow in vitro or the metaphases with abnormal chromosome 17 were too tight to analyze. AML with an isolated i(17q) may have features of mixed myelodysplastic syndrome (MDS)/myeloproliferative disorders.14
Figure 1.
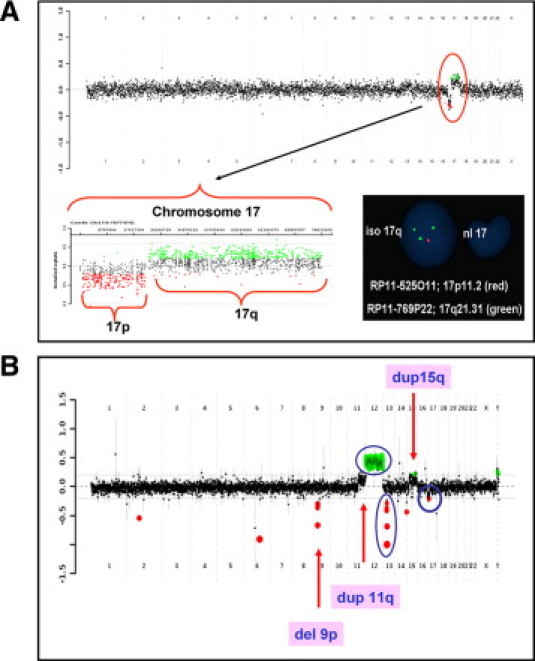
aCGH results for cases 2 and CLL-4. A: Case 2 was a patient with relapsed AML. The aCGH genome summary plot is shown in the top panel from chromosome 1 on the left and the sex chromosomes on the right. The black data points indicate no copy number change, the red indicates copy number loss, and the green indicates copy number gain. The copy number loss of 17p and gain of 17q is indicated by the red circle. The chromosome 17-specific plot is shown at the bottom left. The bottom right panel shows the FISH analysis with probe RP11–525O11 (red) and probe RP11–769P22 (green). Loss of 17p and gain of 17q were present in the same interphase nucleus suggesting the presence of an isochromosome 17. B: Case CLL-4. The aCGH genome summary plot shows multiple copy number changes. The findings that were consistent with the previous CLL FISH panel analysis (deletions of TP53 and 13q, and trisomy of chromosome 12) are indicated by the blue circles. Additional copy number changes detected by aCGH analysis are indicated by the arrows.
Case 4 had a relapse for chronic myelogenous leukemia (CML) and a negative FISH analysis for a BCR/ABL fusion probe. A gain of all of the chromosome 14-specific oligos was detected by aCGH analysis. FISH analysis confirmed trisomy 14 in 30% of the cells examined. Trisomy 14 has been observed in CML even after the disappearance of the Philadelphia chromosome.15,16
Case 6 was a newly diagnosed ALL patient with normal chromosome analysis. aCGH analysis revealed a gain in copy number detected by all of the chromosome 10-specific oligos that was suggestive of low-level mosaicism for trisomy 10. FISH analysis confirmed trisomy 10 in 14.5% of the cells examined. Trisomy 10 as a sole abnormality has been associated with good prognosis in pediatric ALL and fair prognosis in adult acute nonlymphocytic leukemia.17
Case 25 had a relapse for multiple myeloma (MM) with chromosome analysis showing 45,X,-X[5]/46,XX[15] and normal FISH analysis for the MM panel. Subtle gains of chromosomes 11- and 15-specific oligos and loss of the X chromosome specific-oligos were detected by aCGH analysis. FISH analysis showed tetrasomy 11, trisomy15, and monosomy X in 10%, 7%, and 9% of the cells, respectively. Gain of chromosome 15, loss of an X chromosome, and trisomy, tetrasomy, or partial gain of chromosome 11 are among the most common abnormalities observed in MM,18,19 although these regions are not usually covered by the FISH panel performed in most laboratories.
CLL Patients
We previously demonstrated that BAC aCGH analysis detected additional chromosomal changes in CLL patients in regions that were not interrogated by a CLL FISH panel.10 We hypothesized that the oligo microarray would be more sensitive in identifying additional chromosomal changes than a BAC microarray. Seventeen patients with CLL were examined in this study and all were initially evaluated by using the CLL FISH panel. Five of 17 patients had negative FISH results (CLL-3, 12, 13, 15, and 17), whereas 12 patients were positive for at least one locus (Table 2). In addition, three patients (CLL-1, 2, and 8) had concurrent abnormal karyotypes, whereas the remaining 14 did not have chromosome studies.
Table 2.
Comparison of Chromosomal Abnormalities Detected by Conventional Cytogenetic Assays and aCGH in CLL Samples
| Case | G-banding | CLL FISH panel | aCGH result | Gain/loss | Size (Mb) | Comparison |
|---|---|---|---|---|---|---|
| CLL-1 | 46,XY,del(11)(q13q23), del(13)(q14q22)[3]/46,XY[27] | nuc ish(ATMx1)[212/500] | 2p16.1p15(58,239,976–63,119,015)x3 | G | 4.88 | Additional finding |
| nuc ish(D13S319x1)[224/500] | 11q21q24.2(95,824,986–123,972,410)x1 | L | 28.15 | Consistent | ||
| 13q14.2q22.2 (46,457,567–75,032,954)x1 | L | 28.58 | Consistent | |||
| CLL-2 | 46,XY,der(7)t(7;12) (p13;q13),del(11) (q13q23)[6]/46,XY[38] | nuc ish(ATMx1)[395/500] | 7p22.3p14.3(298,857–32,463,740)x1 | L | 32.17 | Consistent |
| 11q14.1q23.2(78,505,139–114,526,789)x1 | L | 36.02 | Consistent | |||
| 12q15q24.33 (66,153,647–132,274,021)x3 | G | 66.12 | Consistent | |||
| CLL-3 | Negative | No copy number gain or loss | Consistent | |||
| CLL-4 | nuc ish(CEP12x3)[119/500] | 9p21.3p21.2(20,141,095–25,769,281)x1 | L | 5.63 | Additional finding | |
| nuc ish(D13S319x0)[113/500] | 11q13.4q25(74,235,693–134,203,983)x3 | G | 59.97 | Additional finding | ||
| nuc ish(TP53x1)[27/500] | 12p13.33q24.33(59,839–132,274,021)x3 | G | 132.21 | Consistent | ||
| 13q14.2q14.3 (47,634,299–50,360,303)x1 | L | 2.73 | Consistent | |||
| 15q15.2q22.2(40,843,438–61,125,198)x3 | G | 20.28 | Additional finding | |||
| 15q22.2q22.32(61,203,747–63,277,549)x1 | L | 2.073 | Additional finding | |||
| 15q22.32q26.3(63,349,209–97,997,129)x3 | G | 34.65 | Additional finding | |||
| 17p13.3p11.2 (572,226–16,467,786)x1 | L | 15.89 | Consistent | |||
| CLL-5 | nuc ish(D13S319x1)[80/500] | 1q25.2(176,463,562–177,342,180)x1 | L | 0.88 | Additional finding | |
| 13q14.2q14.3(48,811,812–51,260,640)x1 | L | 2.45 | Consistent | |||
| 17q11.2(25,206,771–27,341,867)x1 | L | 2.14 | Additional finding | |||
| CLL-6 | nuc ish(D13S319x1)[79/200] | 4q21.21q34.1(80,064,046–175,930,298)x3 | G | 95.87 | Additional finding | |
| 11q25 (130,802,834–133,537,033)x1 | L | 2.73 | Additional finding | |||
| 13q14.3(49,556,169–50,302,345)x1 | L | 0.75 | Consistent | |||
| CLL-7 | nuc ish(D13S319x1)[313/500] (D13S319x0)[146/500] | 13q14.12q21.33 (45,186,614–68,407,441)x1 | L | 23.22 | Consistent | |
| CLL-8 | 47,XY,+12[3]/46,XY[1] | nuc ish(CEP12x3)[130/200] | 8p23.3p23.1(510,912–12,646,458)x1 | L | 12.14 | Additional finding |
| nuc ish(TP53x1)[69/200] | 8q22.1q24.3(94,588,642–146,024,209)x3 | G | 51.44 | Additional finding | ||
| 12p13.33q24.33(59,839–132,274,021)x3 | G | 132.21 | Consistent | |||
| Not detected | ||||||
| CLL-9 | nuc ish(ATMx1)[106/200] | 2p25.3p11.2 (56,097–86,913,786)x3 | G | 86.86 | Additional finding | |
| nuc ish(D13S319x1)[122/200] | 8q24.13(125,141,042–126,067,964)x1 | L | 0.93 | Additional finding | ||
| 11q21q23.2(95,896,516–116,055,830)x1 | L | 20.16 | Consistent | |||
| 13q14.2q14.3 (47,747,097–50,570,768)x1 | L | 2.82 | Consistent | |||
| CLL-10 | nuc ish(D13S319x1)[105/200] (D13S319x0)[22/200] | 13q14.3 (49,393,673–50,360,303)x1 | L | 0.97 | Consistent | |
| CLL-11 | nuc ish(ATMx1)[188/200] | 11q14.1q23.3(82,248,677–116,410,246)x1 | L | 34.16 | Consistent | |
| nuc ish(D13S319x1)[176/200] | 13q14.3(49,393,673–50,428,576)x1 | L | 1.04 | Consistent | ||
| CLL-12 | Negative | No copy number gain or loss | Consistent | |||
| CLL-13 | Negative | No copy number gain or loss | Consistent | |||
| CLL-14 | nuc ish(CEP12x3)[140/300] | 12p13.33q24.33(59,839–132,274,021)x3 | G | 132.21 | Consistent | |
| nuc ish(D13S319x1)[141/300] | 13q14.3(49,488,278–50,308,235)x1 | L | 0.82 | Consistent | ||
| 19p13.3q13.43(588,365–62,792,815)x3 | G | 62.20 | Additional finding | |||
| 22q11.1q13.33(15,659,961–49,270,055)x3 | G | 33.61 | Additional finding | |||
| CLL-15 | Negative | 2q36.3q37.1(230,519,517–231,293,094)x1 | L | 0.77 | Additional finding | |
| CLL-16 | nuc ish(D13S319x1)[147/200] | 13q14.3 (49,393,673–50,506,276)x1 | L | 1.11 | Consistent | |
| CLL-17 | Negative | No copy number gain or loss | ||||
| Total abnormal event | Combined: 21 | 37 |
G, gain; L, loss.
In total, traditional cytogenetics assays detected 21 abnormal events with an average of 1.2 abnormalities/sample, whereas aCGH detected 37 events with an average of 2.2 abnormalities/sample (Table 2). Therefore, aCGH analysis detected 76% more abnormalities compared with conventional cytogenetic assays in these CLL patients. These extra CNCs were found in 47% (8 of 17) of the CLL patients.
In five patients with negative CLL FISH panel results, four (CLL-3, 12, 13, and 17) were also normal by aCGH analysis. One patient, CLL-15, had a loss of ∼0.8 Mb on chromosome 2q36.3q37.1 (hg18: chr2:230,519,517 to 231,293,094). This region has been reported to harbor a CLL susceptible locus, the SP140 gene by a genome wide association study.20
In 12 patients with a positive CLL FISH panel and/or chromosome analysis, all of the abnormalities were confirmed by aCGH except a deletion including TP53 gene identified by the FISH panel in case CLL-8. Fifteen additional CNCs were identified in these patients and were divided into three groups according to their size: microdeletions/microduplications ≤10 Mb in size; partial aneuploidies >10 Mb in size; and whole chromosome aneuploidies. Moreover, of five patients with 13q14 deletion as a sole abnormality by the CLL FISH panel (CLL-5, 6, 7, 10, and 16), two (CLL-5 and 6) showed additional chromosomal changes by aCGH analysis.
Microdeletions and Microduplications ≤10 Mb in Size
In five of 12 CLL patients with abnormal FISH results, seven additional small CNCs ranging from 0.88 to 5.63 Mb were identified by aCGH analysis: six microdeletions in four patients (CLL-4, 5, 6, and 9) and a microduplication in CLL-1 (Table 2). Although the chromosomal regions involved in the losses on chromosomes 9p21.3 (CLL-4), 1q25 (CLL-5), 17q11.2 (CLL-5), 11q25 (CLL-6), and 8q24 (CLL-9) have been observed in hematological malignancies, the diagnostic and prognostic values of these regions in CLL are not clear.21,22,23,24,25,26,27,28
In CLL-1, in addition to the deletions on 11q23 and 13q14 identified by both FISH and aCGH analyses, aCGH also identified a gain of 4.88 Mb at 2p16. This microduplication encompasses the REL and BCL11A oncogenes, which have been implicated in CLL pathogenesis.29 Gain of 2p16 has also been associated with disease progression and poor prognosis together with TP53 deletion or independently.30,31
Partial Aneuploidies (>10 Mb)
In four of 12 CLL patients with abnormal FISH results, aCGH detected seven additional partial aneuploidies ranging from 12.14 to 95.87 Mb. Three gains were identified in CLL-4, one gain was present each in CLL-6, 8, and 9, and a loss was seen in CLL-8 (Table 2).
aCGH analysis of CLL-4 was consistent with the FISH analysis in the detection of trisomy 12, and deletions of 13q14 and TP53. In addition, aCGH identified a loss of 5.63 Mb at 9p21.3, a gain of ∼60 Mb at 11q13.4q25, two gains of ∼20 Mb at 15q15.2q22.2, and 34.65 Mb at 15q22.3-q26.3, which were separated by a loss of 2.1 Mb at 15q22.2 (Figure 1B). The gain on 11q was initially missed by CLL FISH panel, most likely due to its low percentage. Retrospectively, it was seen in 9% of the cells by FISH analysis. The multiple CNCs on chromosome 15 suggested complex rearrangements occurring on this chromosome, which may be associated with disease progression.
aCGH analysis of CLL-8 showed a loss of 8p23 and a gain of 8q22, in addition to the trisomy 12 identified by both FISH and aCGH analyses. Loss of 8p with concomitant gain of 8q of variable sizes has been observed frequently in CLL patients with 17p loss, and possibly contributes to the poor prognosis seen in CLL patients with 17p loss.32
Whole Chromosome Aneuploidies
Whole chromosome aneuploidy was detected in one of 12 CLL patients (CLL-14) with abnormal FISH results. CLL FISH panel analysis revealed trisomy 12 and deletion of chromosome 13q14. In addition to these CNCs, aCGH analysis also identified copy number gains of all of the chromosome 19- and 22-specific oligos. FISH analysis confirmed trisomy 19 and trisomy 22 in 31% and 43% of the cells examined, respectively. Trisomy 19 has been seen in CLL patients with trisomy 12 and associated with unmutated IGHV genes.33 Trisomy 22 has been rarely reported in CLL patients and it is most likely a secondary change.34
Patients with Abnormal Cytogenetic Results
aCGH has the ability to detect cryptic chromosomal changes and identify the origin of marker chromosomes. We hypothesized that aCGH could provide more prognostic information even in patients with abnormal chromosomal analysis. We examined five non-CLL patients with known abnormal karyotypes by using this microarray (Table 3). aCGH analysis was consistent with the chromosomal analysis in one case (case 36) and identified additional CNCs in the remaining cases (cases 34, 35, 37, and 38).
Table 3.
Comparison of Chromosomal Abnormalities by G-banding and aCGH in Patients with Abnormal Chromosome Analysis
| Case | Diagnosis | G-banding | aCGH result | Gain/loss | Size (Mb) |
|---|---|---|---|---|---|
| 34 | MDS | 47,XX,inv(3)(q21q26),+mar[11]/46,idem,−7[9] | 7p22.3p11.2(298,857–55,919,771)x1 | L | 55.62 |
| 7q21.3q36.3(96,594,808–157,971,923)x1 | L | 61.38 | |||
| 21q11.2q22.3(14,368,782–46,849,389)x3 | G | 42.48 | |||
| 35 | NHL-B | 46,XX,t(2;6)(q35;q22), t(2;8)(p23;q22)[6]/46,XX[14] | 2p24.1p23.3(21,383,469–25,775,618)x1 | L | 4.39 |
| 2q24.1q24.2(159,552,315–161,744,411)x1 | L | 2.19 | |||
| 2q34q35(213,240,662–216,784,097)x1 | L | 3.54 | |||
| 6q14.1(79,250,463–82,699,602)x1 | L | 3.45 | |||
| 8q22.3(102,966,194–105,436,379)x1 | L | 2.47 | |||
| 36 | AML | 47,XX,+4[20] | 4p16.3q35.2(62,447–191,133,895)x3 | G | 191.07 |
| 37 | MDS, NHL-B | 48–49,XX,t(2;3)(p21;q27), t(14;18)(q32;q21),del(13)(q14q22), del(13)(q12q22),+2–3mar[3]/49–50,XX,idem,-del(13)(q12q22), del(13)(q12q14)[2]/46,XX[15] | 2q33.1q33.3(202,997,787–206,825,955)x1 | L | 3.83 |
| 2q33.3(207,631,795–208,701,779)x1 | L | 1.07 | |||
| 2q37.3(237,952,481–240,957,818)x1 | L | 3.01 | |||
| 3p14.1p12.3(64,042,038–77,429,636)x1 | L | 13.39 | |||
| 4q21.22q21.23(83,591,174–84,738,260)x1 | L | 1.15 | |||
| 5p15.33q23.1(1277,470–116,567,773)x3 | G | 115.29 | |||
| 5q23.1q33.3(118,308,665–156,929,400)x3 | G | 38.62 | |||
| 5q33.3q35.3(158,536,442–180,632,298)x3 | G | 22.09 | |||
| 6q22.1q22.2(115,749,377–117,537,906)x1 | L | 1.79 | |||
| 6q23.3q27(136,964,780–170,423,523)x1 | L | 33.46 | |||
| 8q12.1q12.3(58,970,215–64,946,145)x1 | L | 5.98 | |||
| 9p21.3(21,853,204–22,236,824)x1 | L | 0.38 | |||
| 11p14.1p12(29,661,255–36,987,957)x1 | L | 7.33 | |||
| 11q14.1q14.2(83,552,150–86,336,627)x1 | L | 2.78 | |||
| 11q14.3q23.1(89,918,757–112,268,464)x1 | L | 22.35 | |||
| 11q24.2q25(124,202,967–134,409,273)x1 | L | 10.21 | |||
| 12p13.33q23.3(59,839–102,532,402)x3 | G | 102.47 | |||
| 12q24.11q24.22(109,894,690–116,643,986)x3 | G | 6.75 | |||
| 12q24.23q24.31(118,257,098–120,150,807)x3 | G | 1.89 | |||
| 12q24.31(120,219,887–121,424,356)x1 | L | 1.20 | |||
| 12q24.31q24.33(121,510,159–132,274,021)x3 | G | 10.76 | |||
| 13q14.2q22.3(47,634,299–76,800,531)x1 | L | 29.17 | |||
| 18q21.1(44,506,498–44,985,105)x1 | L | 0.48 | |||
| 18q21.1q21.2(45,029,168–46,471,947)x3 | G | 1.44 | |||
| 18q21.2(46,555,480–46,858,912)x1 | L | 0.30 | |||
| 38 | MDS | 46,XY,ider(7)(q10)del(7) (q22q34)[20] | 3q26.2q29(170,174,570–199,157,374)x3 | G | 28.98 |
| 7p22.3p11.1(298,857–57,560,846)x1 | L | 57.26 | |||
| 7q11.21q21.2(63,335,058–92,210,294)x3 | G | 28.88 | |||
| 7q21.2q36.3(92,278,892–158,767,840)x1 | L | 66.48 |
G, gain; L, loss.
The abnormalities detected by chromosome analysis in case 34 were initially interpreted as clonal progression with a stemline containing an inverted chromosome 3 and a supernumary marker chromosome, and a sideline with monosomy for chromosome 7. aCGH analysis detected normal copy number in the pericentric region of chromosome 7 from 7p11.2 to 7q21.3, but detected losses of the distal 7p22.3p11.2 and 7q21.3q36.3 segments suggesting that one of the marker chromosomes was chromosome 7 in origin. aCGH also detected a gain of all of the chromosome 21-specific oligos indicating trisomy 21. Retrospective analysis of the original G-banded slides confirmed that the marker chromosome in the stemline was actually an additional chromosome 21 and the marker in the sideline was a derivative chromosome 7. These results highlight the dilemma of poor morphology seen in oncology chromosomes and the need for more sensitive assays to correctly identify abnormal chromosomes. As expected, the balanced inversion on chromosome 3 was not detected by aCGH.
Two of the five cases had apparent balanced translocations by chromosome analysis (cases 35 and 37), both of which had a diagnosis of non-Hodgkin lymphoma of B-cell (NHL-B). Case 35 had one translocation between 2q35 and 6q22, and another translocation between the same chromosome 2 homolog at 2p23 and 8q22 present in 30% of the cells examined by chromosome analysis. aCGH analysis identified five microdeletions in this patient, four of which map within each of the translocation breakpoints (Figure 2A). The remaining loss on chromosome 2q24 is located proximal to the breakpoint on 2q, whether it was involved in the translocations and losses at other chromosomal loci in this patient was unclear.
Figure 2.
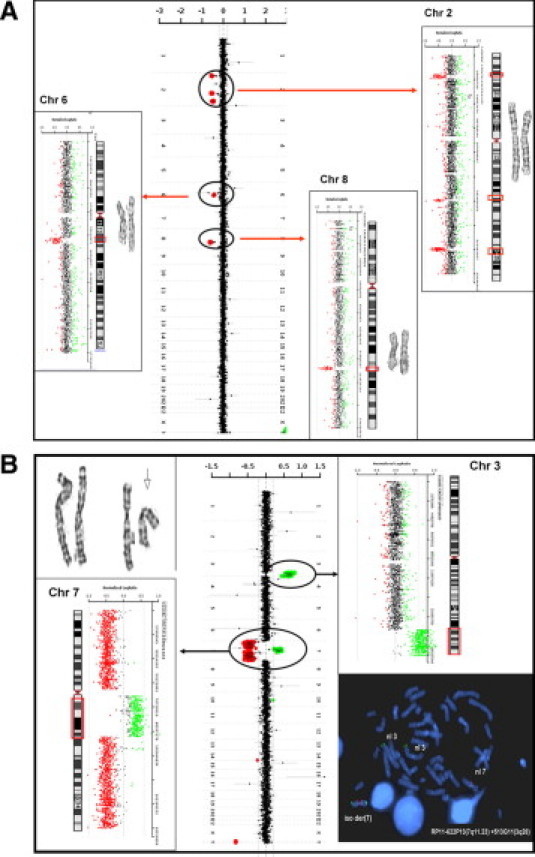
aCGH results for cases 35 and 38. The aCGH genome summary plot is shown from chromosome 1 on top and the sex chromosomes on the bottom. The data points are colored as described in Figure 1. Chromosome-specific plots are shown to the left and right with corresponding ideograms and images of the G-banded chromosomes. The copy number changes detected by aCGH are indicated by the circles on the summary plot and by the red boxes on the ideograms. A: Case 35 was a patient with NHL-B. Chromosome analysis of the patient showed two apparently balanced translocations: t(2;6)(q35;q22) and t(2;8)(p23;q22). Copy number losses corresponding to the apparent translocation breakpoints identified by chromosome analysis are on 2q35 and 6q22 and 2p23 and 8q22. An additional copy number loss was detected on chromosome 2q24. B: Case 38 was a patient with MDS. The top left is a partial karyotype of chromosomes 3 and 7 showing normal chromosome 3 homologues, a normal chromosome 7, and an isoderivative chromosome 7 with an apparent interstitial deletion of bands 7q22–q34 (arrow). A gain of the pericentric region of chromosome 7 (7q11.21q21.1) and losses of both fragments distal to this region on chromosome 7, and a gain on chromosome 3q26.2q29 are shown. FISH analysis with probes to the regions of copy number gains on chromosome 3q (RP11–513G11, green) and 7q (RP11–622P13, red) showed four hybridization signals from the chromosome 3q probe and three from the 7q probe. Two signals each were present on the isoderivative chromosome 7 confirming that the abnormal chromosome 7 was composed of chromosomes 3 and 7.
Chromosome analysis of case 37 revealed two apparent balanced translocations, one between 2p21 and 3q27, the other between 14q32 and 18q21, in addition to deletions on chromosome 13 and 2 to 3 extra marker chromosomes. aCGH analysis was consistent with FISH panel in the detection of 13q deletion. In addition, aCGH identified 16 losses and eight gains, including two microdeletions and a microduplication located within the translocation breakpoint on chromosome 18 (Table 3). None of additional CNCs mapped to the other breakpoint regions. Since the patient had multiple chromosomal gains and losses, it was difficult to pinpoint the origin of the maker chromosomes. Further study is necessary to identify their origins.
Case 38 had a diagnosis of MDS. Chromosome analysis showed an isoderivative chromosome 7 composed of the long arm with an interstitial deletion between 7q22 and 7q34 (Figure 2B). aCGH analysis revealed a gain of chromosome 3 at 3q26.2q29, a gain of pericentric region of chromosome 7 at 7q11.2q21.2, and losses of the distal 7p22.3p11.1 and 7q21.2q36.2 segments (Figure 2B). FISH analysis with probes from the gained regions on chromosome 3 and chromosome 7 demonstrated that the derivative 7 was likely a recombination product composed of 3q and 7q material where the 7q21.2q36.3 segment was replaced by 3q26.2q29 (Figure 2B).
Discussion
aCGH Detects Chromosomal Changes Present in Small Clonal Populations
Conventional chromosome analysis in hematological malignancies is typically performed on at least two cultures with full analysis of a minimum of 20 metaphase cells. Since it requires dividing cells and analyzable metaphases, chromosomal abnormalities in tumors cells that fail to divide or whose chromosomes tend to cluster will not be detected. Chromosome analysis is also labor intensive and of low sensitivity. By examining 20 metaphases, chromosomal abnormalities present in less than 14% of the cells will likely be missed at a 95% confidence level.35 aCGH analysis overcomes the need for dividing cells and provides high sensitivity.
In this pilot study, we examined 55 patients with hematological disorders by using a custom-designed microarray. Large chromosomal changes were detected in 12% (4 of 33) of the patients with normal conventional cytogenetic analyses (cases 2, 4, 6, and 25; Table 1) and additional chromosomal changes were detected in 47% (8 of 17) of the patients with CLL (CLL-1, 4, 5, 6,8, 9, 14, and 16; Table 2), thus demonstrating superior sensitivity over conventional cytogenetic assays.
We previously published our experience detecting mosaicism present in as low as ∼10% of the cell population by using a custom-designed BAC array for constitutional disorders.36 We have also demonstrated that oligo arrays have greater dynamic range and higher sensitivity compared with BAC arrays.37 In the current study, we were able to detect whole chromosome gain in as low as 7% of the cell population (case 25). The current array offers significant advantages including the following: (1) flexible design; (2) selection of high performance oligo probes based on our experience in over 20,000 cases of constitutional disorders; (3) avoidance of repetitive sequence and/or known CNPs; (4) enhanced dynamic ranges (signal to background) thereby increasing robustness in detection of CNCs; and (5) increased resolution that allows for detection of small CNCs.
The major advantage of a targeted whole genome array versus nontargeted array is the exclusion of CNPs on the array without sacrificing a whole genome coverage. An average individual has ∼9 CNPs with the mean size of 300 kb.38 The detection of CNPs will cause a lot of confusion to the physician about the significance of the CNC, and increase the workload to confirm the change to be constitutional or acquired. Our targeted array has on average one probe/7.5 kb in disease gene region and one probe/78 kb in backbone region. Therefore, most CNCs of 250 kb and above in size will be detected by this array. However, smaller CNCs in nondisease gene regions based on current knowledge will most likely not be detected.
Currently, physicians routinely order targeted FISH and chromosome analysis to follow- up the progression of hematological diseases. We examined one patient with relapse of CML (case 4) and one with relapse of MM (case 25), both with negative results for the disease-specific targeted FISH analyses. In case 4, aCGH analysis with FISH confirmation revealed that 30% of the cells had an extra chromosome 14. In case 25, 10% of the cells had tetrasomy 11 and 7% of the cells had an extra copy of chromosome 15 in addition to the loss of an X chromosome. The normal FISH results may mislead the physician and delay the time of therapy. Similarly, case 2 and case 6 had normal chromosome analyses but were shown to have clonal populations with loss of 17p and gain of 17q (57%), and trisomy 10 (14.5%) identified following aCGH analysis. In a 2007 study by Tyybäkinoja et al,39 15% of karyotypically normal AML patients examined by aCGH analysis had cryptic CNCs of 0.4 to 4.1 Mb, which could serve as molecular markers, especially in cases where other mutations were not detected. Therefore, we propose aCGH should be considered even when traditional cytogenetics tests are normal and relapse or cancer diagnosis is still suspected.
aCGH Provides Whole Genome View and More Prognostic Information for CLL Patients
CLL is notorious for its in vitro growth failure. A panel of six FISH probes is typically applied in cytogenetics laboratories to detect recurrent chromosomal abnormalities. In this study, aCGH was concordant with the majority of the FISH findings, except a cryptic deletion on 17p13.1, which was detected in 35% of the cells using a FISH panel (CLL-8). Since a 5% loss of TP53 by FISH analysis was observed by aCGH after enrichment of B-cell in CLL-4, we believe that aCGH has sufficient sensitivity to detect a loss in 35% of the cells if it was present in B-cells. This inability to detect the loss could be that the deletion of 17p was present in a cell lineage other than B lymphocytes, and therefore would not be detected after B-cell enrichment. Co-existence of B-cell CLL and large cell lymphoma of T-cell origin is not uncommon40; however, we could not obtain another sample from this patient to confirm this hypothesis.
In addition to the changes identified by FISH and chromosome analyses, 47% (8 of 17) of CLL patients had additional CNCs identified by aCGH. aCGH detected 37 abnormal events in 17 CLL patients that were 76% more than the total events detected by FISH and chromosome analysis combined (n = 21; Table 2). This detection rate is superior to that achieved by using our previous CLL-targeted BAC array, which detected extra findings in ∼30% of the samples and a genome-wide BAC array used in another study that detected 21% more abnormalities.10,11
The prediction of disease progression and prognosis in CLL is traditionally made according to Rai and Binet staging. It is now being superseded by new prognostic markers such as the mutational status of the immunoglobulin variable region heavy-chain genes and chromosomal aberrations. Deletion of 13q as a sole abnormality is associated with favorable prognosis, whereas deletions of 11q and 17p predict poor outcome. In our cohort, five patients had deletion of 13q as a sole aberration by FISH analysis (CLL-5, 6, 7, 10, and 16; Table 2) and would probably fall in the category of favorable outcome. aCGH identified extra aberrations in two of the five patients; loss of the ABL-2 gene at 1q25 and the NF1 gene at 17q11.2 in CLL-5, and a gain of ∼96 Mb on 4q and a loss of 11q25 in CLL-6. These extra findings may reassign these patients into different prognostic groups. Although the association between the number of genome-wide aberrations and prognosis in CLL is not clear at present, increased complexity of karyotype and a higher number of larger CNCs in CLL and greater total genomic alteration in MDS have been associated with poor outcome.41,42,43 Further research to determine the clinical significance of genome-wide aberrations will help clinicians better predict disease progression and prognosis.
aCGH Detects Microdeletions in Apparent Balanced Translocations and May Be Useful in Guiding Treatment and Predicting Prognosis
The majority of leukemias are characterized by well-known recurring translocations or inversions. Some translocation chromosomes are important markers for therapy such as t(15;17) in acute promyelocytic leukemia and t(9;22) in CML. Microdeletions adjacent to the translocation breakpoints were detected in 10% to 20% of CML patients with overt or cryptic BCR/ABL rearrangements.44,45 The prognostic value of microdeletions is controversial. In some patients they were associated with poor therapy response and unfavorable outcome,44,46 whereas in others they were not relevant in determining prognosis.47,48 Particularly, if the microdeletion did not span the breakpoints, the patients might have better survival rates than those without a deletion.47,48 Nevertheless, a microdeletion of 0.545 Mb at 17q21 in a patient with acute promyelocytic leukemia with a t(15;17) was reported to be associated with an aggressive disease course.49 In our study, aCGH identified microdeletions at five breakpoints in three apparently balanced translocations (cases 35 and 37). However, our study had only two patients with apparent balanced translocations and the clinical significance of these losses was not clear. Further examination of a larger sample size with carefully selected patients, including patients with therapy-related translocations, will be necessary to elucidate the clinical significance of microdeletions at breakpoints.
Conclusions
In this pilot study, we demonstrated that our custom oligo microarray significantly improved the detection rate of chromosome aberrations in patients with hematological tumors compared with traditional cytogenetic techniques and BAC microarrays. In particular, for CLL patients, we found that aCGH analysis provided a genome-wide view of chromosomal changes and identified more prognostic markers for clinical use. Therefore, we propose aCGH analysis should be the standard of care for diagnosis and follow-up of patients with hematological tumors.
Footnotes
Supplemental material for this article can be found on http://jmd.amjpathol.org.
Web Extra Material
References
- 1.Slavotinek AM. Novel microdeletion syndromes detected by chromosome microarrays. Hum Genet. 2008;124:1–17. doi: 10.1007/s00439-008-0513-9. [DOI] [PubMed] [Google Scholar]
- 2.Hastings PJ, Lupski JR, Rosenberg SM, Ira G. Mechanisms of change in gene copy number. Nat Rev Genet. 2009;10:551–564. doi: 10.1038/nrg2593. [DOI] [PMC free article] [PubMed] [Google Scholar]
- 3.Mefford HC, Eichler EE. Duplication hotsposts, rare genomic disorders, and common disease. Curr Opin Genet Dev. 2009;19:196–204. doi: 10.1016/j.gde.2009.04.003. [DOI] [PMC free article] [PubMed] [Google Scholar]
- 4.Kallioniemi A. CGH microarrays and cancer. Curr Opin Biotechnol. 2008;19:36–40. doi: 10.1016/j.copbio.2007.11.004. [DOI] [PubMed] [Google Scholar]
- 5.Costa JL, Meijer G, Ylstra B, Caldas C. Array comparative genomic hybridization copy number profiling: a new tool for translational research in solid malignancies. Semin Radiat Oncol. 2008;18:98–104. doi: 10.1016/j.semradonc.2007.10.005. [DOI] [PubMed] [Google Scholar]
- 6.Watson SK, deLeeuw RJ, Horsman DE, Squire JA, Lam WL. Cytogenetically balanced translocations are associated with focal copy number alterations. Hum Genet. 2007;120:795–805. doi: 10.1007/s00439-006-0251-9. [DOI] [PubMed] [Google Scholar]
- 7.Swerdlow SH, Campo E, Harris NL, Jaffe ES, Pileri SA, Stein H, Thiele J, Vardiman JW, editors. WHO Classification of Tumours of Haematopoietic and Lymphoid Tissues. 4th ed. IARC Press; Lyon: 2008. [Google Scholar]
- 8.van Vlierberghe P, Meijerink JP, Lee C, Ferrando AA, Look AT, van Wering ER, Beverloo HB, Aster JC, Pieters R. A new recurrent 9q34 duplication in pediatric T-cell acute lymphoblastic leukemia. Leukemia. 2006;20:1245–1253. doi: 10.1038/sj.leu.2404247. [DOI] [PubMed] [Google Scholar]
- 9.Schwaenen C, Nessling M, Wessendorf S, Salvi T, Wrobel G, Radlwimmer B, Kestler HA, Haslinger C, Stilgenbauer S, Döhner H, Bentz M, Lichter P. Automated array-based genomic profiling in chronic lymphocytic leukemia: development of a clinical tool and discovery of recurrent genomic alterations. Proc Natl Acad Sci USA. 2004;101:1039–1044. doi: 10.1073/pnas.0304717101. [DOI] [PMC free article] [PubMed] [Google Scholar]
- 10.Patel A, Kang SH, Lennon PA, Li YF, Rao PN, Abruzzo L, Shaw C, Chinault AC, Cheung SW. Validation of a targeted DNA microarray for the clinical evaluation of recurrent abnormalities in chronic lymphocytic leukemia. Am J Hematol. 2008;83:540–546. doi: 10.1002/ajh.21145. [DOI] [PubMed] [Google Scholar]
- 11.Gunn SR, Mohammed MS, Gorre ME, Cotter PD, Kim J, Bahler DW, Preobrazhensky SN, Higgins RA, Bolla AR, Ismail SH, de Jong D, Eldering E, van Oers MH, Mellink CH, Keating MJ, Schlette EJ, Abruzzo LV, Robetorye RS. Whole-genome scanning by array comparative genomic hybridization as a clinical tool for risk assessment in chronic lymphocytic leukemia. J Mol Diagn. 2008;10:442–451. doi: 10.2353/jmoldx.2008.080033. [DOI] [PMC free article] [PubMed] [Google Scholar]
- 12.Olshen AB, Venkatraman ES, Lucito R, Wigler M. Circular binary segmentation for the analysis of array-based DNA copy number data. Biostatistics. 2004;5:557–572. doi: 10.1093/biostatistics/kxh008. [DOI] [PubMed] [Google Scholar]
- 13.Lu X, Shaw CA, Patel A, Li J, Cooper ML, Wells WR, Sullivan CM, Sahoo T, Yatsenko SA, Bacino CA, Stankiewicz P, Ou Z, Chinault AC, Beaudet AL, Lupski JR, Cheung SW, Ward PA. Clinical implementation of chromosomal microarray analysis: summary of 2513 postnatal cases. PLoS One. 2007;2:e327. doi: 10.1371/journal.pone.0000327. [DOI] [PMC free article] [PubMed] [Google Scholar]
- 14.McClure RF, Dewald GW, Hoyer JD, Hanson CA. Isolated isochromosome 17q: a distinct type of mixed myeloproliferative disorder/myelodysplastic syndrome with an aggressive clinical course. Br J Haematol. 1999;106:445–454. doi: 10.1046/j.1365-2141.1999.01537.x. [DOI] [PubMed] [Google Scholar]
- 15.Shashaty GG, Baumiller RC. Philadelphia chromosome-negative chronic myelogenous leukemia with trisomy D. Arch Pathol Lab Med. 1980;104:376–378. [PubMed] [Google Scholar]
- 16.Zaccaria A, Valenti AM, Donti E, Gozzetti A, Ronconi S, Spedicato F. Persistence of chromosomal abnormalities additional to the Philadelphia chromosome after Philadelphia chromosome disappearance during imatinib therapy for chronic myeloid leukemia. Haematologica. 2007;92:564–565. doi: 10.3324/haematol.10783. [DOI] [PubMed] [Google Scholar]
- 17.Morgan R, Chen Z, Stone JF, Cohen J, Gustafson E, Jolly PC, Sandberg AA. Trisomy 10: age and leukemic lineage associations. Cancer Genet Cytogenet. 1996;89:173–174. doi: 10.1016/0165-4608(96)00075-1. [DOI] [PubMed] [Google Scholar]
- 18.Tabernero D, San Miguel JF, Garcia-Sanz M, Nájera L, García-Isidoro M, Peréz-Simon JA, Gonzalez M, Wiegant J, Raap AK, Orfão A. Incidence of chromosome numerical changes in multiple myeloma: fluorescence in situ hybridization analysis using 15 chromosome-specific probes. Am J Pathol. 1996;149:153–161. [PMC free article] [PubMed] [Google Scholar]
- 19.Cremer FW, Kartal M, Hose D, Bila J, Buck I, Bellos F, Raab MS, Brough M, Moebus A, Hager HD, Goldschmidt H, Moos M, Bartram CR, Jauch A. High incidence and intraclonal heterogeneity of chromosome 11 aberrations in patients with newly diagnosed multiple myeloma detected by multiprobe interphase FISH. Cancer Genet Cytogenet. 2005;161:116–124. doi: 10.1016/j.cancergencyto.2005.02.015. [DOI] [PubMed] [Google Scholar]
- 20.Di Bernardo MC, Crowther-Swanepoel D, Broderick P, Webb E, Sellick G, Wild R, Sullivan K, Vijayakrishnan J, Wang Y, Pittman AM, Sunter NJ, Hall AG, Dyer MJ, Matutes E, Dearden C, Mainou-Fowler T, Jackson GH, Summerfield G, Harris RJ, Pettitt AR, Hillmen P, Allsup DJ, Bailey JR, Pratt G, Pepper C, Fegan C, Allan JM, Catovsky D, Houlston RS. A genome-wide association study identifies six susceptibility loci for chronic lymphocytic leukemia. Nat Genet. 2008;40:1204–1210. doi: 10.1038/ng.219. [DOI] [PubMed] [Google Scholar]
- 21.Usvasalo A, Savola S, Räty R, Vettenranta K, Harila-Saari A, Koistinen P, Savolainen ER, Elonen E, Saarinen-Pihkala UM, Knuutila S. CDKN2A deletions in acute lymphoblastic leukemia of adolescents and young adults: an array CGH study. Leuk Res. 2008;32:1228–1235. doi: 10.1016/j.leukres.2008.01.014. [DOI] [PubMed] [Google Scholar]
- 22.Tsirigotis P, Pappa V, Labropoulos S, Papageorgiou S, Kontsioti F, Dervenoulas J, Papageorgiou E, Panani A, Mantzios G, Economopoulos T, Raptis S. Mutational and methylation analysis of the cyclin-dependent kinase 4 inhibitor (p16INK4A) gene in chronic lymphocytic leukemia. Eur J Haematol. 2006;76:230–236. doi: 10.1111/j.1600-0609.2005.00604.x. [DOI] [PubMed] [Google Scholar]
- 23.Cazzaniga G, Tosi S, Aloisi A, Giudici G, Daniotti M, Pioltelli P, Kearney L, Biondi A. The tyrosine kinase abl-related gene ARG is fused to ETV6 in an AML-M4Eo patient with a t(1;12)(q25;p13): molecular cloning of both reciprocal transcripts. Blood. 1999;94:4370–4373. [PubMed] [Google Scholar]
- 24.Fan YS, Rizkalla K, Barr RM. A new complex variant Philadelphia chromosome, t(1;9: 22)ins(17;22), characterized by fluorescence in situ hybridization in an adult ALL. Leuk Res. 1999;23:1001–1006. doi: 10.1016/s0145-2126(99)00130-7. [DOI] [PubMed] [Google Scholar]
- 25.Balgobind BV, Van Vlierberghe P, van den Ouweland AM, Beverloo HB, Terlouw-Kromosoeto JN, van Wering ER, Reinhardt D, Horstmann M, Kaspers GJ, Pieters R, Zwaan CM, Van den Heuvel-Eibrink MM, Meijerink JP. Leukemia-associated NF1 inactivation in patients with pediatric T-ALL and AML lacking evidence for neurofibromatosis. Blood. 2008;111:4322–4328. doi: 10.1182/blood-2007-06-095075. [DOI] [PubMed] [Google Scholar]
- 26.Gunn SR, Hibbard MK, Ismail SH, Lowery-Nordberg M, Mellink CH, Bahler DW, Abruzzo LV, Enriquez EL, Gorre ME, Mohammed MS, Robetorye RS. Atypical 11q deletions identified by array CGH may be missed by FISH panels for prognostic markers in chronic lymphocytic leukemia. Leukemia. 2009;23:1011–1017. doi: 10.1038/leu.2008.393. [DOI] [PubMed] [Google Scholar]
- 27.Cui Y, Ying Y, van Hasselt A, Ng KM, Yu J, Zhang Q, Jin J, Liu D, Rhim JS, Rha SY, Loyo M, Chan AT, Srivastava G, Tsao GS, Sellar GC, Sung JJ, Sidransky D, Tao Q. OPCML is a broad tumor suppressor for multiple carcinomas and lymphomas with frequently epigenetic inactivation. PLoS One. 2008;3:e2990. doi: 10.1371/journal.pone.0002990. [DOI] [PMC free article] [PubMed] [Google Scholar]
- 28.Christacos NC, Sherman L, Roy A, DeAngelo DJ, Dal Cin P. Is the cryptic interstitial deletion of 8q24 surrounding MYC a common mechanism in the formation of double minute chromosome? Cancer Genet Cytogenet. 2005;161:90–92. doi: 10.1016/j.cancergencyto.2004.12.023. [DOI] [PubMed] [Google Scholar]
- 29.Pfeifer D, Pantic M, Skatulla I, Rawluk J, Kreutz C, Martens UM, Fisch P, Timmer J, Veelken H. Genome-wide analysis of DNA copy number changes and LOH in CLL using high-density SNP arrays. Blood. 2007;109:1202–1210. doi: 10.1182/blood-2006-07-034256. [DOI] [PubMed] [Google Scholar]
- 30.Chapiro E, Leporrier N, Radford-Weiss I, Bastard C, Mossafa H, Leroux D, Tigaud I, De Braekeleer M, Terré C, Brizard F, Callet-Bauchu E, Struski S, Veronese L, Fert-Ferrer S, Taviaux S, Lesty C, Davi F, Merle-Béral H, Bernard OA, Sutton L, Raynaud SD, Nguyen-Khac F. Gain of the short arm of chromosome 2 (2p) is a frequent recurring chromosome aberration in untreated chronic lymphocytic leukemia (CLL) at advanced stages. Leuk Res. 2010;34:63–68. doi: 10.1016/j.leukres.2009.03.042. [DOI] [PubMed] [Google Scholar]
- 31.Hewamana S, Lin TT, Rowntree C, Karunanithi K, Pratt G, Hills R, Fegan C, Brennan P, Pepper C. Rel a is an independent biomarker of clinical outcome in chronic lymphocytic leukemia. J Clin Oncol. 2009;27:763–769. doi: 10.1200/JCO.2008.19.1114. [DOI] [PubMed] [Google Scholar]
- 32.Forconi F, Rinaldi A, Kwee I, Sozzi E, Sozzi E, Raspadori D, Rancoita PM, Scandurra M, Rossi D, Deambrogi C, Capello D, Zucca E, Marconi D, Bomben R, Gattei V, Lauria F, Gaidano G, Bertoni F. Genome-wide DNA analysis identifies recurrent imbalances predicting outcome in chronic lymphocytic leukaemia with 17p deletion. Br J Haematol. 2008;143:532–536. doi: 10.1111/j.1365-2141.2008.07373.x. [DOI] [PubMed] [Google Scholar]
- 33.Sellmann L, Gesk S, Walter C, Ritgen M, Harder L, Martín-Subero JI, Schroers R, Siemer D, Nückel H, Dyer MJ, Dührsen U, Siebert R, Dürig J, Küppers R. Trisomy 19 is associated with trisomy 12 and mutated IGHV genes in B-chronic lymphocytic leukaemia. Br J Haematol. 2007;138:217–220. doi: 10.1111/j.1365-2141.2007.06636.x. [DOI] [PubMed] [Google Scholar]
- 34.Nayak BN, Sokal J, Ray M. Clonal chromosomal changes in chronic lymphocytic leukemia. Cancer Lett. 1990;49:99–105. doi: 10.1016/0304-3835(90)90144-m. [DOI] [PubMed] [Google Scholar]
- 35.Hook EB. Exclusion of chromosomal mosaicism: tables of 90%, 95% and 99% confidence limits and comments on use. Am J Hum Genet. 1977;29:94–97. [PMC free article] [PubMed] [Google Scholar]
- 36.Cheung SW, Shaw CA, Scott DA, Patel A, Sahoo T, Bacino CA, Pursley A, Li J, Erickson R, Gropman AL, Miller DT, Seashore MR, Summers AM, Stankiewicz P, Chinault AC, Lupski JR, Beaudet AL, Sutton VR. Microarray-based CGH detects chromosomal mosaicism not revealed by conventional cytogenetics. Am J Med Genet A. 2007;143A:1679–1686. doi: 10.1002/ajmg.a.31740. [DOI] [PubMed] [Google Scholar]
- 37.Ou Z, Kang SH, Shaw CA, Carmack CE, White LD, Patel A, Beaudet AL, Cheung SW, Chinault AC. Bacterial artificial chromosome-emulation oligonucleotide arrays for targeted clinical array-comparative genomic hybridization analyses. Genet Med. 2008;10:278–289. doi: 10.1097/GIM.0b013e31816b4420. [DOI] [PMC free article] [PubMed] [Google Scholar]
- 38.Li J, Yang T, Wang L, Yan H, Zhang Y, Guo Y, Pan F, Zhang Z, Peng Y, Zhou Q, He L, Zhu X, Deng H, Levy S, Papasian CJ, Drees BM, Hamilton JJ, Recker RR, Cheng J, Deng HW. Whole genome distribution and ethnic differentiation of copy number variation in Caucasian and Asian populations. PLoS One. 2009;4(11):e7958. doi: 10.1371/journal.pone.0007958. [DOI] [PMC free article] [PubMed] [Google Scholar]
- 39.Tyybäkinoja A, Elonen E, Piippo K, Porkka K, Knuutila S. Oligonucleotide array-CGH reveals cryptic gene copy number alterations in karyotypically normal acute myeloid leukemia. Leukemia. 2007;21:571–574. doi: 10.1038/sj.leu.2404543. [DOI] [PubMed] [Google Scholar]
- 40.Viny AD, Lichtin A, Pohlman B, Loughran T, Maciejewski J. Chronic B-cell dyscrasias are an important clinical feature of T-LGL leukemia. Leuk Lymphoma. 2008;49:932–938. doi: 10.1080/10428190801932635. [DOI] [PubMed] [Google Scholar]
- 41.Juliusson G, Oscier DG, Fitchett M, Ross FM, Stockdill G, Mackie MJ, Parker AC, Castoldi GL, Guneo A, Knuutila S, Elonen E, Gahrton G. Prognostic subgroups in B-cell chronic lymphocytic leukemia defined by specific chromosomal abnormalities. N Engl J Med. 1990;323:720–724. doi: 10.1056/NEJM199009133231105. [DOI] [PubMed] [Google Scholar]
- 42.Gunnarsson R, Isaksson A, Mansouri M, Göransson H, Jansson M, Cahill N, Rasmussen M, Staaf J, Lundin J, Norin S, Buhl AM, Smedby KE, Hjalgrim H, Karlsson K, Jurlander J, Juliusson G, Rosenquist R. Large but not small copy-number alterations correlate to high-risk genomic aberrations and survival in chronic lymphocytic leukemia: a high-resolution genomic screening of newly diagnosed patients. Leukemia. 2010;24:211–215. doi: 10.1038/leu.2009.187. [DOI] [PubMed] [Google Scholar]
- 43.Starczynowski DT, Vercauteren S, Telenius A, Sung S, Tohyama K, Brooks-Wilson A, Spinelli JJ, Eaves CJ, Eaves AC, Horsman DE, Lam WL, Karsan A. High-resolution whole genome tiling path array CGH analysis of CD34+ cells from patients with low-risk myelodysplastic syndromes reveals cryptic copy number alterations and predicts overall and leukemia-free survival. Blood. 2008;112:3412–3424. doi: 10.1182/blood-2007-11-122028. [DOI] [PubMed] [Google Scholar]
- 44.Kolomietz E, Al-Maghrabi J, Brennan S, Karaskova J, Minkin S, Lipton J, Squire JA. Primary chromosomal rearrangements of leukemia are frequently accompanied by extensive submicroscopic deletions and may lead to altered prognosis. Blood. 2001;97:3581–3588. doi: 10.1182/blood.v97.11.3581. [DOI] [PubMed] [Google Scholar]
- 45.De Melo VA, Milojkovic D, Marin D, Apperley JF, Nacheva EP, Reid AG. Deletions adjacent to BCR and ABL1 breakpoints occur in a substantial minority of chronic myeloid leukemia patients with masked Philadelphia rearrangements. Cancer Genet Cytogenet. 2008;182:1111–1115. doi: 10.1016/j.cancergencyto.2008.01.007. [DOI] [PubMed] [Google Scholar]
- 46.Vaz de Campos MG, Montesano FT, Rodrigues MM, Chauffaille Mde L. Clinical implications of der(9q) deletions detected through dual-fusion fluorescence in situ hybridization in patients with chronic myeloid leukemia. Cancer Genet Cytogenet. 2007;178:49–56. doi: 10.1016/j.cancergencyto.2007.06.013. [DOI] [PubMed] [Google Scholar]
- 47.Kreil S, Pfirrmann M, Haferlach C, Waghorn K, Chase A, Hehlmann R, Reiter A, Hochhaus A, Cross NC, German Chronic Myelogenous Leukemia (CML) Study Group Heterogeneous prognostic impact of derivative chromosome 9 deletions in chronic myelogenous leukemia. Blood. 2007;110:1283–1290. doi: 10.1182/blood-2007-02-074252. [DOI] [PubMed] [Google Scholar]
- 48.Fourouclas N, Campbell PJ, Bench AJ, Swanton S, Baxter EJ, Huntly BJ, Green AR. Size matters: the prognostic implications of large and small deletions of the derivative 9 chromosome in chronic myeloid leukemia. Haematologica. 2006;91:952–955. [PubMed] [Google Scholar]
- 49.Dolan M, Peterson B, Hirsch B. Array-based comparative genomic hybridization characterizes a deletion associated with a t(15;17) in acute promyelocytic leukemia. Am J Clin Pathol. 2008;130:818–823. doi: 10.1309/AJCPENMUI47OGKRW. [DOI] [PubMed] [Google Scholar]
Associated Data
This section collects any data citations, data availability statements, or supplementary materials included in this article.