

Abstract
The habenula complex is implicated in a range of cognitive, emotional and reproductive behaviors, and recently this epithalamic structure was suggested to be a component of the brain's circadian system. Circadian timekeeping is driven in cells by the cyclical activity of core clock genes and proteins such as per2/PER2. There are currently no reports of rhythmic clock gene/protein expression in the habenula and therefore the question of whether this structure has an intrinsic molecular clock remains unresolved. Here, using videomicroscopy imaging and photon-counting of a PER2::luciferase (LUC) fusion protein together with multiunit electrophysiological recordings, we tested the endogenous circadian properties of the mouse habenula in vitro. We show that a circadian oscillator is localized primarily to the medial portion of the lateral habenula. Rhythms in PER2:: LUC bioluminescence here are visualized in single cells and oscillations continue in the presence of the sodium channel blocker, tetrodotoxin, indicating that individual cells have intrinsic timekeeping properties. Ependymal cells lining the dorsal third ventricle also express circadian oscillations of PER2. These findings establish that neurons and non-neuronal cells in the epithalamus express rhythms in cellular and molecular activities, indicating a role for circadian oscillators in the temporal regulation of habenula controlled processes and behavior.
Key words: lateral habenula; medial habenula; ependymal, period 2; electrophysiology; bioluminescence
Abbreviations: cpm, counts per minute; Hb, habenula; LD, light/dark cycle; LHb, lateral habenula; LHbL, lateral portion of the lateral habenula; LHbM, medial portion of the lateral habenula; LUC, luciferase; MHb, medial habenula; mRGCs, melanopsin-containing retinal ganglion cells; MUA, multiunit activity; NMDA, N-methyl-d-aspartic acid; PER2, period 2; PMT, photomultiplier tube; SCN, suprachiasmatic nuclei; TTX, tetrodotoxin; ZT, zeitgeber time
The hypothalamic suprachiasmatic nuclei (SCN) are pivotal in controlling daily and circadian rhythms in physiology and behavior (Rusak and Zucker, 1979). The SCN circadian clock is synchronized to environmental light cues captured by rods, cones and melanopsin-containing retinal ganglion cells (mRGCs), and relayed directly to the SCN via the retinohypothalamic tract (Rollag et al., 2003; Guler et al., 2008; Hatori et al., 2008). Both in vitro and in vivo, rodent SCN neurons sustain circadian rhythms in spontaneous electrical activity, with peak firing rates recorded during the middle of the projected day (Brown and Piggins, 2007). Two key developments have led to a significant reappraisal of the extent of the mammalian brain's circadian system. First, studies of tissue from transgenic rodent models bearing bioluminescent (luciferase, or luc) reporters driven by clock genes/proteins, have unmasked a range of circadian oscillators of varying strength in other brain areas (Abe et al., 2002; Granados-Fuentes et al., 2004; Hiler et al., 2008; Guilding et al., 2009; Wang et al., 2009). Second, investigation of the central projections of mRGCs reveals that circadian photic information is directly conveyed to extra-SCN brain sites (Hattar et al., 2006). Collectively, these findings indicate that circadian processes in the brain are not exclusive to the SCN, and the identification of such extra-SCN sites is a key goal in circadian neurobiology (Guilding and Piggins, 2007).
One such candidate is the habenula (Hb). This epithalamic complex is anatomically divided into medial (MHb) and lateral (LHb) regions and it is implicated in learning, memory, attention, sleep/wake cycles and anxiety (Lecourtier and Kelly, 2007; Geisler and Trimble, 2008; Hikosaka et al., 2008). Building on earlier reports of retinal innervation of the rodent Hb (Cooper et al., 1993; Qu et al., 1996), mRGCs were recently found to innervate the mouse LHb region (Hattar et al., 2006). In vivo rat Hb neurons alter discharge activity in response to retinal illumination in a pattern resembling that of mRGC activation (Zhao and Rusak, 2005). Further, in ex vivo brain slices, LHb (but not MHb) neurons may sustain circadian rhythms in electrical activity (Zhao and Rusak, 2005). Thus, the rodent Hb has some SCN-like properties, but currently, there are no reports of rhythmic clock gene/protein expression in the Hb and therefore the potential for molecular circadian timekeeping properties in this structure remains unknown.
Here using videomicroscopy imaging and photon-counting of PER2::LUC fusion protein bioluminescence together with multiunit electrophysiological recordings, we investigate the endogenous circadian properties of the mouse Hb in vitro.
Experimental procedures
Animals
Adult male mPer2Luc knock-in mice (PER2::LUC, University of Manchester breeding colony; Yoo et al., 2004) were maintained under a 12-h light/12-h dark (LD) cycle, with ad libitum access to food and water. Temperature was maintained at ∼18 °C and humidity at ∼40%. Zeitgeber time (ZT) 0 was defined as lights-on and ZT12 as lights-off. Animals were group housed for at least 2 weeks prior to experimentation. All procedures were carried out in accordance with the UK Animals (Scientific Procedures) Act 1986.
Culture preparation
Mice were culled by cervical dislocation following halothane anesthesia (Concord Pharmaceuticals, Essex UK), at a range of times spanning the LD cycle (ZT 2.3–23.3 inclusive, Suppl. Fig. S1) to enable assessment of the effect of the time of culture preparation on the phase of peak PER2::LUC activity. For procedures conducted during the dark period, animal handling and brain extraction were conduced with the aid of night vision goggles to prevent exposure of animals to visible light. Coronal SCN or mid bilateral habenula (corresponding to the region between ∼−1.70∼−2.10 mm bregma; Paxinos and Franklin, 2001) slice cultures (300 μm thick) were prepared, and micro-dissected tissue was cultured as previously described (Hughes et al., 2008; Guilding et al., 2009).
Luminometry
Total bioluminescence was recorded for up to 12 days from individual brain slice cultures with photomultiplier tube (PMT) assemblies (H8259/R7518P; Hamamatsu, Welwyn Garden City, UK) housed in a light-tight incubator (Galaxy R+, RS Biotech, Irvine, Scotland) maintained at 37 °C. Photon counts were integrated for 59 s every 1 min. All bioluminescence data were detrended by subtracting a 24 h running average from the raw data and smoothed with a 3 h running average.
Bioluminescence imaging
Bioluminescence emission was imaged with an Olympus LV200 luminescence microscopy system (Olympus, Japan) fitted with a cooled Hamamatsu C9100-13 EM-CCD camera using a 20×0.4 NA Plan Apo objective (Olympus). The LV200 incubator was maintained at 37 °C in darkness. A transmitted light image was recorded prior to the start of each imaging run to aid anatomical localization of bioluminescence. Acquired images were transferred to ImageJ (version 1.37a, NIH, USA) and a region of interest tool was used to delineate discrete areas (MHb, LHb, ependymal cells of the third ventricle, and single cells) and assess relative bioluminescence over time. Putative single cells were identified and distinguished from background noise and isolated cosmic events by their characteristic size, shape and temporal expression profile.
Tetrodotoxin and forskolin treatment
To assess the contribution of sodium-dependant action potential generation on the maintenance of bioluminescence rhythms in the Hb, explants were cultured with a voltage-gated sodium channel blocker, tetrodotoxin (TTX; 0.5 μM, Sigma, Poole, UK) in the medium. Tissue viability following damping of bioluminescence rhythms was assessed by treatment of cultures with the adenylate cyclase activator, forskolin (10 μM, Sigma), 3–8 days following culture. Treatment was performed as a complete medium change to fresh, forskolin-containing culture medium, otherwise identical to initial Dulbecco's Modified Eagle's medium (DMEM; Sigma) based culture medium.
Extracellular recording
Habenula slice cultures (350 μm thick), corresponding to the same bregma location as used for the bioluminescence cultures, were prepared during the early lights-on phase (ZT 1–3) and maintained using methods similar to those described earlier (Brown et al., 2006). Slices were transferred to an interface style brain slice chamber continuously perfused (∼1.5 ml/min) with oxygenated (95% O2/5% CO2) aCSF supplemented with 0.0005% gentamicin (Sigma) and warmed to 36±1 °C. Slices were transilluminated and visualized under a dissecting microscope, and micromanipulators were used to precisely guide electrode tips onto the medial part of the LHb (LHbM; Fig. 5E). Extracellular multiunit activity (MUA) was recorded for at least 48 h, using aCSF-filled suction electrodes. Slice viability was tested 72–96 h after preparation by addition of a 5 min pulse of 10 μM (N-methyl-d-aspartic acid (NMDA; Sigma) to the perfusing aCSF; NMDA caused an acute elevation in cell discharge activity (Suppl. Fig. S2). Multiunit signals were differentially amplified (×20,000) and bandpass filtered (300–3000 Hz) via a Neurolog system (Digitimer, UK), digitized (25,000 Hz) using a micro 1401 mkII interface (Cambridge Electronic Design (CED), Cambridge, UK) and recorded on a PC running Spike2 version 6 software (CED).
Fig. 5.

Temporal patterns of electrical activity in the LHb. Recordings from the LHb discriminated multiunit (MUA; A, C) and single unit electrical activity (SUA; B, D). MUA rhythms generally showed one peak (A) or peaks on consecutive days (C) with a circadian period. Single cells discriminated from the multiunit recordings in (A, C) are shown below them (B, D). Inset traces in (B, D) indicate the average spike waveforms for each cell; scale bars represent 15 μV (vertical) and 1 ms (horizontal). (E) Representative photograph of electrode positioning on the LHbM for electrophysiological recordings. (F) Rayleigh vector plot showing that the phases of peak electrical activity in the LHb are randomly distributed across the LD cycle. Filled circles indicate the phase of individual slices (n=18). For interpretation of the references to color in this figure legend, the reader is referred to the Web version of this article.
Using Spike2, single unit activity was discriminated offline from these MUA recordings as previously described (Brown et al., 2006). Briefly, single units were discriminated on the basis of waveform shape, principal components-based clustering, and the presence of a clear refractory period in an interspike interval histogram. With these criteria we were able to successfully isolate up to two single units per recording.
Data analysis
Molecular and electrophysiological rhythms were analyzed using curve fitting software (Clockwise, developed in house by Dr. T. Brown) as previously described (Bechtold et al., 2008). Processed bioluminescence data were assessed with Clockwise to determine the significance of circadian variation in PER2::LUC expression. Period (peak-peak and trough-trough averaged), phase (peak PER2::LUC expression during the interval between 24 and 48 h in culture), amplitude (peak-trough 24–48 h after culture) and rate of damping (the number of cycles observed before bioluminescence levels reached the level of dark current noise (±10%), previously determined for each individual PMT), were assessed manually by two experienced, independent researchers blinded to conditions. Period and phase measurements were subsequently confirmed with Clockwise and in all cases were found to be in close agreement with manually assessed data. Paired and unpaired t-tests (Excel; P<0.05 required for significance) were used as appropriate to determine statistically significant differences. Rayleigh analysis was used to assess clustering of the times of peak electrical and molecular activity (El Temps; Dr. A. Díez-Noguera, Barcelona, Spain, significance set at P<0.05).
Results
We investigated circadian rhythmicity in the Hb using longitudinal electrophysiological recordings of neuronal activity and assessment of PER2::LUC bioluminescence emissions from adult mouse brain slice cultures in vitro. Both preparations enabled investigation of the endogenous circadian properties of the tissue since they are devoid of any input from the SCN or other known circadian oscillators.
Circadian rhythms of PER2::LUC bioluminescence in the Hb complex
To determine the circadian characteristics of the Hb complex, we performed long-term luminometry of PER2::LUC expression recorded in PMTs for up to 12 days. Seventy four percent of Hb slice cultures (25/34) displayed circadian rhythms in PER2::LUC emission, with a mean period of 22.65±0.6 h (Fig. 1; significance determined by Clockwise rhythm analysis software; P<0.05). Slices showed up to three circadian cycles in PER2::LUC bioluminescence before damping to apparent arrhythmicity (Fig. 1F; mean duration before damping 1.5±0.1 cycles). Forskolin, an activator of adenylate cyclase, is commonly used to evoke rhythms in damped circadian oscillators. Forskolin treatment (10 μM) restarted damped rhythms in all Hb slices monitored in PMTs (Fig. 1A; n=11). Rayleigh analysis of the phase of peak PER2::LUC in the Hb in vitro during the 24–48 h window after slice preparation revealed that peak phase was not significantly correlated with either ZT (Fig. 2A; n=25, r=0.105, P=0.759) or with time of culture preparation (Fig. 2B; r=0.333, P=0.064).
Fig. 1.

Circadian rhythms in PER2::LUC expression in Hb (A, B) and SCN (C) slice cultures. (A) Detrended PMT recording of PER2::LUC emission (counts per minute) in a Hb slice culture. Exposure to forskolin (10 μM) restarted oscillations. (B) Relative PER2::LUC bioluminescence in a Hb slice in the presence of 0.5 μM TTX. (C) PER2::LUC emission from an SCN slice culture. (E, F) Circadian characteristics of Hb slice cultures in control (n=34) and TTX containing medium (n=8), recorded in PMTs. There are no significant differences in period (D), amplitude (E) or rate of damping (F) following culture with 0.5 μM TTX.
Fig. 2.

Rayleigh vector plots showing the phase of peak PER2::LUC expression in vitro recorded in PMTs, calculated as the time of peak bioluminescence after culture preparation or geographical ZT, in Hb and SCN slice cultures prepared at different times throughout the LD cycle. The phase of peak PER2::LUC expression in the Hb is not correlated with ZT (A) or time after culture preparation (B), while in the SCN it is correlated with ZT (C) but not time after culture preparation (D). Filled circles indicate the phase of peak bioluminescence in individual slice cultures. Direction of arrow indicates the mean phase vector, its length indicates the significance of phase clustering, with the surrounding box indicating the variance of phase. The inner broken line indicates the significance threshold of P=0.05.
To assess the autonomy of PER2 rhythms in the Hb, we impaired action potential-dependent synaptic communication between cells with TTX. 0.5 μM TTX, a concentration which completely inhibits action potential production in the LHb (data not shown), did not alter PER2::LUC bioluminescence rhythms (Fig. 1B). Seventy five percent of Hb slices in TTX-containing media (6/8) displayed circadian rhythmicity, comparable to the percentage of rhythmic slices in non-TTX recording media (74%). The period of slices in TTX-containing media was 23.18±1.5 h, mean duration before damping was 1.6±0.2 cycles and the amplitude was 99±12.3 counts per minute (cpm). None of these circadian parameters were significantly different to those recorded from cultures maintained in normal medium (Fig. 1D–F; all P>0.05; unpaired t-test). The effects of forskolin stimulation persisted when the culture medium also contained 0.5 μM TTX, indicating that this action is also independent of sodium-dependent action potentials (Fig. 1B).
Circadian rhythms of PER2::LUC bioluminescence in the SCN
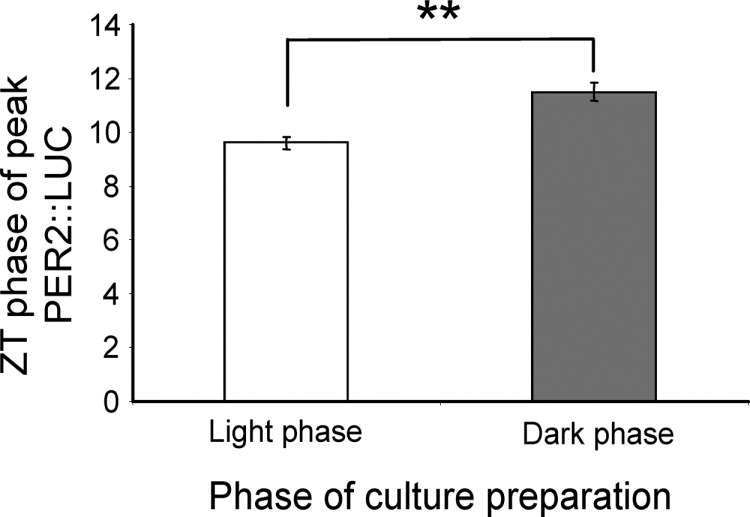
PMT recordings of PER2::LUC bioluminescence expression from SCN cultures (n=9) were all rhythmic, with peak bioluminescence at ZT10.9±0.4 and a mean period of 23.8±0.25 h (Fig. 1C). There was no significant difference in estimated period between SCN and Hb cultures recorded in PMTs (P>0.05) probably due to the variability of period between Hb slices, however, oscillations of PER2::LUC bioluminescence in the SCN were of significantly higher amplitude than in the Hb (SCN mean amplitude: 3995±660 cpm, Hb mean amplitude 119±15 cpm; P<0.00001) and were maintained for the full 7 days of recording, by which time oscillations had not damped to baseline (Fig. 1C). Rayleigh analysis revealed that peak phase of PER2::LUC expression was robustly correlated with ZT (Fig. 2C; n=9, r=0.948, P<0.00001) and not with time of culture preparation (Fig. 2D; r=0.0366, P=0.358). However, consistent with Yoshikawa et al. (2005), while peak phase did not correlate with a specific time after culture preparation, there was a significant effect of time of day of culture on the phase of PER2 expression: cultures prepared in the day consistently peaked earlier (Suppl. Fig. S3, peak phase 9.6±0.23 h) than those prepared at night (peak phase 11.5±0.33 h, P<0.01 versus day).
Circadian rhythms of PER2::LUC bioluminescence visualized in the epithalamus
To determine the anatomical location of PER2::LUC expression within the Hb complex, whole Hb slice cultures were imaged in real time with an EM-CCD camera. PER2::LUC expression was consistently visualized in the medial portion of the LHb (LHbM), in a central band radiating into the lateral portion of the LHb (LHbL) and in the ependymal cell layer lining the walls of the dorsal third ventricle (Fig. 3A, Movie 1). PER2::LUC bioluminescence was also observed in the MHb, adjacent to the dorsal third ventricle, though levels of expression here were much lower than in the LHb or ependymal cell layer.
Fig. 3.

PER2::LUC expression in the habenula and ependymal cell layer. (A) EM-CCD images overlaid on a transmitted light image from a Hb slice culture, illustrating PER2::LUC bioluminescence (green) in the LHb and ependymal cell layer. Inset highlights single cells. Calibration bar 250 μm. Plots of relative PER2::LUC expression delineated in the (B) ependymal cell layer, (C) LHb, (E) MHb and, (D) integrated across the whole Hb culture. (F) Bioluminescence emission from representative individual cells in the LHbM. (G) Rayleigh vector plots showing the phase of peak PER2::LUC expression in vitro in the LHb and ependymal cell layer (green) calculated as the time of peak bioluminescence after culture preparation or ZT. Filled circles indicate the peak phase of individual slice (n=10).
Continuous recordings of PER2::LUC activity were made from 11 slices for up to 10 days in vitro. Circadian oscillations of PER2::LUC bioluminescence were observed in the LHb in 10 cultures and in the ependymal layer in 8. (Fig. 3, Movie 1). The average period of oscillations differed significantly between the LHb and the ependymal cell layer (LHb: 21.3±0.5 h, ependymal: 23.9±0.9 h; P<0.05, t-test; Fig. 4F). This near 24 h periodicity in epithalamic ependymal cells is similar to that observed in mediobasal hypothalamic ependymal cells (Guilding et al., 2009). In the MHb, very weakly rhythmic temporal expression of PER2::LUC bioluminescence was observed in 5 of 11 cultures, and appeared linked to the waves of expression radiating up the ependymal cell layer (period 24±0.9 h; Movie 1, Figs. 3 and 4), and hence may reflect expression in ependymal tanycytes projecting into this structure (Cupedo and de Weerd, 1985). Forskolin treatment restarted damped rhythms in the ependymal cell layer to a much greater extent than in the LHb (Fig. 3), highlighting potential functional differences between these two oscillators.
Fig. 4.

Circadian expression of PER2::LUC in the Hb complex persists in the presence of TTX (0.5 μM). Plots of relative PER2::LUC expression in slices cultured with TTX, delineated in the (A) ependymal cell layer, (B) LHb, (C) integrated across the whole Hb complex and (D) MHb. (E) Bioluminescence emission from individual cells in the LHbM. (F) Period of circadian oscillations in the ependymal cell layer, LHb and in single cells in the LHb in slices cultured in control (n=11) or TTX (n=3) medium. * P<0.05, ** P<0.01 versus the ependymal cell layer.
Rayleigh vector plots of peak PER2::LUC bioluminescence indicated that the phase of the circadian rhythms did not correlate with ZT or the time after culture preparation in either the LHb (Fig. 1G; ZT: r=0.485, P=0.096, time after culture: r=0.281. P=0.457) or the ependymal cell layer (Fig. 1G; ZT: r=0.258, P=0.519, time after culture: r=0.269, P=0.491). While the small area of the ependymal layer generates clear circadian oscillations, the larger area of the LHb contributes most to the overall bioluminescence rhythm from the whole slice culture, demonstrated by the identical phasing of PER2::LUC rhythms in the LHb and in the whole tissue area (Fig. 3C, D). Single cells were visible in the LHbM in five of our recordings. Of 69 cells discriminated, 91% were rhythmic, with an average period of 22.2±0.2 h (Figs. 3F and 4F). The phases of peak PER2::LUC expression (measured at 24–48 h after culture) in single cells were significantly clustered in each individual slice (all P<0.05; Rayleigh analysis), which presumably underlies the whole tissue rhythmicity at this time. Very occasionally, faint cells were observed in the MHb; however these could not be tracked because luminescence here was at the edge of our detection limits (see Movie 1).
To examine the autonomy of molecular timekeeping in individual regions and cells from action potential dependent synaptic communication, we imaged Hb slice cultures in the presence of 0.5 μM TTX (n=3). Both the LHb and ependymal cell layer continued to display circadian rhythmicity following impairment of synaptic communication, with periods similar to those recorded in non-TTX treated slices (LHb: 21.9±0.07, ependymal: 23.9±0.15 h; P>0.05), yet still significantly different from each other (P<0.01, unpaired t-test, Fig. 4F). The weak oscillations in the MHb persisted in the presence of TTX, once again closely associated with the oscillations observed in the ependymal cell layer. Individual cells were visible in the LHbM in all of these recordings. Of 45 cells discriminated, 89% were rhythmic, with an average period of 22.4±0.14 h (Fig. 4F). These cells continued to express circadian rhythms for up to 9 days (the maximum duration of recordings), indicating that single cells are sustained oscillators which do not rely on sodium dependent synaptic communication for the maintenance of rhythms.
Circadian variation in spontaneous discharge activity in the LHbM
To determine if rhythmic expression of PER2::LUC in the Hb was accompanied by circadian variation in spontaneous discharge activity, population and single cell electrical activity were recorded extracellularly in the LHbM for at least 48 h in vitro. Consistent with previous studies in guinea-pig and rat LHb (Wilcox et al., 1988; Kim and Chang, 2005; Zhao and Rusak, 2005), we found neurons here to be spontaneously active. At least one distinct daily peak in firing rate activity was observed in 18/21 slices (Fig. 5A); the remaining three slices displayed clear spontaneous electrical activity, but no discernable individual daily peaks. Rayleigh analysis of the timing of multi- and single unit peak firing showed that there was no significant clustering of peak cellular discharge in relation to ZT (n=18, r=0.215, P=0.437; Fig. 5F), though more slices peaked during the night (n=12/21; Fig. 5) than during the day (n=6/21; Fig. 5).
Circadian oscillations were detected in multiunit discharge in five recordings (Fig. 5C; estimated mean period 24.0±2.0 h). Based on waveform shape, principal components-based clustering, and the presence of a clear refractory period in the interspike interval histogram, 22 single cells were discriminated offline from all recordings. These single cells fired spontaneously with a regular pattern of activity and tended to show only one peak in firing activity (Fig. 5B, D). This differs from SCN where cellular rhythms, although damping, can be monitored for up to 96 h in vitro (Brown et al., 2006).
Discussion
Many cognitive and reproductive behaviors modulated by the Hb show circadian variations (Sutherland, 1982; Ralph et al., 2002; Hikosaka et al., 2008). Zhao and Rusak (2005) reported that rat LHb neurons show a circadian rhythm in spontaneous electrical activity when isolated from the SCN, but the potential molecular timekeeping properties of rodent Hb were unknown. Here we provide the first evidence of rhythmic clock gene expression in the Hb, localizing circadian oscillations in PER2::LUC bioluminescence to single cells in the LHb. We provide evidence of a functional output of these oscillations with the demonstration of circadian rhythms in neuronal excitability in a proportion of LHbM recordings. Further, we show circadian oscillations in PER2::LUC expression in the ependymal cell layer of the dorsal third ventricle. Circadian oscillations in the Hb complex do not appear to depend on action potential production since they persist in TTX-containing medium. Whole tissue rhythms, however, damp over time, as we and others have previously observed in other extra-SCN brain oscillators (Abe et al., 2002; Guilding et al., 2009; Wang et al., 2009), indicating that inputs from a master circadian oscillator and/or external cues are needed to maintain co-ordination of individual cellular rhythms and hence a coherent, high amplitude, tissue rhythm. The clear difference in the expression of PER2::LUC between the MHb and LHb further substantiates the view that these two regions of the Hb complex are anatomically and functionally very different in vertebrates (Amo et al., 2010; Zhao and Rusak, 2005; Quina et al., 2009).
Previous studies of rhythmicity in the Hb have utilized c-FOS as a marker of cellular activity. A daily rhythm of c-FOS immunoreactivity was observed in hamster and mouse LHbM, with significantly higher levels observed in the dark phase (Tavakoli-Nezhad and Schwartz, 2006). An earlier study in rat, however, found higher c-FOS in the light phase, indicating a possible species difference in circadian functioning in the LHbM (Chastrette et al., 1991). While one study has noted the presence of per1 and per2 mRNA in the rat MHb (Shieh, 2003), only one published study has investigated clock gene protein expression in the Hb, and did not detect either PER1 or PER2 protein expression in the hamster Hb (Tavakoli-Nezhad and Schwartz, 2006). We demonstrate for the first time that PER2 is rhythmically expressed in the LHb in mouse, and that this expression shows clear circadian variation and persists in isolation from the SCN.
Initial assessment of PER2::LUC rhythms in the Hb complex as a whole, revealed major differences in strength, robustness and phase compared to rhythms in the SCN; the SCN maintains high amplitude rhythms for the length of recordings, while rhythms in the Hb complex are of lower amplitude and damp rapidly. However, once individual regions were visualized and delineated, it became apparent that there are at least two different oscillators in the Hb complex, one localized to the LHb and one to the ependymal cell layer. Since these oscillators are randomly phased with respect to one another and have different periods, rhythm amplitudes observed in the Hb complex in PMTs, or when the whole area is delineated from images, are naturally reduced as compared to assessment of the individual areas separately (see Fig. 3). Interestingly, PER2::LUC rhythms in the LHb, ependymal cell layer and in single LHb cells were maintained after impairment of synaptic communication with TTX, indicating that individual cells can function as autonomous cellular oscillators. Continued cycling of individual cells in the presence of TTX, though with lower amplitudes, is a feature of SCN neurons (Yamaguchi et al., 2003) and of neurons in other recently described extra-SCN oscillators (Guilding et al., 2009).
Brain tissue differs in its phase-resetting properties after culture, related to the strength and characteristics of the endogenous circadian oscillators. In mice held under LD cycles, the SCN maintains a coherent phase locked to ZT when explanted in vitro (Fig. 2C). While this phase is not correlated to the specific time of culture (Fig. 2D), it is affected by it; slices prepared in the light phase peaked significantly earlier than those prepared in the dark phase (Suppl. Fig. S3). These data corroborate a comprehensive study by Yoshikawa and colleagues (2005), who demonstrated that the time of peak per1::luc expression in the SCN was delayed when cultures from rats previously held under a LD cycle were prepared in the night or early day versus the middle of the day.
In our study, the phase of oscillations in the Hb in vitro is not significantly correlated to ZT (Fig. 2A) or time after culture preparation (Fig. 2B), however, the correlation with time after culture preparation approached significance in PMTs (P=0.064), hence a larger sample size could conceivably reveal a significant effect. The phasing of the oscillations in vitro may result from complex interactions between the in vivo phase and resetting stimuli from the culture process. Extra-SCN tissues display a range of phase resetting responses following culture: explants of olfactory bulb from rat show random phase distribution of peak per1::luc bioluminescence, while other tissues from per1::luc rats are either unaffected or completely reset by culturing procedures (Abraham et al., 2005; Yoshikawa et al., 2005). Further, cultures from PER2::LUC mice containing the arcuate or dorsomedial nuclei of the hypothalamus are consistently reset by culturing procedures (Guilding et al., 2009).
A circadian rhythm in discontinuously sampled spontaneous neuronal discharge in the LHb both in vivo and in vitro was recorded in rat (Zhao and Rusak, 2005). In both settings, cells displayed peak firing rates during the projected day phase, similar to that observed in the SCN. We found circadian rhythms in population cell firing in 24% of our recordings from the LHbM in vitro, suggesting that in the mouse, the PER2 oscillator is weakly coupled to the electrical excitability of these neurons, although consistent with other tissues and cells, determining how rhythms in PER2::LUC relate to rhythms in physiological function remains to be determined. Unlike the study in rat, we did not see a consistent phase of peak cell firing in the day (Zhao and Rusak, 2005). Indeed a larger number of our slices peaked during the dark phase, corresponding with the phase of peak firing observed in many other extra-SCN brain regions (Inouye and Kawamura, 1979; Inouye, 1983). The discrepancies between these studies may result from the different preparation or sampling techniques used, or as seen for c-FOS rhythms, may be due to species differences in circadian physiology in the LHb (Chastrette et al., 1991; Tavakoli-Nezhad and Schwartz, 2006).
The transient and varied MUA rhythms detected in the mouse LHb in vitro contrasts with MUA recorded in the mouse and rat SCN where many neurons are capable of sustaining synchronized electrical rhythms in vitro for up to 96 h (Gribkoff et al., 1998; Albus et al., 2002; Brown et al., 2005, 2006). There are a number of possible explanations for this. One, the molecular oscillator in LHb neurons may only weakly target the membrane properties of these neurons such that many cells lack the unique intrinsic rhythm generation properties of SCN neurons (Brown and Piggins, 2007; Belle et al., 2009). Two, the anatomy of the LHb may isolate groups of cells and thus impede global synchronization of neuronal activity. The rat LHb has a complex anatomical organization (Geisler et al., 2003) and if organization of the mouse LHb approximates this then it is likely that there are distinct clusters of LHbM cells. In our investigations, we aimed our recording pipette in the LHbM, but it is probable that we monitored electrical activity from different LHbM cell populations in different slices and this may account for the heterogeneity in these MUA recordings. Three, the axons of LHb neurons project outside of the LHb and do not seem to have local collaterals (Kim and Chang, 2005), hence individual LHb cells may lack the coordinating activities present in SCN neuronal networks. At present it is not clear if one or all of these possibilities can account for the varied MUA in the LHbM and further experiments are required to resolve this.
The function of a circadian oscillator in the Hb is not known, although many behaviors which are modulated by the Hb such as sleep/wake cycles, stress responses, reproductive behaviors, pain responses, and reward-related learning show circadian variations (Chastrette et al., 1991; Corodimas et al., 1992; Haun et al., 1992; Landis et al., 1993; Nagao et al., 1993; Perissin et al., 2003; Matsumoto and Hikosaka, 2007; Webb et al., 2009). The Hb expresses receptors for neuropeptides associated with SCN efferents (Hernando et al., 2001; Cheng et al., 2006) as well as melatonin binding sites (Weaver et al., 1989), and retinal efferents arising from mRGCs innervate the LHb region (Hattar et al., 2006), indicating that photic and SCN-controlled output signals can regulate Hb cellular activity. Indeed, hamsters with split behavioral rhythms resulting from constant lighting conditions show asymmetrical c-FOS expression in the SCN and in the LHbM (Tavakoli-Nezhad and Schwartz, 2005). The Hb in turn projects to the pineal gland and raphe nuclei (Wang and Aghajanian, 1977; Herkenham and Nauta, 1979; Ronnekleiv and Moller, 1979; Araki et al., 1988), both of which are important for circadian timekeeping (Morin, 1999). Moreover, the raphe nuclei are implicated in major depression, an illness which can be precipitated or exacerbated by disruptions of circadian alignment through jet lag or shift work (American Psychiatric Association, 2000; Monteleone and Maj, 2008), and an expanding body of evidence highlights the functional importance of raphe-LHb pathways in major depression (Sartorius et al., 2010; Sartorius and Henn, 2007; Yang et al., 2008).
Of particular interest within our current data is the localization of individual cellular oscillators specifically to the LHbM. How the LHbM in mouse maps onto the Hb nuclei defined in rat (Andres et al., 1999; Geisler et al., 2003) remains to be determined. However, it appears to be this area, which expresses c-FOS in response to day-time but not night-time immobilization stress in rat (Chastrette et al., 1991), which exhibits a daily rhythm of c-FOS immunoreactivity in hamster and mouse (Tavakoli-Nezhad and Schwartz, 2006), and which expresses the asymmetrical c-FOS expression in response to splitting (Tavakoli-Nezhad and Schwartz, 2005). Further, this specific area receives the only major dopaminergic innervation into the Hb complex, which originates largely from the ventral tegmental area (VTA) (Herkenham and Nauta, 1977; Skagerberg et al., 1984; Gruber et al., 2007; Kowski et al., 2009). The LHb in turn projects to GABAergic neurons in the rostromedial tegmental nucleus (Jhou et al., 2009a). These neurons innervate VTA cells and negatively regulate dopaminergic neurons in the substantia nigra pars compacta (Jhou et al., 2009b), which are responsible for voluntary motor control and regulation of sleep patterns (Lima et al., 2007; Matsumoto and Hikosaka, 2007); suggesting a role for LHb-substantia nigra pathway in the circadian expression of voluntary locomotor activity and sleep/wake cycles. Indeed it is hypothesized that the LHb acts as a secondary oscillator regulating voluntary wheel-running in hamsters (Tavakoli-Nezhad and Schwartz, 2006).
Conclusion
In summary, the Hb appears well placed to integrate photic and circadian information, and relay this downstream to influence circadian modulated behaviors. Our data suggest that the LHb can fine tune this circadian information with an endogenous clock.
Acknowledgments
This work was supported by project grants from the Biotechnology and Biological Sciences Research Council (BBSRC) and the Wellcome Trust (WT086352) to H.D.P. We thank Rayna Samuels for technical assistance and The University of Manchester BSF staff for animal care.
Footnotes
Supplementary data associated with this article can be found, in the online version, at doi:10.1016/j.neuroscience.2010.06.015.
Supplementary data
Suppl. Fig. S1.

Suppl. Fig. S2.

Suppl. Fig. S3.
References
- Abe M., Herzog E.D., Yamazaki S., Straume M., Tei H., Sakaki Y., Menaker M., Block G.D. Circadian rhythms in isolated brain regions. J Neurosci. 2002;22:350–356. doi: 10.1523/JNEUROSCI.22-01-00350.2002. [DOI] [PMC free article] [PubMed] [Google Scholar]
- Abraham U., Prior J.L., Granados-Fuentes D., Piwnica-Worms D.R., Herzog E.D. Independent circadian oscillations of period 1 in specific brain areas in vivo and in vitro. J Neurosci. 2005;25:8620–8626. doi: 10.1523/JNEUROSCI.2225-05.2005. [DOI] [PMC free article] [PubMed] [Google Scholar]
- Albus H., Bonnefont X., Chaves I., Yasui A., Doczy J., van der Horst G.T., Meijer J.H. Cryptochrome-deficient mice lack circadian electrical activity in the suprachiasmatic nuclei. Curr Biol. 2002;12:1130–1133. doi: 10.1016/s0960-9822(02)00923-5. [DOI] [PubMed] [Google Scholar]
- American Psychiatric Association . 4th edn. American Psychiatric Association; Washington, DC: 2000. Diagnostic and statistical manual of mental disorders. [Google Scholar]
- Amo R., Aizawa H., Takahoko M., Kobayashi M., Takahashi R., Aoki T., Okamoto H. Identification of the zebrafish ventral habenula as a homolog of the mammalian lateral habenula. J Neurosci. 2010;30:1566–1574. doi: 10.1523/JNEUROSCI.3690-09.2010. [DOI] [PMC free article] [PubMed] [Google Scholar]
- Andres K.H., von During M., Veh R.W. Subnuclear organization of the rat habenular complexes. J Comp Neurol. 1999;407:130–150. doi: 10.1002/(sici)1096-9861(19990428)407:1<130::aid-cne10>3.0.co;2-8. [DOI] [PubMed] [Google Scholar]
- Araki M., McGeer P.L., Kimura H. The efferent projections of the rat lateral habenular nucleus revealed by the PHA-L anterograde tracing method. Brain Res. 1988;441:319–330. doi: 10.1016/0006-8993(88)91410-2. [DOI] [PubMed] [Google Scholar]
- Bechtold D.A., Brown T.M., Luckman S.M., Piggins H.D. Metabolic rhythm abnormalities in mice lacking VIP-VPAC2 signaling. Am J Physiol Regul Integr Comp Physiol. 2008;294:R344–R351. doi: 10.1152/ajpregu.00667.2007. [DOI] [PubMed] [Google Scholar]
- Belle M.D., Diekman C.O., Forger D.B., Piggins H.D. Daily electrical silencing in the mammalian circadian clock. Science. 2009;326:281–284. doi: 10.1126/science.1169657. [DOI] [PubMed] [Google Scholar]
- Brown T.M., Piggins H.D. Electrophysiology of the suprachiasmatic circadian clock. Prog Neurobiol. 2007;82:229–255. doi: 10.1016/j.pneurobio.2007.05.002. [DOI] [PubMed] [Google Scholar]
- Brown T.M., Hughes A.T., Piggins H.D. Gastrin-releasing peptide promotes suprachiasmatic nuclei cellular rhythmicity in the absence of vasoactive intestinal polypeptide-VPAC2 receptor signaling. J Neurosci. 2005;25:11155–11164. doi: 10.1523/JNEUROSCI.3821-05.2005. [DOI] [PMC free article] [PubMed] [Google Scholar]
- Brown T.M., Banks J.R., Piggins H.D. A novel suction electrode recording technique for monitoring circadian rhythms in single and multiunit discharge from brain slices. J Neurosci Methods. 2006;156:173–181. doi: 10.1016/j.jneumeth.2006.02.024. [DOI] [PubMed] [Google Scholar]
- Chastrette N., Pfaff D.W., Gibbs R.B. Effects of daytime and nighttime stress on Fos-like immunoreactivity in the paraventricular nucleus of the hypothalamus, the habenula, and the posterior paraventricular nucleus of the thalamus. Brain Res. 1991;563:339–344. doi: 10.1016/0006-8993(91)91559-j. [DOI] [PubMed] [Google Scholar]
- Cheng M.Y., Leslie F.M., Zhou Q.Y. Expression of prokineticins and their receptors in the adult mouse brain. J Comp Neurol. 2006;498:796–809. doi: 10.1002/cne.21087. [DOI] [PMC free article] [PubMed] [Google Scholar]
- Cooper H.M., Herbin M., Nevo E. Visual system of a naturally microphthalmic mammal: the blind mole rat, Spalax ehrenbergi. J Comp Neurol. 1993;328:313–350. doi: 10.1002/cne.903280302. [DOI] [PubMed] [Google Scholar]
- Corodimas K.P., Rosenblatt J.S., Morrell J.I. The habenular complex mediates hormonal stimulation of maternal behavior in rats. Behav Neurosci. 1992;106:853–865. doi: 10.1037//0735-7044.106.5.853. [DOI] [PubMed] [Google Scholar]
- Cupedo R.N., de Weerd H. Tanycytes in the medial habenular nucleus of the rat. Anat Embryol (Berl) 1985;172:7–10. doi: 10.1007/BF00318938. [DOI] [PubMed] [Google Scholar]
- Geisler S., Trimble M. The lateral habenula: no longer neglected. CNS Spectr. 2008;13:484–489. doi: 10.1017/s1092852900016710. [DOI] [PubMed] [Google Scholar]
- Geisler S., Andres K.H., Veh R.W. Morphologic and cytochemical criteria for the identification and delineation of individual subnuclei within the lateral habenular complex of the rat. J Comp Neurol. 2003;458:78–97. doi: 10.1002/cne.10566. [DOI] [PubMed] [Google Scholar]
- Granados-Fuentes D., Saxena M.T., Prolo L.M., Aton S.J., Herzog E.D. Olfactory bulb neurons express functional, entrainable circadian rhythms. Eur J Neurosci. 2004;19:898–906. doi: 10.1111/j.0953-816x.2004.03117.x. [DOI] [PMC free article] [PubMed] [Google Scholar]
- Gribkoff V.K., Pieschl R.L., Wisialowski T.A., van den Pol A.N., Yocca F.D. Phase shifting of circadian rhythms and depression of neuronal activity in the rat suprachiasmatic nucleus by neuropeptide Y: mediation by different receptor subtypes. J Neurosci. 1998;18:3014–3022. doi: 10.1523/JNEUROSCI.18-08-03014.1998. [DOI] [PMC free article] [PubMed] [Google Scholar]
- Gruber C., Kahl A., Lebenheim L., Kowski A., Dittgen A., Veh R.W. Dopaminergic projections from the VTA substantially contribute to the mesohabenular pathway in the rat. Neurosci Lett. 2007;427:165–170. doi: 10.1016/j.neulet.2007.09.016. [DOI] [PubMed] [Google Scholar]
- Guilding C., Piggins H.D. Challenging the omnipotence of the suprachiasmatic timekeeper: are circadian oscillators present throughout the mammalian brain? Eur J Neurosci. 2007;25:3195–3216. doi: 10.1111/j.1460-9568.2007.05581.x. [DOI] [PubMed] [Google Scholar]
- Guilding C., Hughes A.T., Brown T.M., Namvar S., Piggins H.D. A riot of rhythms: neuronal and glial circadian oscillators in the mediobasal hypothalamus. Mol Brain. 2009;2:28. doi: 10.1186/1756-6606-2-28. [DOI] [PMC free article] [PubMed] [Google Scholar]
- Guler A.D., Ecker J.L., Lall G.S., Haq S., Altimus C.M., Liao H.W., Barnard A.R., Cahill H., Badea T.C., Zhao H., Hankins M.W., Berson D.M., Lucas R.J., Yau K.W., Hattar S. Melanopsin cells are the principal conduits for rod-cone input to non-image-forming vision. Nature. 2008;453:102–105. doi: 10.1038/nature06829. [DOI] [PMC free article] [PubMed] [Google Scholar]
- Hatori M., Le H., Vollmers C., Keding S.R., Tanaka N., Buch T., Waisman A., Schmedt C., Jegla T., Panda S. Inducible ablation of melanopsin-expressing retinal ganglion cells reveals their central role in non-image forming visual responses. PLoS One. 2008;3:e2451. doi: 10.1371/journal.pone.0002451. [DOI] [PMC free article] [PubMed] [Google Scholar]
- Hattar S., Kumar M., Park A., Tong P., Tung J., Yau K.W., Berson D.M. Central projections of melanopsin-expressing retinal ganglion cells in the mouse. J Comp Neurol. 2006;497:326–349. doi: 10.1002/cne.20970. [DOI] [PMC free article] [PubMed] [Google Scholar]
- Haun F., Eckenrode T.C., Murray M. Habenula and thalamus cell transplants restore normal sleep behaviors disrupted by denervation of the interpeduncular nucleus. J Neurosci. 1992;12:3282–3290. doi: 10.1523/JNEUROSCI.12-08-03282.1992. [DOI] [PMC free article] [PubMed] [Google Scholar]
- Herkenham M., Nauta W.J. Afferent connections of the habenular nuclei in the rat: A horseradish peroxidase study, with a note on the fiber-of-passage problem. J Comp Neurol. 1977;173:123–146. doi: 10.1002/cne.901730107. [DOI] [PubMed] [Google Scholar]
- Herkenham M., Nauta W.J. Efferent connections of the habenular nuclei in the rat. J Comp Neurol. 1979;187:19–47. doi: 10.1002/cne.901870103. [DOI] [PubMed] [Google Scholar]
- Hernando F., Schoots O., Lolait S.J., Burbach J.P. Immunohistochemical localization of the vasopressin V1b receptor in the rat brain and pituitary gland: anatomical support for its involvement in the central effects of vasopressin. Endocrinology. 2001;142:1659–1668. doi: 10.1210/endo.142.4.8067. [DOI] [PubMed] [Google Scholar]
- Hikosaka O., Sesack S.R., Lecourtier L., Shepard P.D. Habenula: crossroad between the basal ganglia and the limbic system. J Neurosci. 2008;28:11825–11829. doi: 10.1523/JNEUROSCI.3463-08.2008. [DOI] [PMC free article] [PubMed] [Google Scholar]
- Hiler D.J., Bhattacherjee A., Yamazaki S., Tei H., Geusz M.E. Circadian mPer1 gene expression in mesencephalic trigeminal nucleus cultures. Brain Res. 2008;1214:84–93. doi: 10.1016/j.brainres.2008.03.041. [DOI] [PubMed] [Google Scholar]
- Hughes A.T.L., Guilding C., Lennox L., Samuels R.E., McMahon D.G., Piggins H.D. Live imaging of altered period 1 expression in the suprachiasmatic nuclei of Vipr2−/− mice. J Neurochem. 2008;106(4):1646–1657. doi: 10.1111/j.1471-4159.2008.05520.x. [DOI] [PMC free article] [PubMed] [Google Scholar]
- Inouye S.T. Does the ventromedial hypothalamic nucleus contain a self-sustained circadian oscillator associated with periodic feedings? Brain Res. 1983;279:53–63. doi: 10.1016/0006-8993(83)90162-2. [DOI] [PubMed] [Google Scholar]
- Inouye S.T., Kawamura H. Persistence of circadian rhythmicity in a mammalian hypothalamic “island” containing the suprachiasmatic nucleus. Proc Natl Acad Sci U S A. 1979;76:5962–5966. doi: 10.1073/pnas.76.11.5962. [DOI] [PMC free article] [PubMed] [Google Scholar]
- Jhou T.C., Fields H.L., Baxter M.G., Saper C.B., Holland P.C. The rostromedial tegmental nucleus (RMTg), a GABAergic afferent to midbrain dopamine neurons, encodes aversive stimuli and inhibits motor responses. Neuron. 2009;61:786–800. doi: 10.1016/j.neuron.2009.02.001. [DOI] [PMC free article] [PubMed] [Google Scholar]
- Jhou T.C., Geisler S., Marinelli M., Degarmo B.A., Zahm D.S. The mesopontine rostromedial tegmental nucleus: a structure targeted by the lateral habenula that projects to the ventral tegmental area of Tsai and substantia nigra compacta. J Comp Neurol. 2009;513:566–596. doi: 10.1002/cne.21891. [DOI] [PMC free article] [PubMed] [Google Scholar]
- Kim U., Chang S.Y. Dendritic morphology, local circuitry, and intrinsic electrophysiology of neurons in the rat medial and lateral habenular nuclei of the epithalamus. J Comp Neurol. 2005;483:236–250. doi: 10.1002/cne.20410. [DOI] [PubMed] [Google Scholar]
- Kowski A.B., Veh R.W., Weiss T. Dopaminergic activation excites rat lateral habenular neurons in vivo. Neuroscience. 2009;161:1154–1165. doi: 10.1016/j.neuroscience.2009.04.026. [DOI] [PubMed] [Google Scholar]
- Landis C.A., Collins B.J., Cribbs L.L., Sukhatme V.P., Bergmann B.M., Rechtschaffen A., Smalheiser N.R. Expression of Egr-1 in the brain of sleep deprived rats. Brain Res Mol Brain Res. 1993;17:300–306. doi: 10.1016/0169-328x(93)90015-h. [DOI] [PubMed] [Google Scholar]
- Lecourtier L., Kelly P.H. A conductor hidden in the orchestra?: Role of the habenular complex in monoamine transmission and cognition. Neurosci Biobehav Rev. 2007;31:658–672. doi: 10.1016/j.neubiorev.2007.01.004. [DOI] [PubMed] [Google Scholar]
- Lima M.M., Andersen M.L., Reksidler A.B., Vital M.A., Tufik S. The role of the substantia nigra pars compacta in regulating sleep patterns in rats. PLoS One. 2007;2:e513. doi: 10.1371/journal.pone.0000513. [DOI] [PMC free article] [PubMed] [Google Scholar]
- Matsumoto M., Hikosaka O. Lateral habenula as a source of negative reward signals in dopamine neurons. Nature. 2007;447:1111–1115. doi: 10.1038/nature05860. [DOI] [PubMed] [Google Scholar]
- Monteleone P., Maj M. The circadian basis of mood disorders: recent developments and treatment implications. Eur Neuropsychopharmacol. 2008;18:701–711. doi: 10.1016/j.euroneuro.2008.06.007. [DOI] [PubMed] [Google Scholar]
- Morin L.P. Serotonin and the regulation of mammalian circadian rhythmicity. Ann Med. 1999;31:12–33. doi: 10.3109/07853899909019259. [DOI] [PubMed] [Google Scholar]
- Nagao M., Kamo H., Akiguchi I., Kimura J. Induction of c-Fos-like protein in the lateral habenular nucleus by persistent noxious peripheral stimulation. Neurosci Lett. 1993;151:37–40. doi: 10.1016/0304-3940(93)90039-n. [DOI] [PubMed] [Google Scholar]
- Paxinos G., Franklin K.B. Academic Press; Sydney: 2001. The mouse brain in stereotaxic coordinates. [Google Scholar]
- Perissin L., Facchin P., Porro C.A. Tonic pain response in mice: effects of sex, season and time of day. Life Sci. 2003;72:897–907. doi: 10.1016/s0024-3205(02)02344-5. [DOI] [PubMed] [Google Scholar]
- Qu T., Dong K., Sugioka K., Yamadori T. Demonstration of direct input from the retina to the lateral habenular nucleus in the albino rat. Brain Res. 1996;709:251–258. doi: 10.1016/0006-8993(95)01306-7. [DOI] [PubMed] [Google Scholar]
- Quina L.A., Wang S., Ng L., Turner E.E. Brn3a and Nurr1 mediate a gene regulatory pathway for habenula development. J Neurosci. 2009;29:14309–14322. doi: 10.1523/JNEUROSCI.2430-09.2009. [DOI] [PMC free article] [PubMed] [Google Scholar]
- Ralph M.R., Ko C.H., Antoniadis E.A., Seco P., Irani F., Presta C., McDonald R.J. The significance of circadian phase for performance on a reward-based learning task in hamsters. Behav Brain Res. 2002;136:179–184. doi: 10.1016/s0166-4328(02)00131-6. [DOI] [PubMed] [Google Scholar]
- Rollag M.D., Berson D.M., Provencio I. Melanopsin, ganglion-cell photoreceptors, and mammalian photoentrainment. J Biol Rhythms. 2003;18:227–234. doi: 10.1177/0748730403018003005. [DOI] [PubMed] [Google Scholar]
- Ronnekleiv O.K., Moller M. Brain-pineal nervous connections in the rat: an ultrastructure study following habenular lesion. Exp Brain Res. 1979;37:551–562. doi: 10.1007/BF00236823. [DOI] [PubMed] [Google Scholar]
- Rusak B., Zucker I. Neural regulation of circadian rhythms. Physiol Rev. 1979;59:449–526. doi: 10.1152/physrev.1979.59.3.449. [DOI] [PubMed] [Google Scholar]
- Sartorius A., Henn F.A. Deep brain stimulation of the lateral habenula in treatment resistant major depression. Med Hypotheses. 2007;69:1305–1308. doi: 10.1016/j.mehy.2007.03.021. [DOI] [PubMed] [Google Scholar]
- Sartorius A., Kiening K.L., Kirsch P., von Gall C.C., Haberkorn U., Unterberg A.W., Henn F.A., Meyer-Lindenberg A. Remission of major depression under deep brain stimulation of the lateral habenula in a therapy-refractory patient. Biol Psychiatry. 2010;67:e9–e11. doi: 10.1016/j.biopsych.2009.08.027. [DOI] [PubMed] [Google Scholar]
- Shieh K.R. Distribution of the rhythm-related genes rPERIOD1, rPERIOD2, and rCLOCK, in the rat brain. Neuroscience. 2003;118:831–843. doi: 10.1016/s0306-4522(03)00004-6. [DOI] [PubMed] [Google Scholar]
- Skagerberg G., Lindvall O., Bjorklund A. Origin, course and termination of the mesohabenular dopamine pathway in the rat. Brain Res. 1984;307:99–108. doi: 10.1016/0006-8993(84)90465-7. [DOI] [PubMed] [Google Scholar]
- Sutherland R.J. The dorsal diencephalic conduction system: a review of the anatomy and functions of the habenular complex. Neurosci Biobehav Rev. 1982;6:1–13. doi: 10.1016/0149-7634(82)90003-3. [DOI] [PubMed] [Google Scholar]
- Tavakoli-Nezhad M., Schwartz W.J. c-Fos expression in the brains of behaviorally “split” hamsters in constant light: calling attention to a dorsolateral region of the suprachiasmatic nucleus and the medial division of the lateral habenula. J Biol Rhythms. 2005;20:419–429. doi: 10.1177/0748730405278443. [DOI] [PMC free article] [PubMed] [Google Scholar]
- Tavakoli-Nezhad M., Schwartz W.J. Hamsters running on time: is the lateral habenula a part of the clock? Chronobiol Int. 2006;23:217–224. doi: 10.1080/07420520500521947. [DOI] [PubMed] [Google Scholar]
- Wang L.M., Dragich J.M., Kudo T., Odom I.H., Welsh D.K., O'Dell T.J., Colwell C.S. Expression of the circadian clock gene period 2 in the hippocampus: possible implications for synaptic plasticity and learned behaviour. ASN Neuro. 2009;1 pii:e00012. doi: 10.1042/AN20090020. [DOI] [PMC free article] [PubMed] [Google Scholar]
- Wang R.Y., Aghajanian G.K. Physiological evidence for habenula as major link between forebrain and midbrain raphe. Science. 1977;197:89–91. doi: 10.1126/science.194312. [DOI] [PubMed] [Google Scholar]
- Weaver D.R., Rivkees S.A., Reppert S.M. Localization and characterization of melatonin receptors in rodent brain by in vitro autoradiography. J Neurosci. 1989;9:2581–2590. doi: 10.1523/JNEUROSCI.09-07-02581.1989. [DOI] [PMC free article] [PubMed] [Google Scholar]
- Webb I.C., Baltazar R.M., Lehman M.N., Coolen L.M. Bidirectional interactions between the circadian and reward systems: is restricted food access a unique zeitgeber? Eur J Neurosci. 2009;30:1739–1748. doi: 10.1111/j.1460-9568.2009.06966.x. [DOI] [PubMed] [Google Scholar]
- Wilcox K.S., Gutnick M.J., Christoph G.R. Electrophysiological properties of neurons in the lateral habenula nucleus: an in vitro study. J Neurophysiol. 1988;59:212–225. doi: 10.1152/jn.1988.59.1.212. [DOI] [PubMed] [Google Scholar]
- Yamaguchi S., Isejima H., Matsuo T., Okura R., Yagita K., Kobayashi M., Okamura H. Synchronization of cellular clocks in the suprachiasmatic nucleus. Science. 2003;302:1408–1412. doi: 10.1126/science.1089287. [DOI] [PubMed] [Google Scholar]
- Yang L.M., Hu B., Xia Y.H., Zhang B.L., Zhao H. Lateral habenula lesions improve the behavioral response in depressed rats via increasing the serotonin level in dorsal raphe nucleus. Behav Brain Res. 2008;188:84–90. doi: 10.1016/j.bbr.2007.10.022. [DOI] [PubMed] [Google Scholar]
- Yoo S.H., Yamazaki S., Lowrey P.L., Shimomura K., Ko C.H., Buhr E.D., Siepka S.M., Hong H.K., Oh W.J., Yoo O.J., Menaker M., Takahashi J.S. PERIOD2::LUCIFERASE real-time reporting of circadian dynamics reveals persistent circadian oscillations in mouse peripheral tissues. Proc Natl Acad Sci U S A. 2004;101:5339–5346. doi: 10.1073/pnas.0308709101. [DOI] [PMC free article] [PubMed] [Google Scholar]
- Yoshikawa T., Yamazaki S., Menaker M. Effects of preparation time on phase of cultured tissues reveal complexity of circadian organization. J Biol Rhythms. 2005;20:500–512. doi: 10.1177/0748730405280775. [DOI] [PMC free article] [PubMed] [Google Scholar]
- Zhao H., Rusak B. Circadian firing-rate rhythms and light responses of rat habenular nucleus neurons in vivo and in vitro. Neuroscience. 2005;132:519–528. doi: 10.1016/j.neuroscience.2005.01.012. [DOI] [PubMed] [Google Scholar]
Associated Data
This section collects any data citations, data availability statements, or supplementary materials included in this article.