Abstract
Double minutes (dmin) and homogeneously staining regions (hsr) are the cytogenetic hallmarks of genomic amplification in cancer. Different mechanisms have been proposed to explain their genesis. Recently, our group showed that the MYC-containing dmin in leukemia cases arise by excision and amplification (episome model). In the present paper we investigated 10 cell lines from solid tumors showing MYCN amplification as dmin or hsr. Particularly revealing results were provided by the two subclones of the neuroblastoma cell line STA-NB-10, one showing dmin-only and the second hsr-only amplification. Both subclones showed a deletion, at 2p24.3, whose extension matched the amplicon extension. Additionally, the amplicon structure of the dmin and hsr forms was identical. This strongly argues that the episome model, already demonstrated in leukemias, applies to solid tumors as well, and that dmin and hsr are two faces of the same coin. The organization of the duplicated segments varied from very simple (no apparent changes from the normal sequence) to very complex. MYCN was always overexpressed (significantly overexpressed in three cases). The fusion junctions, always mediated by nonhomologous end joining, occasionally juxtaposed truncated genes in the same transcriptional orientation. Fusion transcripts involving NBAS (also known as NAG), FAM49A, BC035112 (also known as NCRNA00276), and SMC6 genes were indeed detected, although their role in the context of the tumor is not clear.
Overexpression of cellular oncogenes, a common theme in cancer, can result from gene amplification through the formation of extrachromosomal double minutes (dmin) or intrachromosomal homogeneously staining regions (hsr). Their occurrence has been more frequently reported in solid tumors compared with hematological malignancies. Some oncogene amplifications are associated with specific tumors and usually represent an indicator of poor prognosis (Albertson 2006; Myllykangas et al. 2007).
The breakage-fusion-bridge (BFB) cycle is one of the most popular models invoked to explain intrachromosomal amplification in solid tumors (Hellman et al. 2002; Selvarajah et al. 2006; Reshmi et al. 2007; Vukovic et al. 2007). In this model, as originally proposed by McClintock (1951), multiple cycles of BFB lead to the amplification of genes near the breakage. This feature can be regarded as a specific indication of BFB. A translocation-deletion-amplification model has been also demonstrated in some tumors (Barr et al. 1996; Roijer et al. 2002; Van Roy et al. 2006). In this model, dmin or hsr derive from the breakpoint region of a translocation event. The “deletion-plus-episome” model, also known as the “episome model,” postulates that a DNA segment is excised from an otherwise intact chromosome, circularized, and amplified by mutual recombination to produce dmin or hsr (Carroll et al. 1988). We have recently provided definitive evidence in favor of the episome model for the formation of MYC-containing dmin in acute myeloid leukemia (Storlazzi et al. 2006).
In this study we investigated the structure of MYCN amplifications, examples of both dmin and hsr, in eight neuroblastoma (NB) and two small cell lung carcinoma (SCLC) cell lines.
Results
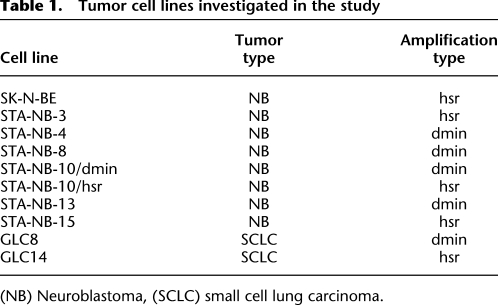
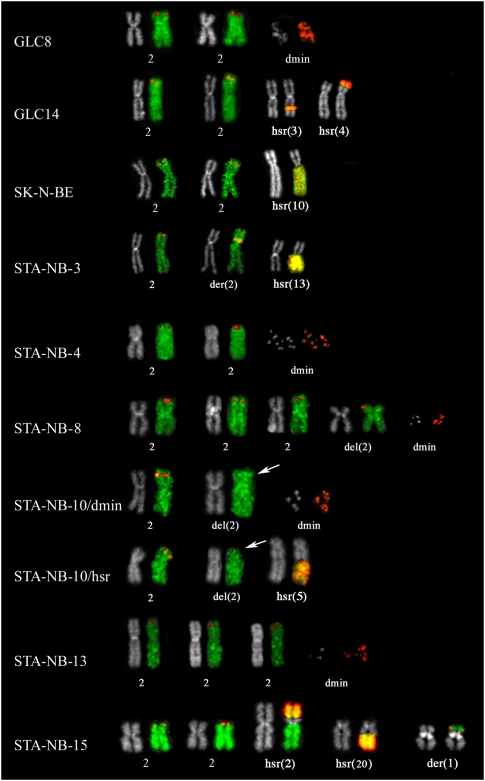
The 10 cell lines under study are reported in Table 1. Appropriate fluorescence in situ hybridization (FISH) experiments disclosed that in five cell lines MYCN was amplified as dmin, and in the remaining five as hsr (Fig. 1; Table 1). The MYCN gene was deleted in one chromosome 2 homolog in both subclones of the STA-NB-10 neuroblastoma cell line (Fig. 1). No MYCN deletion was detected in the remaining cell lines, nor were rearrangements at the MYCN locus noticed.
Table 1.
Tumor cell lines investigated in the study
(NB) Neuroblastoma, (SCLC) small cell lung carcinoma.
Figure 1.
Partial metaphases showing cohybridization FISH experiments using WCP specific for chromosome 2 (green) and RP11-480N14 (chr2:15,999,497–16,004,580), containing the MYCN gene (red). GLC8, STA-NB-4, STA-NB-8, STA-NB-10/dmin, and STA-NB-13 showed MYCN amplification in form of dmin (example provided at right). The remaining cell lines displayed hsr amplification in a single location (SK-N-BE, STA-NB-10/hsr) or in multiple locations (GLC14, STA-NB-3, STA-NB-15). Note the absence of the RP11-480N14 signal on one of the two chromosomes 2 in STA-NB-10 clones (arrows).
Structure of amplicons
MYCN and the partially overlapping MYCNOS were the only genes always involved in the amplification by oligo-array comparative genomic hybridization (CGH) analysis (NimbleGen whole-genome, 385 K platform; average oligo distance ∼6.3 kb; Supplemental Figs. 1, 2). FISH with fosmid and BAC probes (listed in Supplemental Table 1) showed that a single hsr was present in two cell lines (SK-N-BE and STA-NB-10/hsr), while two distinct hsr were present in STA-NB-3, STA-NB-15, and GCL14 (Fig. 1). Some amplicons were discontinuous, and the amplification levels of some segments were remarkably different. Notably, in STA-NB-8, FISH provided a clear confirmation of the heterogeneity of amplicon composition suggested by the oligo-CGH analysis (example in Supplemental Fig. 3).
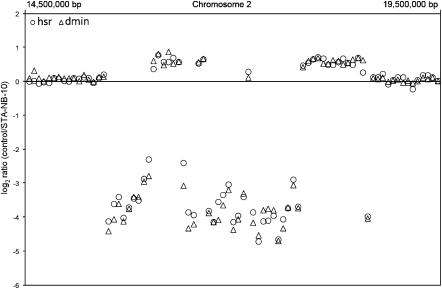
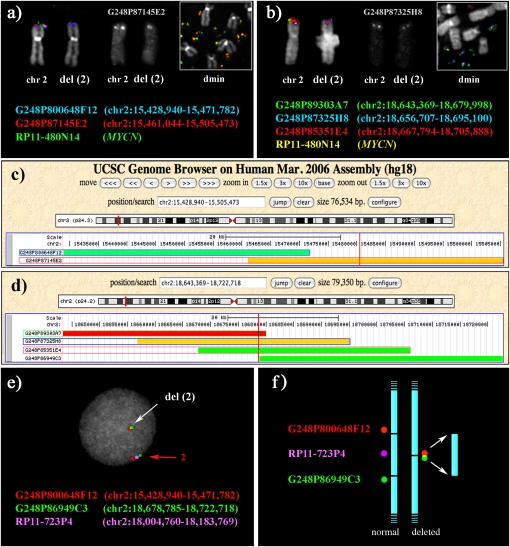
The amplicon structure of the two STA-NB-10 subclones was identical in extent (chr2:15,510–18,630 kb; 3.12 Mb in size), and the identical alternation of amplified and nonamplified segments (Fig. 2) strongly suggested that they were the same amplification. The nonamplified segments internal to the amplicon were shown to be single copies (Fig. 2). All clones mapping inside the 3.12-Mb amplicon of STA-NB-10 failed to yield signals on one chromosome 2 of both subclones (fluorescent in situ hybridization [FISH] examples in Fig. 3). They also failed to detect any signal, in STA-NB-10/dmin, on chromosome 5q at the site of hsr insertion in STA-NB-10/hsr (Fig. 1). Probes mapping at the boundary of this amplicon defined the deletion as spanning, approximately, the region chr2:15,483–18,575 kb (see Fig. 3 and legend).
Figure 2.
Details of array CGH data (chr2:14,500,000–19,500,000) related to both STA-NB-10/dmin (triangles) and STA-NB-10/hsr (circles) subclones. The pattern of amplified/nonamplified regions perfectly overlaps. Note also that the nonamplified regions, internal to the amplicon, are present in single copy.
Figure 3.
Definition of the boundaries of the deletion on chromosome 2 present in the cell line STA-NB-10/dmin using FISH. (a,b) Partial metaphases showing examples of FISH experiments using fosmid probes spanning the distal (a) and proximal (b) breakpoints of the deleted region, cohybridized with the BAC containing the MYCN gene. (c,d) The position on the human sequence of fosmid clones in a and b, respectively. (Vertical red lines) Amplicon boundaries that were defined by sequencing the amplicon junction (see text and Supplemental Fig. 4). The definition of the deletion breakpoints was obtained as follows. Distal breakpoint. Fosmid G248P87145E2 (chr2:15,461,044–15,505,473; 44.4 kb) gave a signal on del(2) that, by eye, consistently appeared to be half the intensity of the signal on normal chromosome 2 (10 analyzed metaphases; its black and white original signal is separately reported in a). The middle part of the fosmid was therefore assumed to harbor the telomeric break of the deletion at ∼chr2:15,483 kb. G248P87145E2 is present also on the amplicon (a, inset), but the signal intensity is biased by the amplification. The normal intensity on del(2) of fosmid G248P800648F12 (chr2:15,428,940–15,471,782), and the absence of any signal on the dmin, was consistent with the assumption in a. Proximal breakpoint. Fosmid G248P87325H8 (chr2:18,656,707–18,695,100; 38.4 kb) consistently gave a signal of half intensity on del(2) (10 analyzed metaphases; its black and white original signal is separately reported in b). The centromeric break of the deletion was therefore assumed to lay at ∼chr2:18,575 kb. Note that sequences of G248P87145E2 are present on the amplicon (b, inset), but, again, the signal intensity is biased by the amplification. The intensity on del(2) of signals yielded by fosmids G248P89303A7, G248P85351E4, and G248P86949C3 was consistent with this hypothesis. The deletion, therefore, spanned approximately the interval chr2:15,483–18,575 kb. Because of growth difficulty of the STA-NB-10/hsr cell line, not all FISH experiments performed on STA-NB-10/dmin were also performed in hsr subclone (see Supplemental Table 1). (e,f) Evidence for the deletion on one of the two copies of chromosome 2. Two fosmid clones flanking the deleted region (red and green) were hybridized with a probe (RP11-723P4, violet) mapping within the deletion but absent in the amplicon (see text). The BAC was chosen in order to avoid the high background due to the amplification. The distance between the red and green probes on normal chromosome 2 (red arrow) is substantially reduced on the del(2) (white arrow), as expected. (f) Rationale of the FISH experiment in e.
Sequencing of junction regions
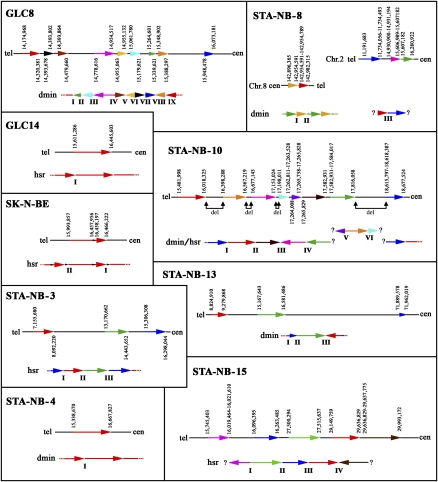
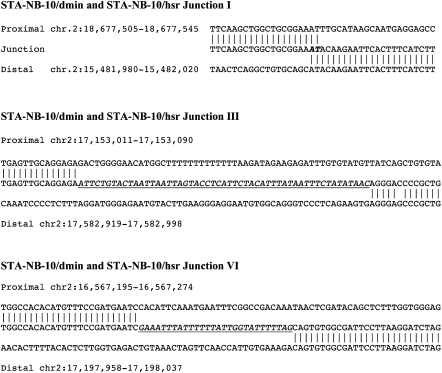
Breakpoint regions were refined by RQ-PCR experiments (Supplemental Table 2A) and by Affymetrix 6.0 SNP array (in STA-NB-8, STA-NB-10/hsr, and STA-NB-15; see Supplemental Table 3). The refinements allowed the setup of normal, long-range, or Vectorette PCR experiments aimed at amplifying, cloning, and sequencing the junction regions. When necessary, nested PCR assays were designed to obtain short, ready-to-sequence amplification products. Thirty-two junctions were successfully sequenced (Supplemental Fig. 4; primers in Supplemental Table 2B) and allowed fine characterization of the internal organization of the amplicons (Fig. 4). The amplicon of the STA-NB-8 cell line was composed of two fragments of different origin (chromosomes 2 and 8), arranged “head to tail.” The junction sequence resulting from the circularization of the STA-NB-10/dmin amplicon (Junction I in Fig. 5) defined its boundaries at the sequence level (chr2:15,481,998–18,677,524; 3,195,526 bp in size). An identical junction sequence was obtained from the STA-NB-10/hsr subclone. Additionally, all the amplification products from the two subclones (about 30, many of them spanning junction regions) yielded bands of identical size (data not shown). Junctions III and VI of both subclones were successfully sequenced and, again, they were identical (Fig. 5). Nonamplified segments internal to the amplicon of the STA-NB-10/hsr, already shown to be single-copy (see above), were found to be homozygous for all the analyzed SNPs (Affymetrix 6.0 SNP array; Supplemental Table 4). Supplemental Figure 5 graphically summarizes the different potential steps of gene amplification in the cell lines, constructed according to the collected data. A bioinformatic analysis of all amplicon breakpoints is reported in the Supplemental material. The analysis did not disclose noteworthy results.
Figure 4.
(Lower part of each section) Schematic representation of the structure of the amplicon. Different blocks composing the amplicons are represented by arrows of different color. (Upper parts) Arrangement of the amplified blocks in the reference sequence (hg18). (Gray line segments) Nonamplified regions; (vertical figures) boundaries of the breaks, at single-base resolution if sequenced (Supplemental Fig. 4), or as a small interval (maximum interval size: 2.5 kb); (?) uncloned fusion regions. In STA-NB-10 the deleted regions (del) internal to the amplified region are indicated. The lengths of the arrows are only approximately proportional the DNA segment length.
Figure 5.
Sequence of Junctions I, III, and VI of STA-NB-10/dmin and STA-NB-10/hsr (see Fig. 4), found identical at the single base-pair level. Note the AT microhomology at the junction.
Mapping of hsr insertion sites
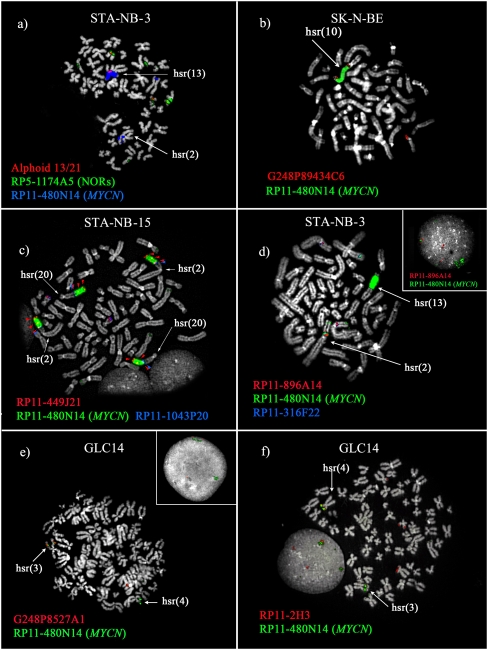
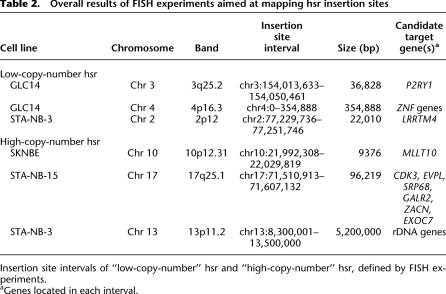
All hsr were inserted in chromosomes other than chromosome 2, with the exception of STA-NB-3, in which the hsr mapped on chromosome 2, but far away (∼61 Mb) from the MYCN locus (2p12; MYCN is at 2p24.3) (Supplemental Fig. 6). On visual inspection, hsr could be classified as high- (Fig. 6a–c) or low-copy-number (Fig. 6d–f). Occasionally, two different levels of hsr amplification were found in the same cell line, as in STA-NB-3 (Fig. 6a,d). Gajduskova et al. (2007) speculated on the influence of genome position on the level of amplification of the inserted sequences. To investigate this, iterative cohybridization FISH experiments were performed to define the hsr insertion sites (see Supplemental Table 5). The most informative experiments are reported in Figure 6 and in Table 2. We did not detect deletions at the insertion sites, within the limits of FISH resolution.
Figure 6.
Cohybridization FISH experiments used to characterize hsr insertion sites. MYCN was used in all experiments to mark the hsr, and it was cohybridized with contiguous probes flanking the insertion (a,f) or with clones yielding split signals (b–e). (a) In STA-NB-3, the insertion is within the short arm of chromosome 13, between the centromere (alphoid probe, red) and the NOR region (RP5-1174A5). (c) In STA-NB-15, the BAC RP11-449J21 (red) displayed signals distally, proximally, and within the hsr (arrowheads), likely due to a duplication event occurring simultaneously to the hsr insertion process. (e,f) Cell line GLC14 showed two insertion sites. Map positions of all the clones are reported in Supplemental Table 1.
Table 2.
Overall results of FISH experiments aimed at mapping hsr insertion sites
Insertion site intervals of “low-copy-number” hsr and “high-copy-number” hsr, defined by FISH experiments.
aGenes located in each interval.
Fusion genes generated by junctions
Fusion genes are of relevance in cancer (Mitelman et al. 2004). In this study we found several junctions juxtaposing truncated genes in the same transcriptional orientation (see Supplemental material). Reverse transcriptase (RT)-PCR analysis, performed to reveal fusion transcripts, detected two distinct 5′NBAS/3′BC035112 (NBAS also known as NAG; BC035112 also known as NCRNA00276) short chimeric transcripts in cell lines GLC8 and STA-NB-3 (details in Supplemental Fig. 7) that, in silico, did not detect any chimeric NBAS/BC035112 protein (data not shown). In cell line STA-NB-4 we detected another in-frame fusion transcript involving the NBAS gene, composed of the 5′ of NBAS, from exons 13–42 (exon 35 is spliced out), and the 3′ of FAM49A, exons 3–12 (Supplemental Fig. 6). The transcript was predicted to encode a NBAS/FAM49A chimeric protein of 1511 amino acids, fusing 1185 amino acids of NBAS, containing its Sec39 domain, to 326 amino acids of the FAM49A protein (secretory pathway) (data not shown). In STA-NB-10 subclones we detected a fusion transcript composed of the 5′ of FAM49A (exon 1 only) and the 3′ of SMC6 (exons 5–13) (accession no. AK292421). This transcript did not encode a chimeric protein, but would encode a 315-amino-acid ORF starting at a codon within exon 5 of SMC6, containing a P-loop NTPase superfamily domain.
Gene expression analysis
Amplicons of the different cell lines showed large size variability, and several genes were coamplified with MYCN (Supplemental Table 6; Supplemental Fig. 8). We investigated their expression pattern by RQ-PCR (primers reported in Supplemental Table 7). MYCN, amplified in all cell lines, turned out to be always overexpressed, although the increase of transcriptional level was statistically significant only in three NB cell lines (STA-NB-8, STAN-B10, and SK-N-BE). MYCNOS was the only gene always coamplified with MYCN (see Discussion). Expression data of genes with known function are reported in detail in Supplemental Figure 9 and Supplemental Table 8. The overall results indicated that, in addition to MYCN, only GREB1 in STA-NB-8 and RAD51AP2 and SMC6 in STA-NB-10 were significantly overexpressed. Surprisingly, two genes (VSNL1 and GEN1 in STA-NB-10) displayed significant down-regulation despite the gain of copy number. VSNL1 was significantly down-regulated also in all NB cell lines analyzed (Supplemental Table 8). RQ-PCR experiments were also performed to test the expression of genes interrupted by hsr insertions. The results are described in the Supplemental material and summarized in Supplemental Figure 10 and Supplemental Table 9.
Bioinformatic analysis of hsr insertions
Each hsr insertion site, 400 kb on both sides, was carefully inspected to search for features either shared by all insertion sites or which would allow a differentiation of high- versus low-copy-number hsr (see Supplemental Tables 10–16). The search did not identify any shared features.
Discussion
In the present paper we characterized the structure of MYCN amplicons present, in the form of dmin or hsr, in eight NB and two SCLC cell lines. The most interesting result was represented by the perfect matching, in both STA-NB-10 subclones, of the amplicon extension with the extension of the deletion, defined by FISH, found on one chromosome 2. The episomal model has already been hypothesized in solid tumors (Carroll et al. 1988; Corvi et al. 1995). Our finding provided strong evidence of it.
A second revealing result of the present study is the strikingly identical structure of dmin and hsr amplicons of the two STA-NB-10 subclones. This finding suggests that the hsr has evolved from the dmin, as graphically reported in Supplemental Figure 5B. The steps can be summarized as follows: excision, circularization, substantial internal reorganization, amplification, and, in hsr cases, chromosomal integration and further amplification. Theoretically, it can be hypothesized that the excised DNA segment was inserted and amplified as an hsr first. Then, in STA-NB-10/dmin, the hsr extruded to form dmin. The absence, in STA-NB-10/dmin, of any FISH signal at 5q in experiments using probes mapping within the amplicon, and the absence, in STA-NB-10/hsr, of any 5q amplification (CGH array data) imply a perfect and complete extrusion of the hsr to form dmin, which seems unlikely. On the other hand, if hsr represents a potential evolution of dmin, one could expect the simultaneous presence of dmin and hsr in cases in which hsr were formed. Some examples of such cases have been reported (Fegan et al. 1995; Yoshimoto et al. 1999; Roijer et al. 2002). It has to be considered, however, that dmin are per se unstable structures. They can be eliminated spontaneously or after addition of certain drugs such as hydroxyurea (Ambros et al. 1997; Narath et al. 2007; Shimizu et al. 2007). Their retention in tumor cells is, very likely, under strong selective pressure, as it has been demonstrated for dihydrofolate reductase dmin originated in response to methotrexate treatment (Martinsson et al. 1982). The selective pressure on dmin, presumably, rapidly drops when an hsr is formed, the latter being intrinsically more stable, and the cell population will soon be composed of a mosaic of dmin- and hsr-only cells (see Balaban-Malenbaum and Gilbert 1977; Yoshida et al. 1999). The complete loss of dmin can follow. The patient reported by Yoshida et al. (1999) initially showed a hsr/dmin mosaic, then, after therapy, only hsr cells were found. Similar results have been observed also in cultured tumor cells (Quinn et al. 1979; George and Francke 1980; George and Powers 1982). The view that hsr are the result of dmin integration is not new (Coquelle et al. 1998; Bignell et al. 2007; Campbell et al. 2008). Our results on STA-NB-10 subclones add strong support for this view.
STA-NB-10 was the only cell line showing the deletion event. When the excision is postreplicative, the amplified episome, likely conferring a growth advantage, may segregate with either the normal or the deleted chromatid. The deletion, therefore, is not a necessary occurrence. On average, however, it should be found in ∼50% of postreplicative cases, and up to 100% of non-postreplicative cases. In our recent work on gene amplification in hematological malignancies, the deletion was detected in 68% (23 out of 34) of the studied cases (Storlazzi et al. 2006). It is unclear why, in the present study, no cell line other than STA-NB-10 showed the deletion. It is worth noting, however, that, as far as we know, deletions not accompanied by more complex chromosomal events, and corresponding to the amplified sequences, have been reported in solid tumors only by Gibaud et al. (2010).
Amplicon structure
GLC14, SK-N-BE, and STA-NB-4 cell lines showed an amplicon composed of a single fragment; i.e., the excised segment did not undergo internal rearrangement before amplification. The remaining amplicons showed a more complex structure, composed of noncontinuous, non-colinear segments often fused in opposite orientation (Fig. 4). The STA-NB-8 amplicon disclosed coamplification with a sequence from the long arm of chromosome 8 (Fig. 4; Supplemental Fig. 3). Array-CGH analysis disclosed an additional type of complexity. The level of amplification of the different fragments was occasionally substantially different (see STA-NB-8 in Supplemental Fig. 2). Such differences were noted in both dmin and hsr. These findings clearly indicated that these amplicons were heterogeneous and that some events affecting the structure of the amplicon occurred at later stages with respect to the excision event. This heterogeneity has also been reported by Campbell et al. (2008), who assumed that the most frequent rearrangements, estimated by copy-number analysis, occurred early. The FISH experiments on line STA-NB-8, reported in Supplemental Figure 3A, clearly documented a mosaicism. The power of FISH in detecting sequence stretches less than ∼10 kb in size, however, is relatively low, and we can suppose that the heterogeneity could be higher than suspected. Changes of the amplicon structure could occur at any time during proliferation.
STA-NB-3, STA-NB-13, and STA-NB-15 cell lines showed coamplification of segments located >5 Mb apart from MYCN (up to 55 Mb apart in STA-NB-13) (Fig. 4); in STA-NB-8 the nonsyntenic coamplification involved a ∼4-kb DNA stretch located at chr8:142,896,365–142,982,315. These findings suggest that the event that originated the amplicon patchwork was a complex rearrangement in which more than one chromosomal domain participated (Supplemental Fig. 5). The occurrence of coamplification of genes originating from different chromosomes is not a rare event in hematological amplifications (Frascella et al. 2000; Morel et al. 2003; Graux et al. 2004; Martin-Subero et al. 2005; Van Roy et al. 2006). Amplicons with a complex pattern have been reported also in studies utilizing fresh cancer material and analyzed using array-CGH technology (Beheshti et al. 2003; Caren et al. 2008; Fix et al. 2008; Stock et al. 2008). Gibaud et al. (2010) documented, in a glioma case, dmin derived from four different chromosomal domains.
The sequencing of 32 amplicon junctions disclosed 11 microhomologies and 12 anonymous insertions, typical of nonhomologous end joining. Campbell et al. (2008) detected microhomologies in 53% of the joined ends of the acquired rearrangements. Genomic structure, such as segmental duplications, has been shown to affect specific rearrangements in tumors (Barbouti et al. 2004). More specifically, Gibcus et al. (2007) have reported, in their study of 30 patients and eight cell lines showing 11q13 amplification, that amplified regions are flanked by segmental duplications, suggested to play an important role in triggering the initial rearrangement. Many of these amplifications, however, were hypothesized to arise though the BFB mechanism. We did not find any fusion junction joining sequences with high similarity, indicating that, in our cases, mechanisms mimicking nonallelic homologous recombination did not play a role in the genesis of the rearrangements.
The common fragile site FRA2C maps at the band 2p24.2, which encompasses the region chr2:17,000,001–19,100,000, relatively close to the MYCN gene (chr2:15,999,497–16,004,580). Some breakpoints (the proximal breakpoint of the STA-NB-10 amplicon, for instance, chr2: 18,677,524) map at 2p24.2. FRA2C, however, was not precisely mapped at sequence level. It is therefore premature to establish a correlation between the FRA2C and excision events.
Recently, the somatically acquired rearrangements of some tumor cell lines showing gene amplification (NCI-H1770 cell line in particular, containing amplified copies of MYCN) were investigated by end-sequencing of BAC libraries (Bignell et al. 2007) or by analyzing the end-pairs of short DNA fragments obtained by massive sequencing (Campbell et al. 2008). These studies have the advantage of a precise, genome-wide detection of almost all changes, including those that were acquired in late passages of the cell line, which were probably missed in our study. Very likely, we detected only the more common ones that, on the other hand, are presumably the more ancestral and more relevant ones, as stressed by Campbell et al. (2008).
Expression of amplified genes, interrupted genes, and fusion genes
MYCN was overexpressed in all cell lines. However the overexpression level reached significance only in three cell lines (Supplemental Table 8A,B). However, there is no doubt that MYCN is the target gene of amplifications of the 2p4.3 domain present in all dmin and hsr amplicons. Amplicon erosion can lead to tumor cell revertance and tumor cell senescence in vitro (Ambros et al. 1997; Narath et al. 2007). The MYCNOS gene partially overlaps with MYCN because it lies on the opposite strand (Armstrong and Krystal 1992). This gene, therefore, was always present in amplicons (Supplemental Table 8A), as reported in similar studies (Scott et al. 2003; Caren et al. 2008; Fix et al. 2008). MYCN and MYCNOS are unique in that they are coregulated in tumor cell lines under basal growth conditions and in response to the differentiating agent retinoic acid (Armstrong and Krystal 1992). We extended the expression analysis to genes whose function was known. Some genes, such as GREB1 in STA-NB-10, known to be involved in cancer (Sun et al. 2007), or GEN1 in STA-NB-8, appeared overexpressed although not amplified (Supplemental Table 8A). The present data also indicated that some genes (such as VSNL1 in NB cell lines, and PQLC3 in both SCLC and NB cell lines) are consistently down-regulated regardless of their amplification status. VSNL1 down-regulation has been already reported in squamous carcinoma cells (Gonzalez Guerrico et al. 2005) and in non-small cell lung carcinomas (Fu et al. 2008). Our data suggest that it may have a tumor suppressor role also in NB tumors. The role, in cancer, of PQLC3, encoding an integral membrane protein, is presently unknown. Again, its down-regulation in both NB and SCLC tumors may indicate a putative function as a tumor suppressor gene.
Our analysis of the junction points at the sequence level identified four potential fusion genes. For all of them we were able to detect a transcript, and one predicted chimeric protein was identified (NBAS/FAM49A). We did not detect a chimeric protein for the other fusion genes. However, these findings do not exclude a role of a transcript in tumorigenesis (Guastadisegni et al. 2008).
Methods
All sequence data refer to the human genome assembly hg18, March 2006 release.
Cell lines
Cell lines, as an alternative to primary tumors, have been chosen in order to have a higher availability of material to perform the present study. The cell lines investigated are listed in Table 1. SCLC cell lines GLC8 and GLC14 were obtained as previously described (van der Hout et al. 1989) and provided by K. Kok. The NB cell line SK-N-BE (Biedler and Spengler 1976) was provided by G. Della Valle (University of Bologna, Italy). STA-NB cell lines were provided by P.F. Ambros, and some of them have been previously described (Ambros et al. 1997; Narath et al. 2007; Stock et al. 2008). STA-NB-10/hsr and STA-NB-10/dmin are subclones of the same cell line, showing MYCN [v-myc myelocytomatosis viral related oncogene, neuroblastoma derived (avian)] amplification in form of hsr or dmin, respectively.
FISH, multicolor-FISH, long-range PCR, Vectorette PCR, sequencing, and RQ-PCR were performed as already described (Storlazzi et al. 2006).
Oligo-array CGH
Whole-genome CGH array analysis was performed to define DNA copy number gains and losses. DNA was extracted from tumor cell lines using standard methods. Tumor DNAs and a NimbleGen human reference sample were labeled and cohybridized on a high-resolution NimbleGen 385 K Whole-Genome Tiling array (build hg18; NCBI Build 36), which has a median probe spacing of 6270 bp. DNA copy number gains and losses were viewed using Roche NimbleGen's SignalMap software. DNA segmentation analysis has been performed using the circular binary segmentation algorithm from Olshen et al. (2004).
Single nucleotide polymorphism (SNP) array CGH
A whole-genome SNP array analysis was performed on STA-NB-8, STA-NB-10/hsr, and STA-NB-15 cell lines using the Affymetrix Genome Wide Human SNP Array 6.0, including over 906,600 single nucleotide polymorphisms (SNPs) and more than 946,000 probes for the detection of copy number variation. Sample preparation, hybridization, and scanning were performed using GeneChip Instrument System hardware according to the manufacturer's specifications (Affymetrix). Quality controls and LOH analysis have been performed using Affymetrix Genotyping Console Software. Copy Number Variant segments have been produced with Partek Genomic Suite Software (Partek Inc.), performing an unpaired analysis using as baseline the 270 HapMap samples and hidden Markov model method.
Gene expression quantification
Gene expression level was determined by RQ-PCR. The cDNA was obtained using the QuantiTect Reverse Transcription Kit (QIAGEN) according to the handbook protocol. The cDNA was amplified using the Applied Biosystems Real-Time PCR System 7300 in the presence of SYBR Green I. The optimization of the RQ-PCR reaction was performed according to the manufacturer's instructions (Applied Biosystems) but scaled down to 10 μL per reaction. Individual Real-Time PCR was performed in a 96-well plate (Applied Biosystems) containing 1× Platinum SYBR Green qPCR SuperMix-UDG with ROX (Invitrogen), 500 nM ROX Reference (Invitrogen), and 300 nM of sense and antisense primers. All measurements were performed at least in triplicate.
The PCR conditions were as follows: 2 min at 50°C, 10 min at 95°C, followed by 40 cycles of 15 sec at 95°C and 1 min at 60°C for all the primer pairs used. At the end of each reaction, the cycle threshold (Ct) was manually set up at a level that reflects the best kinetic PCR parameters. Primers were designed with an internet-based interface, Primer3 (Rozen and Skaletsky 2000).
The primers were checked for specificity using the BLAT tool in the UCSC Human Genome Browser (http://genome.ucsc.edu/cgi-bin/hgBlat).
In order to improve the normalization step, 10 housekeeping genes were tested (ACTB, B2M, GAPDH, HMBS, HPRT1, RPL13A, SDHA, RN28S1, UBC, and YWHAZ) and the three best-performing housekeeping genes (HPRT1, SDHA, and UBC), selected by applying the geNorm software (Vandesompele et al. 2002), were used. For accurate averaging of the control genes, we used the geometric mean, instead of the arithmetic mean, and the normalized gene of interest (GOI) expression levels were calculated by dividing the raw GOI quantities for each sample by the appropriate geometric mean. We used total brain RNA (Clontech Laboratories, Inc.) and a pool of three normal lung RNA samples as calibrators for NB and SCLC cell lines, respectively.
Finally, statistical significance analysis of data was performed using the Relative expression software tool (REST) (Pfaffl et al. 2002).
Detection of fusion transcripts
RT-PCR experiments were performed in order to detect the occurrence of fusion transcripts, generated by the expression of chimeric genes at amplicon junctions, in cell lines STA-NB-3, STA-NB-4, STA-NB-10, and GLC8. In STA-NB-3 and GLC8, a primer combination of a forward primer specific for exon 41 of NBAS with a reverse primer for exon 3 of BC035112 was used. In STA-NB-4, the same NBAS forward primer was placed in combination with a reverse primer for exon 7 of FAM49A. In STA-NB-10, a FAM49A exon 1 forward primer was used in combination with a SMC6 exon 7 reverse primer. Fusion products were sequenced and analyzed by BLAST. In silico translation of the full-length chimeric transcripts was performed using the ORFfinder Tool of the NCBI website (http://blast.ncbi.nlm.nih.gov).
Bioinformatic analysis
The “Self Chain,” “Repeat Masker,” “RefSeq Genes,” “Segmental Duplication,” and “Structural Variation” tracks of the UCSC Genome Browser (http://genome.ucsc.edu/cgi-bin/hgTables) were carefully inspected. Additional bioinformatic analysis was locally performed using the Fuzznuc algorithm (http://bioweb2.pasteur.fr/docs/EMBOSS/fuzznuc.html). The 400-kb regions spanning each breakpoint (Supplemental Table 10) were searched for consensus sequences, in order to disclose the frequency of motifs known to be involved in chromosome instability (Supplemental Table 11). Detected motifs are listed in Supplemental Tables 12–16, in BED format (suitable to be charged as UCSC custom Tracks; http://genome.ucsc.edu/goldenPath/help/customTrack.html).
Acknowledgments
The study was supported by AIRC (Associazione Italiana per la Ricerca sul Cancro), MiUR (Ministero dell'Istruzione, dell'Universita' e della Ricerca; COFIN PRIN 2007), CEGBA (Centro di Eccellenza Geni in campo Biosanitario e Agroalimentare), and by OENB grant no. 13422 to P.A. C.S. was the recipient of a FIRC (Fondazione Italiana per la Ricerca sul Cancro) fellowship. S.P. was supported by a fellowship from European Union—Programma Regionale per la Ricerca Industriale and L'Innovazione e Il Trasferimento Tecnologico of the Emilia Romagna Region.
Footnotes
[Supplemental material is available online at http://www.genome.org. Sequence data from this study have been submitted to GenBank (http://www.ncbi.nlm.nih.gov/genbank/) under accession nos. HM243501–HM243513, HM243515–HM243529, and HM358636. NimbleGen array CGH data have been submitted to the NCBI Gene Expression Omnibus (http://www.ncbi.nlm.nih.gov/geo/) under accession no. GSE22279. Affymetrix CGH data have been submitted to ArrayExpress (http://www.ebi.ac.uk/microarray-as/ae/) under accession no. E-MEXP-2735.]
Article published online before print. Article and publication date are at http://www.genome.org/cgi/doi/10.1101/gr.106252.110.
References
- Albertson DG 2006. Gene amplification in cancer. Trends Genet 22: 447–455 [DOI] [PubMed] [Google Scholar]
- Ambros IM, Rumpler S, Luegmayr A, Hattinger CM, Strehl S, Kovar H, Gadner H, Ambros PF 1997. Neuroblastoma cells can actively eliminate supernumerary MYCN gene copies by micronucleus formation—sign of tumour cell revertance? Eur J Cancer 33: 2043–2049 [DOI] [PubMed] [Google Scholar]
- Armstrong BC, Krystal GW 1992. Isolation and characterization of complementary DNA for N-cym, a gene encoded by the DNA strand opposite to N-myc. Cell Growth Differ 3: 385–390 [PubMed] [Google Scholar]
- Balaban-Malenbaum G, Gilbert F 1977. Double minute chromosomes and the homogeneously staining regions in chromosomes of a human neuroblastoma cell line. Science 198: 739–741 [DOI] [PubMed] [Google Scholar]
- Barbouti A, Stankiewicz P, Nusbaum C, Cuomo C, Cook A, Hoglund M, Johansson B, Hagemeijer A, Park SS, Mitelman F, et al. 2004. The breakpoint region of the most common isochromosome, i(17q), in human neoplasia is characterized by a complex genomic architecture with large, palindromic, low-copy repeats. Am J Hum Genet 74: 1–10 [DOI] [PMC free article] [PubMed] [Google Scholar]
- Barr FG, Nauta LE, Davis RJ, Schafer BW, Nycum LM, Biegel JA 1996. In vivo amplification of the PAX3-FKHR and PAX7-FKHR fusion genes in alveolar rhabdomyosarcoma. Hum Mol Genet 5: 15–21 [DOI] [PubMed] [Google Scholar]
- Beheshti B, Braude I, Marrano P, Thorner P, Zielenska M, Squire JA 2003. Chromosomal localization of DNA amplifications in neuroblastoma tumors using cDNA microarray comparative genomic hybridization. Neoplasia 5: 53–62 [DOI] [PMC free article] [PubMed] [Google Scholar]
- Biedler JL, Spengler BA 1976. A novel chromosome abnormality in human neuroblastoma and antifolate-resistant Chinese hamster cell lives in culture. J Natl Cancer Inst 57: 683–695 [DOI] [PubMed] [Google Scholar]
- Bignell GR, Santarius T, Pole JC, Butler AP, Perry J, Pleasance E, Greenman C, Menzies A, Taylor S, Edkins S, et al. 2007. Architectures of somatic genomic rearrangement in human cancer amplicons at sequence-level resolution. Genome Res 17: 1296–1303 [DOI] [PMC free article] [PubMed] [Google Scholar]
- Campbell PJ, Stephens PJ, Pleasance ED, O'Meara S, Li H, Santarius T, Stebbings LA, Leroy C, Edkins S, Hardy C, et al. 2008. Identification of somatically acquired rearrangements in cancer using genome-wide massively parallel paired-end sequencing. Nat Genet 40: 722–729 [DOI] [PMC free article] [PubMed] [Google Scholar]
- Caren H, Erichsen J, Olsson L, Enerback C, Sjoberg RM, Abrahamsson J, Kogner P, Martinsson T 2008. High-resolution array copy number analyses for detection of deletion, gain, amplification and copy-neutral LOH in primary neuroblastoma tumors: Four cases of homozygous deletions of the CDKN2A gene. BMC Genomics 9: 353 doi: 10.1186/1471-2164-9-353 [DOI] [PMC free article] [PubMed] [Google Scholar]
- Carroll SM, DeRose ML, Gaudray P, Moore CM, Needham-Vandevanter DR, Von Hoff DD, Wahl GM 1988. Double minute chromosomes can be produced from precursors derived from a chromosomal deletion. Mol Cell Biol 8: 1525–1533 [DOI] [PMC free article] [PubMed] [Google Scholar]
- Coquelle A, Toledo F, Stern S, Bieth A, Debatisse M 1998. A new role for hypoxia in tumor progression: Induction of fragile site triggering genomic rearrangements and formation of complex DMs and HSRs. Mol Cell 2: 259–265 [DOI] [PubMed] [Google Scholar]
- Corvi R, Savelyeva L, Amler L, Handgretinger R, Schwab M 1995. Cytogenetic evolution of MYCN and MDM2 amplification in the neuroblastoma LS tumour and its cell line. Eur J Cancer 31A: 520–523 [DOI] [PubMed] [Google Scholar]
- Fegan CD, White D, Sweeney M 1995. C-myc amplification, double minutes and homogenous staining regions in a case of AML. Br J Haematol 90: 486–488 [DOI] [PubMed] [Google Scholar]
- Fix A, Lucchesi C, Ribeiro A, Lequin D, Pierron G, Schleiermacher G, Delattre O, Janoueix-Lerosey I 2008. Characterization of amplicons in neuroblastoma: High-resolution mapping using DNA microarrays, relationship with outcome, and identification of overexpressed genes. Genes Chromosomes Cancer 47: 819–834 [DOI] [PubMed] [Google Scholar]
- Frascella E, Lenzini E, Schafer BW, Brecevic L, Dorigo E, Toffolatti L, Nanni P, De Giovanni C, Rosolen A 2000. Concomitant amplification and expression of PAX7-FKHR and MYCN in a human rhabdomyosarcoma cell line carrying a cryptic t(1;13)(p36;q14). Cancer Genet Cytogenet 121: 139–145 [DOI] [PubMed] [Google Scholar]
- Fu J, Fong K, Bellacosa A, Ross E, Apostolou S, Bassi DE, Jin F, Zhang J, Cairns P, Ibanez de Caceres I, et al. 2008. VILIP-1 downregulation in non-small cell lung carcinomas: Mechanisms and prediction of survival. PLoS ONE 3: e1698 doi: 10.1371/journal.pone.0001698 [DOI] [PMC free article] [PubMed] [Google Scholar]
- Gajduskova P, Snijders AM, Kwek S, Roydasgupta R, Fridlyand J, Tokuyasu T, Pinkel D, Albertson DG 2007. Genome position and gene amplification. Genome Biol 8: R120 doi: 10.1186/gb-2007-8-6-r120 [DOI] [PMC free article] [PubMed] [Google Scholar]
- George D, Francke U 1980. Homogeneously staining chromosome regions and double minutes in a mouse adrenocortical tumor cell line. Cytogenet Cell Genet 28: 217–226 [DOI] [PubMed] [Google Scholar]
- George DL, Powers VE 1982. Amplified DNA sequences in Y1 mouse adrenal tumor cells: Association with double minutes and localization to a homogeneously staining chromosomal region. Proc Natl Acad Sci 79: 1597–1601 [DOI] [PMC free article] [PubMed] [Google Scholar]
- Gibaud A, Vogt N, Hadj-Hamou NS, Meyniel JP, Hupe P, Debatisse M, Malfoy B 2010. Extrachromosomal amplification mechanisms in a glioma with amplified sequences from multiple chromosome loci. Hum Mol Genet 19: 1276–1285 [DOI] [PubMed] [Google Scholar]
- Gibcus JH, Kok K, Menkema L, Hermsen MA, Mastik M, Kluin PM, van der Wal JE, Schuuring E 2007. High-resolution mapping identifies a commonly amplified 11q13.3 region containing multiple genes flanked by segmental duplications. Hum Genet 121: 187–201 [DOI] [PubMed] [Google Scholar]
- Gonzalez Guerrico AM, Jaffer ZM, Page RE, Braunewell KH, Chernoff J, Klein-Szanto AJ 2005. Visinin-like protein-1 is a potent inhibitor of cell adhesion and migration in squamous carcinoma cells. Oncogene 24: 2307–2316 [DOI] [PubMed] [Google Scholar]
- Graux C, Cools J, Melotte C, Quentmeier H, Ferrando A, Levine R, Vermeesch JR, Stul M, Dutta B, Boeckx N, et al. 2004. Fusion of NUP214 to ABL1 on amplified episomes in T-cell acute lymphoblastic leukemia. Nat Genet 36: 1084–1089 [DOI] [PubMed] [Google Scholar]
- Guastadisegni MC, Lonoce A, Impera L, Albano F, D'Addabbo P, Caruso S, Vasta I, Panagopoulos I, Leszl A, Basso G, et al. 2008. Bone marrow ectopic expression of a non-coding RNA in childhood T-cell acute lymphoblastic leukemia with a novel t(2;11)(q11.2;p15.1) translocation. Mol Cancer 7: 80 doi: 10.1186/1476-4598-7-80 [DOI] [PMC free article] [PubMed] [Google Scholar]
- Hellman A, Zlotorynski E, Scherer SW, Cheung J, Vincent JB, Smith DI, Trakhtenbrot L, Kerem B 2002. A role for common fragile site induction in amplification of human oncogenes. Cancer Cell 1: 89–97 [DOI] [PubMed] [Google Scholar]
- Martin-Subero JI, Odero MD, Hernandez R, Cigudosa JC, Agirre X, Saez B, Sanz-Garcia E, Ardanaz MT, Novo FJ, Gascoyne RD, et al. 2005. Amplification of IGH/MYC fusion in clinically aggressive IGH/BCL2-positive germinal center B-cell lymphomas. Genes Chromosomes Cancer 43: 414–423 [DOI] [PubMed] [Google Scholar]
- Martinsson T, Tenning P, Lundh L, Levan G 1982. Methotrexate resistance and double minutes in a cell line from the SEWA mouse ascites tumor. Hereditas 97: 123–137 [DOI] [PubMed] [Google Scholar]
- McClintock B 1951. Chromosome organization and genic expression. Cold Spring Harb Symp Quant Biol 16: 13–47 [DOI] [PubMed] [Google Scholar]
- Mitelman F, Johansson B, Mertens F 2004. Fusion genes and rearranged genes as a linear function of chromosome aberrations in cancer. Nat Genet 36: 331–334 [DOI] [PubMed] [Google Scholar]
- Morel F, Bris MJ, Herry A, Calvez GL, Marion V, Abgrall JF, Berthou C, Braekeleer MD 2003. Double minutes containing amplified bcr-abl fusion gene in a case of chronic myeloid leukemia treated by imatinib. Eur J Haematol 70: 235–239 [DOI] [PubMed] [Google Scholar]
- Myllykangas S, Bohling T, Knuutila S 2007. Specificity, selection and significance of gene amplifications in cancer. Semin Cancer Biol 17: 42–55 [DOI] [PubMed] [Google Scholar]
- Narath R, Ambros IM, Kowalska A, Bozsaky E, Boukamp P, Ambros PF 2007. Induction of senescence in MYCN amplified neuroblastoma cell lines by hydroxyurea. Genes Chromosomes Cancer 46: 130–142 [DOI] [PubMed] [Google Scholar]
- Olshen AB, Venkatraman ES, Lucito R, Wigler M 2004. Circular binary segmentation for the analysis of array-based DNA copy number data. Biostatistics 5: 557–572 [DOI] [PubMed] [Google Scholar]
- Pfaffl MW, Horgan GW, Dempfle L 2002. Relative expression software tool (REST) for group-wise comparison and statistical analysis of relative expression results in real-time PCR. Nucleic Acids Res 30: e36 http://nar.oxfordjournals.org/cgi/content/full/30/9/e36 [DOI] [PMC free article] [PubMed] [Google Scholar]
- Quinn LA, Moore GE, Morgan RT, Woods LK 1979. Cell lines from human colon carcinoma with unusual cell products, double minutes, and homogeneously staining regions. Cancer Res 39: 4914–4924 [PubMed] [Google Scholar]
- Reshmi SC, Roychoudhury S, Yu Z, Feingold E, Potter D, Saunders WS, Gollin SM 2007. Inverted duplication pattern in anaphase bridges confirms the breakage-fusion-bridge (BFB) cycle model for 11q13 amplification. Cytogenet Genome Res 116: 46–52 [DOI] [PubMed] [Google Scholar]
- Roijer E, Nordkvist A, Strom AK, Ryd W, Behrendt M, Bullerdiek J, Mark J, Stenman G 2002. Translocation, deletion/amplification, and expression of HMGIC and MDM2 in a carcinoma ex pleomorphic adenoma. Am J Pathol 160: 433–440 [DOI] [PMC free article] [PubMed] [Google Scholar]
- Rozen S, Skaletsky H 2000. Primer3 on the WWW for general users and for biologist programmers. Methods Mol Biol 132: 365–386 [DOI] [PubMed] [Google Scholar]
- Scott D, Elsden J, Pearson A, Lunec J 2003. Genes co-amplified with MYCN in neuroblastoma: Silent passengers or co-determinants of phenotype? Cancer Lett 197: 81–86 [DOI] [PubMed] [Google Scholar]
- Selvarajah S, Yoshimoto M, Park PC, Maire G, Paderova J, Bayani J, Lim G, Al-Romaih K, Squire JA, Zielenska M 2006. The breakage-fusion-bridge (BFB) cycle as a mechanism for generating genetic heterogeneity in osteosarcoma. Chromosoma 115: 459–467 [DOI] [PubMed] [Google Scholar]
- Shimizu N, Misaka N, Utani K 2007. Nonselective DNA damage induced by a replication inhibitor results in the selective elimination of extrachromosomal double minutes from human cancer cells. Genes Chromosomes Cancer 46: 865–874 [DOI] [PubMed] [Google Scholar]
- Stock C, Bozsaky E, Watzinger F, Poetschger U, Orel L, Lion T, Kowalska A, Ambros PF 2008. Genes proximal and distal to MYCN are highly expressed in human neuroblastoma as visualized by comparative expressed sequence hybridization. Am J Pathol 172: 203–214 [DOI] [PMC free article] [PubMed] [Google Scholar]
- Storlazzi CT, Fioretos T, Surace C, Lonoce A, Mastrorilli A, Strombeck B, D'Addabbo P, Iacovelli F, Minervini C, Aventin A, et al. 2006. MYC-containing double minutes in hematologic malignancies: Evidence in favor of the episome model and exclusion of MYC as the target gene. Hum Mol Genet 15: 933–942 [DOI] [PubMed] [Google Scholar]
- Sun J, Nawaz Z, Slingerland JM 2007. Long-range activation of GREB1 by estrogen receptor via three distal consensus estrogen-responsive elements in breast cancer cells. Mol Endocrinol 21: 2651–2662 [DOI] [PubMed] [Google Scholar]
- van der Hout AH, Kok K, van der Veen AY, Osinga J, de Leij LF, Buys CH 1989. Localization of amplified c-myc and n-myc in small cell lung cancer cell lines. Cancer Genet Cytogenet 38: 1–8 [DOI] [PubMed] [Google Scholar]
- Vandesompele J, De Preter K, Pattyn F, Poppe B, Van Roy N, De Paepe A, Speleman F 2002. Accurate normalization of real-time quantitative RT-PCR data by geometric averaging of multiple internal control genes. Genome Biol 3: research0034.1 doi: 10.1186/gb-2002-3-7-research0034 [DOI] [PMC free article] [PubMed] [Google Scholar]
- Van Roy N, Vandesompele J, Menten B, Nilsson H, De Smet E, Rocchi M, De Paepe A, Pahlman S, Speleman F 2006. Translocation-excision-deletion-amplification mechanism leading to nonsyntenic coamplification of MYC and ATBF1. Genes Chromosomes Cancer 45: 107–117 [DOI] [PubMed] [Google Scholar]
- Vukovic B, Beheshti B, Park P, Lim G, Bayani J, Zielenska M, Squire JA 2007. Correlating breakage-fusion-bridge events with the overall chromosomal instability and in vitro karyotype evolution in prostate cancer. Cytogenet Genome Res 116: 1–11 [DOI] [PubMed] [Google Scholar]
- Yoshida T, Kimura N, Akiyoshi T, Ohshima K, Nagano M, Morioka E, Hisano S, Ohyashiki K, Kamada N, Tamura K 1999. Jumping translocation of homogeneously staining region and tetraploidy with double minutes in acute myelomonocytic leukemia. Cancer Genet Cytogenet 109: 40–44 [DOI] [PubMed] [Google Scholar]
- Yoshimoto M, Caminada de Toledo SR, Monteiro Caran EM, de Seixas MT, de Martino Lee ML, de Campos Vieira Abib S, Vianna SMR, Schettini ST, Anderson Duffles Andrade J 1999. MYCN gene amplification: Identification of cell populations containing double minutes and homogeneously staining regions in neuroblastoma tumors. Am J Pathol 155: 1439–1443 [DOI] [PMC free article] [PubMed] [Google Scholar]


