

Abstract
The measurement of small molecule metabolites on a large scale offers the opportunity for a more complete understanding of cellular metabolism. We developed a high-throughput method to quantify primary amine-containing metabolites in the yeast Saccharomyces cerevisiae by the use of capillary electrophoresis in combination with fluorescent derivatization of cell extracts. We measured amino acid levels in the yeast deletion collection, a set of ∼5000 strains each lacking a single gene, and developed a computational pipeline for data analysis. Amino acid peak assignments were validated by mass spectrometry, and the overall approach was validated by the result that expected pathway intermediates accumulate in mutants of the arginine biosynthetic pathway. Global analysis of the deletion collection was carried out using clustering methods. We grouped strains based on their metabolite profiles, revealing clusters of mutants enriched for genes encoding mitochondrial proteins, urea cycle enzymes, and vacuolar ATPase functions. One of the most striking profiles, common among several strains lacking ribosomal protein genes, accumulated lysine and a lysine-related metabolite. Mutations in the homologous ribosomal protein genes in the human result in Diamond-Blackfan anemia, demonstrating that metabolite data may have potential value in understanding disease pathology. This approach establishes metabolite profiling as capable of characterizing genes in a large collection of genetic variants.
A primary goal of the genomic era—the characterization of the function of all genes in a genome—has been typically approached by high-throughput assays, including proteomics (Huh et al. 2003; Krogan et al. 2006), global gene expression (Sherlock et al. 2001; Edgar et al. 2002), and genetics (Tong et al. 2001). A complementary strategy would focus on an aspect of cell biology often neglected in genomic studies: the role of small molecules. These molecules, which include amino acids, fatty acids, sugars, and nucleotides, not only serve as building blocks of the cell, but they also play vital roles in signaling, cell growth and division, energy homeostasis, transcriptional regulation, and other cellular processes. In comparison with transcriptional profiling and proteomics, which reveal intermediates of the cellular response to perturbation, changes in small molecule abundance reflect the ultimate result of all the upstream regulatory actions: transcriptional, translational, and posttranslational. Accordingly, an understanding of how these molecules respond to genetic perturbation is necessary to decipher cell function. These ideas have led to the burgeoning field of metabolomics, which seeks a comprehensive and quantitative measurement of small molecules in a biological sample.
Metabolomics technologies have been driven by several different applications. Much interesting work has been done in plants (for review, see Rochfort 2005), for which volatiles play an important role in defense and pollination. Metabolomics techniques have also been used to assay samples from many other organisms, including yeast (Raamsdonk et al. 2001a; Mohler et al. 2006), worms (Blaise et al. 2007), mice (Minami et al. 2009), and humans (Wishart 2007; Gieger et al. 2008). Initial work focused on cataloging small molecules; however, metabolomic analysis has also proved useful for a deeper understanding of specific biological processes. For example, it has been used to characterize the metabolic requirements of embryonic stem cells (Wang et al. 2009) and to identify a small molecule biomarker for metastatic prostate cancer (Sreekumar et al. 2009).
Techniques for metabolomics based on mass spectrometry, high-performance liquid chromatography, and nuclear magnetic resonance studies are time intensive, so far precluding their use to assay thousands of samples on a single platform. However, smaller scale studies have demonstrated the utility of measuring metabolite levels in yeast, worms, and other organisms to characterize mutants and to place genes in a pathway (Raamsdonk et al. 2001b; Allen et al. 2003; Blaise et al. 2007). For example, Allen et al. (2003) demonstrated that metabolite profiling of extracellular metabolites from 19 S. cerevisiae strains, each deleted for a single gene, could be used to group together related genes.
We sought to quantify the variation in amine-containing metabolites among a collection of nearly 5000 yeast strains, each lacking a single gene. We developed data analysis tools and used established genomics analysis methods to identify groups of related genes.
Metabolomic analysis of this collection of yeast strains demonstrates the biochemical effects of genetic perturbations and the feasibility of using metabolite levels to classify numerous genes in a large set of genetic variants.
Results
Derivatization, separation, and identification of amino acids
We grew the approximately 5000 strains of the yeast deletion collection overnight in 96-well plates containing synthetic complete media and measured growth with the Victor V3 plate reader. Saturated cultures on this instrument have an approximate OD600 of 0.8. The median optical density measurement was 0.370, with 80% of the measurements falling between an OD600 of 0.3 and 0.6; 18% of the strains grew more slowly (OD600 below 0.3), and only 2% approached saturation with an OD600 of >0.6. We performed a cold methanol extraction of small molecules from the yeast cells and derivatized the extracts with the amine-reactive fluorophore, 4-nitro-7-benzofurazan (NBD-F) (Villas-Boas et al. 2005; Zhu et al. 2005). Capillary electrophoresis was used to separate the derivatized samples and detection was achieved by laser-induced fluorescence. The separations took approximately 8 min, which allowed the entire collection to be screened in approximately 2 mo. Strains were screened in duplicate, starting from fresh yeast colonies. Separation resulted in a trace of approximately 20 peaks, each corresponding to a single amino acid or, in a few cases, a mix of two to three amino acids (Fig. 1).
Figure 1.

Canonical trace from a S. cerevisiae extract. Following overnight growth in synthetic complete media, yeast cultures were extracted with cold methanol. The extract was labeled with NBD-F, which fluorescently labels amine groups, and separated by capillary electrophoresis. The separation occurs in less than 10 min. Peaks were assigned by spike-in experiments and are labeled 1–18, corresponding to the compounds shown. Intensity, measured in relative fluorescent units, correlates with relative amino acid concentration. (Lysine has two peaks as it has two reactive amine groups and therefore can be labeled once or twice.)
We determined the identity of the peaks by spike-in experiments, in which a concentrated solution of each amino acid (see Methods for list) was added to a yeast extract. We concluded that comigration of a peak in the sample with the spiked amino acid was positive identification of the comigrating peak as that amino acid. We further verified the peak identities by quantifying amino acids with the capillary electrophoresis method and a two-dimensional gas chromatography–mass spectrometry approach. These data showed that in the four samples we compared, 12 out of 13 amino acids measured by both methods were correlated at R 2 > 0.7 (six out of 13 had R 2 > 0.9). The one amino acid that did not show a high correlation was glutamine, which does not separate from valine by capillary electrophoresis under these conditions. These data indicate that the peak assignments are valid and that contamination from other amine-containing small molecules made up a minority of the signal.
Peak alignment and assignment
To streamline analysis of this large data set, we developed a computational pipeline. The methods we employed address the challenges presented with this type of data. We had to normalize for variability in migration times between plates (day-to-day) and variability in migration times on a given day while maintaining the ability to identify variation in peak size due to biological differences between samples. Five representative traces chosen randomly from five different plates, run on different dates, demonstrate the variability we observed in migration times between plates (Fig. 2, left panel).
Figure 2.

The CRAWDAD algorithm was used to align traces. Raw data collected using the 32Karat software show variability in migration time depending on the date of sample collection. The software program CRAWDAD uses dynamic time warping to achieve optimal alignment of raw data by minimizing distance between traces. Five traces from five different plates are plotted before (left) and after (right) alignment with the two steps of the CRAWDAD alignment. Time is plotted along the x-axis in minutes; intensity in relative fluorescent units is plotted along the y-axis.
We developed a method to align the traces that corrects for variability in retention time by adapting the software program CRAWDAD (see Methods), originally written to align chromatograms obtained from liquid chromatography–mass spectrometry (Finney et al. 2008). The software uses dynamic time warping to invoke nonuniform shrinking and stretching along the time axis, within set parameters, to achieve optimal alignment between each trace and a template. This method performs alignment and provides an alignment score between the template and sample traces that can be used to filter data that align poorly. The aligned output from CRAWDAD for the five traces is shown in Figure 2, right panel.
Once the alignment was complete, a dynamic programming algorithm was implemented to assign peaks to amino acids. The algorithm matches peaks from each sample to a manually curated canonical trace. The algorithm calculates a matrix of similarity scores based on aligned retention times and peak size and optimizes matching of each peak in the sample to an amino acid in the template. The output of this algorithm is a list of amino acid concentrations for each sample. After alignment and peak assignment, we used quality control thresholds to eliminate data of poor quality or traces with poor alignments. We obtained a quantitative measurement of each amino acid by integrating the area under each peak. We analyzed 4382 samples with data meeting quality standards for at least one replicate. Using this pipeline, we estimated based on manual curation of 20 randomly selected traces that ∼90% of the peaks were called correctly.
Because downstream analyses rely heavily on these alignments, we added an additional step of manual adjustment to improve accuracy. Manual adjustment consisted of identification of traces with missing or additional peaks compared with others in the plate, followed by visual inspection of the trace and manual changes to the peak assignment where necessary. Although there is still error in the resulting data set, the peak calling improved from ∼90% correct calls before the manual adjustment. Since we do not have a gold standard, we could not quantify the error rate in the manually adjusted traces, but we observed one measurable improvement in the traces. We measured the correlation between the values of the two lysine peaks (one peak for single-labeled, one for double-labeled lysine). The sizes of the peaks representing these two species should be highly correlated. Before manual adjustment, the correlation between the two peaks over all samples was R 2 = 0.62, whereas after adjustment the correlation increased to R 2 = 0.88.
Arginine pathway mutants display profiles consistent with their gene deletions
As a test case, we examined strains carrying mutations in arginine biosynthesis to determine whether they recapitulate known features of the arginine biosynthetic pathway. Compared with the parent strain, BY4742, arginine mutants had only one-quarter the arginine in the extract (Fig. 3). In addition, they each accumulated the expected metabolite based on the arginine biosynthetic pathway: arg1, a sevenfold increase in citrulline; arg4, a threefold increase in citrulline; and arg3, a sixfold increase in ornithine. These three mutants, as well as the arg2, arg5,6, and arg7 mutants, all accumulated lysine (two- to fourfold). Other studies have noted that mutants in arginine biosynthesis, particularly those that accumulate ornithine, also accumulate lysine, perhaps through the breakdown of ornithine (Caddick et al. 2007). Arginine mutants grew to an optical density within one standard deviation of the mean optical density, indicating that their metabolite changes are not accounted for by reduced growth rate.
Figure 3.

Arginine pathway mutants lack arginine and build up pathway intermediates. (A) Three data traces of arg mutants are displayed, as collected via the high-throughput data pipeline, and compared with the parental strain trace. Numbers above the peaks indicate percentage area. The arg1, arg3, and arg4 mutants show depletion of arginine compared with the levels in the parental strain trace. As expected from the arginine synthetic pathway, the arg1 and arg4 mutants accumulate citrulline and the arg3 mutant accumulates ornithine. All three mutants accumulate lysine. (B) Metabolite conversions in the arginine pathway of yeast. The gene names above the arrows correspond to the enzyme catalyzing the reaction indicated.
Slow growing strains have a characteristic metabolite profile
Our initial analysis of the data suggested that it was relevant to explore the dependence of metabolite profiles on growth. The greatest correlations we identified were between growth rate (measured optical densities) and lysine levels (lysine peak 1 versus OD600, R = −0.32 and peak 2, R = −0.37). We compiled a list of strains that had reduced growth rate based on our measurements and were annotated as slow growers by Giaever et al. (2002). By comparing amino acid levels in strains with slow growth to normal growing strains, we confirmed our initial finding and additionally identified significant accumulations of ornithine, lysine, leucine, and N-acetyl ornithine, as well as depletion of glutamine in slow growers (Supplemental Table 1). Because some amino acid levels correlated with growth, further analyses distinguished between changes that are dependent on or independent of growth phenotypes. For example, an enrichment of genes known to influence telomere maintenance (Gatbonton et al. 2006) among strains accumulating lysine was confounded by a slow growth phenotype (∼40% of mutants deleted for genes involved in telomere maintenance have a slow growth phenotype, compared with ∼10% of all genes). Enrichment of the Gene Ontology (GO) term “telomere maintenance” in strains with high lysine levels was not observed among strains with normal growth.
Characterization of strains with extreme amino acid levels
We asked whether strains with a significant change in amino acid level were enriched for functionally related genes. We might expect strains with low levels of an amino acid to carry deletions of genes involved in synthesis of that amino acid. Ranking all strains for arginine level, we found that the arg1, arg3, arg4, and arg5,6 mutants are among the strains with the arginine content. In agreement with our initial view, a GO analysis of genes deleted in strains with low levels of arginine shows significant enrichment for genes involved in arginine biosynthesis (P = 0.01; Table 1).
Table 1.
GO enrichment among strains with extreme levels of an individual amino acid

For each amino acid measured, a list of strains with statistically significantly increased or decreased levels (greater than threefold above or below the average among all strains) was assessed for GO term enrichment. P-values were calculated using the HIDRA visualization software with a Bonferonni correction for multiple hypothesis testing.
N/S, No significant enrichments identified among this class.
Among other strains with low arginine levels, there was also a significant enrichment for deletion of genes involved in vacuole organization (VAM7, VMA22, VPH2, VMA5, and VPS41). Three of these genes are involved in assembly of the vacuolar ATPase (VMA5, VPS2, and VMA22). Arginine transport into the vacuole is regulated in order to maintain an acidic pH, and the vacuolar ATPase plays a role in that regulation (Forgac 1999). A functional vacuolar ATPase is required for arginine transport into the vacuole (Kim et al. 2003). Our data are consistent with these results and suggest that failure to assemble the ATPase results in reduced levels of intracellular arginine. While these data cannot distinguish vacuolar arginine from cytosolic arginine, they suggest that vacuolar arginine is reduced, leading to an overall reduction in intracellular arginine.
We conducted a similar analysis for each amino acid, identifying groups of strains with extreme levels of each amino acid and testing for significant enrichment of GO terms among the genes deleted in these strains (Table 1). Some of these results are consistent with known pathways; for example, strains accumulating ornithine were more frequently deleted in genes involved in the urea cycle. Other results are less readily explicable; for example, strains accumulating lysine were enriched for deletion of genes involved in RNA localization and transport.
Clustering strains based on metabolite profiles can reveal functionally related genes
In addition to ranking genes by individual amino acid levels, we used hierarchical clustering to identify groups of genes with similar amino acid profiles (Fig. 4A). We clustered all data and identified clusters based on accumulation or depletion of an amino acid, or group of amino acids, without regard to a specific correlation threshold. In the arginine biosynthetic pathway cluster, mutants for other related genes are also found (Fig. 4B). Clustering together with strains deleted for ARG1, ARG3, ARG4, and ARG5,6, we found strains deleted for TPO2, a spermine transporter; CPA1, an enzyme in citrulline biosynthesis; YOR302W, a regulatory uORF for CPA1; ORT1, an ornithine transporter necessary for arginine biosynthesis; and DOA4, a ubiquitin isopeptidase known to regulate ammonia-sensitive amino acid permeases (Jauniaux et al. 1987; Vandenbol et al. 1987).
Figure 4.

Hierarchical clustering of metabolite profiles. (A) To identify groups of related genes, we ordered 4337 yeast deletion strains using hierarchical clustering as implemented by Cluster software. Columns represent each amino acid as labeled in B. Rows correspond to the profile of a strain lacking a single gene. Yellow represents an increased metabolite level relative to the normalized average; blue represents a decreased level, as indicated in the scale (bottom left). The highlighted region is expanded in panel B. (B) A single cluster of strains showing decreased levels of arginine contains several arginine mutants. This cluster also shows increased lysine and increased citrulline. Along with the arginine mutants, this group with reduced arginine levels is enriched for mutants in mitochondrial protein genes (highlighted in red).
In a second cluster with similar features, we found genes encoding proteins of the mitochondria (Fig. 4B). In this cluster, there are 15 genes annotated as “mitochondria or mitochondria part.” The steps of arginine biosynthesis from glutamate to ornithine occur in the mitochondria. These data suggest that mutations altering mitochondrial structure or function also affect arginine biosynthesis. In addition, two strains are deleted for genes with uncharacterized function: YKR023W, encoding a protein that localizes to mitochondria, and YMR155W, which may play a role in a cell cycle checkpoint. Our data support the localization data for the YKR023W protein and suggest that YMR155W may also have a role in mitochondrial function.
Ribosomal protein gene deletion strains have a unique metabolite profile
Based on the clustering algorithm and increased levels of lysine, we identified a set of strains that accumulated an unusual metabolite that did not correspond to any assigned amino acid (Fig. 5). Assays of high concentrations of a lysine standard by capillary electrophoresis resulted in a comigrating peak; therefore, it is likely that this metabolite is biochemically related to lysine and may correspond to a lysine degradation product or multimer, or a modified lysine.
Figure 5.

Deletion of ribosomal proteins causes accumulation of lysine and a lysine-related molecule. (A) Traces of rps19a and rps19b mutants, compared with the trace of the parental strain. The two ribosomal protein mutant strains show significant accumulation, exceeding that observed in slow growers alone, of both lysine and a lysine-related molecule compared with the parent strain. (To generate these data, we regrew and made fresh extracts of these strains, as the rps19a mutant seemed to have a suppressor mutation in the original set, as has been observed previously [Steffen et al. 2008].) (B) Hierarchical clustering of all strains reveals a group of genes, enriched for ribosomal proteins, with accumulation of lysine and the lysine-related metabolite. The rps19b mutant is shown separately as it does not cluster with this group but shows a similar pattern.
Among strains with this profile, 40 contain deletions of genes annotated as “structural component of the ribosome,” a significant enrichment compared with random (P = 0.012). Of all strains lacking a ribosomal protein gene, 40% showed at least some accumulation of this unidentified molecule. This phenotype was also observed in strains with regulated expression of an essential ribosomal protein gene. Loss of expression in three of seven strains tested led to the accumulation of lysine and this related molecule (data not shown). Because several strains in this cluster are slow growers, we considered slow growers alone. Among these strains, the lysine-related metabolite accumulated in strains deleted for genes assigned to the GO categories: ribosome, P = 0.003; large ribosomal subunit, P = 0.002; and telomere maintenance, P = 0.0017, χ2 test.
A striking example of the accumulation of the lysine-related metabolite occurs in strains lacking the ribosomal protein gene RPS19A or RPS19B (Fig. 5A). In humans, mutations in RPS19 and other ribosomal protein genes result in the rare disorder Diamond-Blackfan anemia. Deletion of other yeast genes (RPS7A/B and RPS17A/B) homologous with those known to cause Diamond-Blackfan anemia resulted in similar accumulations of lysine and this unidentified metabolite. We sought to determine whether the phenotype observed in yeast has parallels in human cells. We used siRNA to reduce the level of RPS19 in the human cell line K-562, a multipotent hematopoetic lymphoblast cell line, and observed a small but reproducible accumulation of lysine and a peak comigrating with the lysine-related metabolite observed in the rps19 yeast strains (Supplemental Fig. 1). Knockdown of RPS19 in two epithelial cell lines (RKO and HEK293) did not result in these metabolite accumulations (data not shown). While the genetic causes of Diamond-Blackfan anemia are known, the pathophysiology of the disease is just beginning to be understood (McGowan et al. 2008). Based on these preliminary experiments, the metabolite changes seen in yeast that occur to a more limited extent in the K-562 human cells may warrant further investigation.
Discussion
Here, we demonstrate that small molecule metabolite profiling, using fluorescent derivatization and capillary electrophoresis, can be carried out on a scale of thousands of samples over a short period of time. Using this technology to profile amino acids, we identified among strains with altered profiles both genes known to be involved in amino acid biosynthesis as well as many other classes of genes. In fact, 729 strains had at least one amino acid with a minimum eightfold change compared with the parent strain. Considering that ∼135 nonessential genes are known to be involved in amino acid metabolism (Kanehisa and Goto 2000), it may be surprising that so many genes affect amino acid quantities in the cell. However, 1293 yeast genes are annotated as involved in metabolism (Christie et al. 2004), and our data support a role for genes involved in organelle structure and function affecting amino acid metabolism. These results suggest that a variety of factors affect the levels of amino acids, including vacuolar structure and mitochondrial activity/efficiency. It is also encouraging that a small number of metabolites may be diagnostic for gene function in many cellular processes.
While we demonstrated a convincing pattern of metabolite accumulations among some known biochemical pathways, we did not observe the clustering of genes involved in the metabolism of amino acids outside the arginine and urea cycle pathways. One possible explanation is that the media contained 14 of the 20 coding amino acids, such that in many cases cells could import amino acids or precursors and maintain their intracellular amino acid levels. Another factor that could affect metabolic phenotypes is the parent strain of the deletion collection, which contains auxotrophies for histidine, leucine, and lysine. These mutations could affect amino acid levels. Another potential explanation for unexpected phenotypes among known amino acid biosynthesis mutants is the accumulation of unknown mutations in the deletion strains. Other groups have noted increased rates of aneuploidy (Hughes et al. 2000) and other mutations among these strains (Huang and O'Shea 2005). Most of these mutations increase growth rate, suggesting that they more likely lead to false negatives rather than false positives. Finally, arginine and the other urea cycle amino acids are isolated from the remaining amino acids in the biosynthetic pathway. Whereas the arginine biosynthetic pathway is essentially linear, synthesis of many of the other amino acids can be accomplished by conversion from several other precursors. The result may be that the loss of a single gene in many amino acid biosynthesis pathways does not drastically affect cellular amino acid levels under these conditions.
This data set demonstrates that large-scale characterization of small molecules in biological systems can contribute to an understanding of cell biology and human disease. Even in S. cerevisiae, more than 900 genes remain uncharacterized. Analyzing only amino acids, we could classify some genes based on the clustering of similar profiles. We also identified an interesting phenotype that may be relevant to the human disease Diamond-Blackfan anemia. Accumulation of a metabolite in both a yeast mutant and a human cell line treated with siRNA to reduce expression of the homologous gene suggests the possibility of a parallel mechanism.
Metabolite profiling offers the opportunity to continue to characterize the function of every gene in the genome. Methods such as the fluorescent derivatization approach described here should further the understanding of biology as a system beyond DNA, transcripts, and proteins.
Methods
Yeast strains
Haploid yeast deletion strains of the MATa mating type were obtained from Open Biosystems (YSC1053), originally constructed as part of the Saccharomyces Genome Deletion Project (Winzeler et al. 1999). We obtained the tet-promoter collection allowing regulation of essential genes by doxycycline from Open Biosystems (YSC1182) (Mnaimneh et al. 2004). Yeast growth was in synthetic complete media (adenine 140 μM, arginine 109 μM, aspartic acid 720 μM, glutamic acid 651 μM, histidine 122 μM, isoleucine 579 μM, leucine 579 μM, lysine 390 μM, methionine 127 μM, phenylalanine 289 μM, serine 3.64 μM, threonine 1.6 μM, tryptophan 372 μM, tyrosine 314 μM, and valine 1.19 μM). Initial tests with YPD, synthetic complete and a minimal media suggested that synthetic complete media provided a good compromise between YPD, where some phenotypes may be masked, and the minimal media where several of the tested strains grew very slowly, and therefore would not be ideal for high-throughput growth.
Sample collection
After overnight growth of yeast, optical densities (OD600) were measured in 96-well format using the Victor3V spectrophotometer/fluorometer (Perkin Elmer). Methanol extraction was performed in 96-well format based on (Villas-Boas et al. 2005). In brief, cells were grown for ∼16 h in synthetic complete media in deep-well 96 well plates (VWR). Cells were spun down, washed with water, and resuspended in 75 μL of water. We added 75 μL of cold methanol and incubated the cell suspension in a dry-ice ethanol bath for 30 min. After thawing on ice, we centrifuged samples and saved the supernatant containing the small molecule metabolites. Samples were stored frozen at −80°C until derivatization.
Derivatization and separation
We performed derivatizations based on previously published work (Tsunoda et al. 1999; Zhu et al. 2005). We conducted all protocols in 96-well format. We thawed extracts on ice and combined 20 μL of cell extract with 2 μL of 185 mM NBD-F (Anaspec) and incubated the samples at 55°C for 15 min in a thermal cycler. After incubation, we brought the volume to 100 μL by adding 78 μL of running buffer (10 mM tetraborate at pH 9.3 [Microsolv], 35 mM sodium deoxycholate [Sigma], 7.5 mM methyl-beta-cyclodextrin [Sigma]). Samples were injected electrokinetically at 10 keV and separated at 15°C for 8 min in a 40-cm fused silica capillary with a voltage of −30 keV using the Beckman ProteomeLab PA800.
Essential gene knockdown
These strains were constructed by Mnaimneh et al. (2004). We followed the published protocol for growing the strains and knocking down gene expression. Yeast strains with tet-off controlled versions of an essential gene were used to inoculate 1-mL cultures. These cultures were grown overnight. After 16 h, doxycycline was added to each sample at a final concentration of 1 μg/mL and cultures continued to grow for 8 h.
Amino acid spike-ins for peak assignment
Standards of 1 mM were derivatized with NBD-F and spiked into an extract from the parent strain (BY4742) to determine the peak identifies for each amine-containing metabolite. Overlap of a standard with a peak in the wild-type extract indicated that the peak contains that compound. The following amine-containing molecules were tested: all 20 coding amino acids, spermidine, spermine, ornithine, citrulline, glutathione, biotin, creatine, N-acetyl lysine, N-acetyl ornithine, N-acetyl aspartate, diaminobutane, carnitine, and carnosine (all from Sigma-Aldrich).
Capillary electrophoresis data analysis
Using Beckman's 32Karat, we exported fluorescence intensity measurements taken at a frequency of 4 Hz for each trace and integration data (migration time, percentage area, height and width for each peak) (Supplemental Tables 2A,B, 3A,B). We performed a background subtraction of the trace data, subtracting three times the mode signal over the length of the trace to minimize alignment based on background. To align traces, we implemented a version of CRAWDAD modified for single-channel data, which uses a dynamic time warping to align the exported chromatograms (Finney et al. 2008). To minimize the effects of plate-to-plate variation, we chose the template from each plate that had the highest average correlation before alignment to the remaining traces in the plate. We then used CRAWDAD for a second round of alignment, aligning all 52 traces to a master template chosen in the same way.
Here we describe the adaptation of CRAWDAD to the single channel data. A single CE template was used for alignment in a pairwise fashion. First, the optimal linear shift between a trace A and a template trace T was determined by a cross-correlation between A and T. Second, a nonlinear warping was determined using a variant of dynamic time warping to find an optimal set of time corrections to align A with T. A score matrix S of the similarities between time points of T,A was calculated using the normalized distance between values
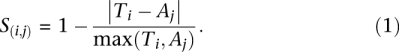 |
The path score P was built iteratively by adding the scores from the cells of S multiplied by a weight dependent upon whether the transition used signifies a stretch in A relative to T, a shrink in A relative to T, or an equal time progression in both runs (Equation 2)
 |
A set of weights w = {1, 2.5, 1} was used to give a slight bias when no relative change in retention time is made between the runs, diminishing jitter in the alignment. Dynamic programming was used to find the optimal score through P. Finally, a bicubic linear spline was fitted to P, and used to provide a smoother path.
Following alignment of all the traces, we eliminated data for which correlation with the template was below 0.35. Once the traces were aligned, we transformed the peak data generated by 32Karat based on the CRAWDAD alignments. To assign each peak in the trace to an amino acid peak we implemented a dynamic programming algorithm that assigns sample peaks to a manually generated template based on a composite of peaks observed in the whole data set. Similar to what was performed by Robinson et al. (2007), the dynamic programming algorithm forces aligning peaks to emerge in the same order in the template as the sample and assigns the peak identity based on a scoring scheme incorporating migration time and size. The resulting output is a quantification of peak area correlating to relative amino acid concentration in each profile. In a final step, profiles generated by computation were manually inspected by scanning the files for outliers and visually examining the raw data to confirm or revoke the peak assignment. In the cases where a mistake was identified, the data were manually adjusted.
Data normalization
For each sample, a log2-transformed ratio of the amino acid quantity in the sample to the average for the plate was calculated. This ratio corrects for plate effects. All peak areas were calculated before the CRAWDAD alignments were run to avoid the potential complication of altering area by uneven time warping of the trace. An average of the two replicates was calculated (Supplemental Table 4). In the case where only one quality trace was collected, those data were used alone.
Clustering and GO analysis
Normalized data were clustered by profile similarity. We used Cluster software (Eisen et al. 1998) to implement hierarchical clustering of the log-transformed ratios based on uncentered correlation and visualized the clusters using Java Treeview and HIDRA (Saldanha 2004). GO analysis was part of the HIDRA software package. The parameters for GO analysis used a Bonferonni correction for multiple hypothesis testing and had a cutoff of P < 0.05 (Hibbs et al. 2008).
Amino acid profiling by GCxGC-MS
Extractions were performed as described above. Solvent was removed from 100 μL of extract using a SpeedVac on medium heat. Excess water was removed by adding 100 μL of methylene chloride and drying again. Trimethylsilylation derivatization was performed in glass as described (Humston et al. 2008; Mohler et al. 2008). In brief, to each sample, we added 30 μL of a 20-mg/mL solution of methoxyamine in pyridine to protect carbonyl groups. We heated the samples for 90 min at 30°C. Then, we added 70 μL of N-methyl-N-trifluoroacetamide (MSTFA) with 1% trichloromethylsilane (TCMS) (Thermo Fisher Scientific) and incubated for 60 min at 60°C. The samples were assayed immediately after derivatization on a Leco 4D GCxGC-TOFMS system (Leco). The primary column is a 20-m × 250-μm i.d. × 0.5 μm RTX-5MS film (Restek), and the secondary column is a 2-m × 180-μm i.d. × 0.2-μm RTX-200MS film (Restek). Injections of 1 μL were made in split mode with a split ratio of 1:5. The inlet was set to 280°C, and the transfer line was set to 305°C. Flow rate for the carrier gas, helium, was 1 mL/min. Initial oven temperatures were 60°C for the primary oven and 75°C for the secondary oven. Modulator temperature was maintained at 30°C above the primary oven temperature. Oven temperatures were increased at a rate of 7°C/min to final temperatures of 325°C and 340°C, respectively. The modulation time for the second dimension was 5 sec with 0.4 sec hot, 2.1 sec cold. The ion source was set at 250°C, and data were collected at a rate of 100 spectra per second after a 7-min solvent delay. The total run time was ∼50 min. Data were processed using the Chromatof 4.22 software for deconvolution and peak calling. For each amino acid, quantification was based on counts of the m/z 73 ion, the mass-to-charge ratio of the fragment released from the derivatized molecules. Each compound was identified by searching acquired spectra against the NIST library and the commercially available Fiehn Library (Leco) (Kind et al. 2009), as well as by comparison to spectra obtained from standards. We assayed standards at multiple concentrations to demonstrate that the mass spectrometry data were within the linear range.
siRNA knockdown of RPS19 in human cell lines
We knocked down the RPS19 gene in three different human cell lines: RKO, a colon cancer epithelial cell line; HEK293, a kidney epithelial cell; and K-562 cells, a multipotent hematopoetic lymphoblast cell line. All cells were grown under conditions suggested by ATCC with 10% fetal bovine serum. Cells were transfected with 30 pmol of siRNA from Qiagen with target sequence, TACCGTCAAGCTGGCCAAGCA (Qiagen). Approximately 5 × 10⁵ cells were seeded in each well of a six-well plate and transfected using 30 μL of HiPerfect transfection reagent following the HiPerfect protocol. Transfections of RKO and HEK293 were performed once, and transfections of K-562 cells were performed in triplicate on different days. After 24 h, cells were harvested for RNA isolation and metabolite extraction. Cold methanol extraction was performed on one-fifth of the cells, following the yeast protocol, except the cell wash was performed with phosphate buffered saline. Extracts were labeled and separated using the same protocol as the yeast except the extracts were run on a 50-cm capillary to increase resolution as the human cell line samples were more complex. For this reason, migration times in this panel are not comparable to other figures. Total RNA was isolated from the remaining four-fifths of the cells using the Qiagen RNAeasy Mini Kit. RNA was treated with DNase for 60 min at 37°C, and then 1 μg of RNA was reverse transcribed using the Superscript III kit (Invitrogen) as directed, except that we used 100 ng of random hexamer primers. Following reverse transcription, the reaction was treated with RNase H for 20 min at 37°C. Knockdown was assessed by quantitative real-time PCR using two sets of primers to RPS19, one set each to exons 3 and 4. QPCR was performed using the LightCycler 480 SYBR Green I Master mix (Roche) with a final primer concentration of 0.5 μM. Data were collected on the LightCycler 480 (Roche), and the levels of RPS19 transcript were normalized to the mean of the levels of actinB and gapdh transcripts. Fold change siRNA was calculated relative to a mock siRNA treatment. Primer sequences were exon3L, GAAGCTGAAAGTCCCCGAATG; exon3R, CAGTTCTCATCGTAGGGAGCAAG; exon4L, AGCCGAGGCTCCAAGAGTGT; exon4R, ATCTTGGTCCTTTTCCACCATTT; actbR, CGGGACCTGACTGACTACCTCAT; actbL, CTCCTTAATGTCACGCACGATTT; gapdhR, AGGAAATGAGCTTGACAAAGTGG; gapdhL, GGTGGTCTCCTCTGACTTCAACA.
Acknowledgments
We thank all members of the Fields lab, especially Doug Fowler, for feedback and technical support. We thank Richard James, Andrew Sturgachis, and John Stamatoyannopoulos' lab for cell lines and reagents. S.J.C was funded by F32 DK080608 from the NIH. This work was supported by P41 RR11823 from the NIH. S.F. is an investigator of the Howard Hughes Medical Institute.
Footnotes
[Supplemental material is available online at http://www.genome.org.]
Article published online before print. Article and publication date are at http://www.genome.org/cgi/doi/10.1101/gr.105825.110.
References
- Allen J, Davey HM, Broadhurst D, Heald JK, Rowland JJ, Oliver SG, Kell DB 2003. High-throughput classification of yeast mutants for functional genomics using metabolic footprinting. Nat Biotechnol 21: 692–696 [DOI] [PubMed] [Google Scholar]
- Blaise BJ, Giacomotto J, Elena B, Dumas ME, Toulhoat P, Segalat L, Emsley L 2007. Metabotyping of Caenorhabditis elegans reveals latent phenotypes. Proc Natl Acad Sci 104: 19808–19812 [DOI] [PMC free article] [PubMed] [Google Scholar]
- Caddick SE, Harrison CJ, Stavridou I, Johnson S, Brearley CA 2007. A lysine accumulation phenotype of ScIpk2Δ mutant yeast is rescued by Solanum tuberosum inositol phosphate multikinase. Biochem J 403: 381–389 [DOI] [PMC free article] [PubMed] [Google Scholar]
- Christie KR, Weng S, Balakrishnan R, Costanzo MC, Dolinski K, Dwight SS, Engel SR, Feierbach B, Fisk DG, Hirschman JE, et al. 2004. Saccharomyces Genome Database (SGD) provides tools to identify and analyze sequences from Saccharomyces cerevisiae and related sequences from other organisms. Nucleic Acids Res 32: D311–D314 [DOI] [PMC free article] [PubMed] [Google Scholar]
- Edgar R, Domrachev M, Lash AE 2002. Gene Expression Omnibus: NCBI gene expression and hybridization array data repository. Nucleic Acids Res 30: 207–210 [DOI] [PMC free article] [PubMed] [Google Scholar]
- Eisen MB, Spellman PT, Brown PO, Botstein D 1998. Cluster analysis and display of genome-wide expression patterns. Proc Natl Acad Sci 95: 14863–14868 [DOI] [PMC free article] [PubMed] [Google Scholar]
- Finney GL, Blackler AR, Hoopmann MR, Canterbury JD, Wu CC, MacCoss MJ 2008. Label-free comparative analysis of proteomics mixtures using chromatographic alignment of high-resolution muLC-MS data. Anal Chem 80: 961–971 [DOI] [PubMed] [Google Scholar]
- Forgac M 1999. Structure and properties of the vacuolar (H+)-ATPases. J Biol Chem 274: 12951–12954 [DOI] [PubMed] [Google Scholar]
- Gatbonton T, Imbesi M, Nelson M, Akey JM, Ruderfer DM, Kruglyak L, Simon JA, Bedalov A 2006. Telomere length as a quantitative trait: Genome-wide survey and genetic mapping of telomere length-control genes in yeast. PLoS Genet 2: e35 doi: 10.1371/journal.pgen.0020035 [DOI] [PMC free article] [PubMed] [Google Scholar]
- Giaever G, Chu AM, Ni L, Connelly C, Riles L, Veronneau S, Dow S, Lucau-Danila A, Anderson K, Andre B, et al. 2002. Functional profiling of the Saccharomyces cerevisiae genome. Nature 418: 387–391 [DOI] [PubMed] [Google Scholar]
- Gieger C, Geistlinger L, Altmaier E, Hrabe de Angelis M, Kronenberg F, Meitinger T, Mewes HW, Wichmann HE, Weinberger KM, Adamski J, et al. 2008. Genetics meets metabolomics: A genome-wide association study of metabolite profiles in human serum. PLoS Genet 4: e1000282 doi: 10.1371/journal.pgen.1000282 [DOI] [PMC free article] [PubMed] [Google Scholar]
- Hibbs MA, Wallace G, Dunham M, Li K, Troyanskaya OG 2008. Viewing the larger context of genomic data through horizontal integration. Proc IEEE Comput Sci 11th Int Conf Information Visualization 2008: 326–334 [Google Scholar]
- Huang S, O'Shea EK 2005. A systematic high-throughput screen of a yeast deletion collection for mutants defective in PHO5 regulation. Genetics 169: 1859–1871 [DOI] [PMC free article] [PubMed] [Google Scholar]
- Hughes TR, Roberts CJ, Dai H, Jones AR, Meyer MR, Slade D, Burchard J, Dow S, Ward TR, Kidd MJ, et al. 2000. Widespread aneuploidy revealed by DNA microarray expression profiling. Nat Genet 25: 333–337 [DOI] [PubMed] [Google Scholar]
- Huh WK, Falvo JV, Gerke LC, Carroll AS, Howson RW, Weissman JS, O'Shea EK 2003. Global analysis of protein localization in budding yeast. Nature 425: 686–691 [DOI] [PubMed] [Google Scholar]
- Humston EM, Dombek KM, Hoggard JC, Young ET, Synovec RE 2008. Time-dependent profiling of metabolites from Snf1 mutant and wild type yeast cells. Anal Chem 80: 8002–8011 [DOI] [PMC free article] [PubMed] [Google Scholar]
- Jauniaux JC, Vandenbol M, Vissers S, Broman K, Grenson M 1987. Nitrogen catabolite regulation of proline permease in Saccharomyces cerevisiae. Cloning of the PUT4 gene and study of PUT4 RNA levels in wild-type and mutant strains. Eur J Biochem 164: 601–606 [DOI] [PubMed] [Google Scholar]
- Kanehisa M, Goto S 2000. KEGG: Kyoto encyclopedia of genes and genomes. Nucleic Acids Res 28: 27–30 [DOI] [PMC free article] [PubMed] [Google Scholar]
- Kim Y, Ramirez-Montealegre D, Pearce DA 2003. A role in vacuolar arginine transport for yeast Btn1p and for human CLN3, the protein defective in Batten disease. Proc Natl Acad Sci 100: 15458–15462 [DOI] [PMC free article] [PubMed] [Google Scholar]
- Kind T, Wohlgemuth G, Lee DY, Lu Y, Palazoglu M, Shahbaz S, Fiehn O 2009. FiehnLib: Mass spectral and retention index libraries for metabolomics based on quadrupole and time-of-flight gas chromatography/mass spectrometry. Anal Chem 81: 10038–10048 [DOI] [PMC free article] [PubMed] [Google Scholar]
- Krogan NJ, Cagney G, Yu H, Zhong G, Guo X, Ignatchenko A, Li J, Pu S, Datta N, Tikuisis AP, et al. 2006. Global landscape of protein complexes in the yeast Saccharomyces cerevisiae. Nature 440: 637–643 [DOI] [PubMed] [Google Scholar]
- McGowan KA, Li JZ, Park CY, Beaudry V, Tabor HK, Sabnis AJ, Zhang W, Fuchs H, de Angelis MH, Myers RM, et al. 2008. Ribosomal mutations cause p53-mediated dark skin and pleiotropic effects. Nat Genet 40: 963–970 [DOI] [PMC free article] [PubMed] [Google Scholar]
- Minami Y, Kasukawa T, Kakazu Y, Iigo M, Sugimoto M, Ikeda S, Yasui A, van der Horst GT, Soga T, Ueda HR 2009. Measurement of internal body time by blood metabolomics. Proc Natl Acad Sci 106: 9890–9895 [DOI] [PMC free article] [PubMed] [Google Scholar]
- Mnaimneh S, Davierwala AP, Haynes J, Moffat J, Peng WT, Zhang W, Yang X, Pootoolal J, Chua G, Lopez A, et al. 2004. Exploration of essential gene functions via titratable promoter alleles. Cell 118: 31–44 [DOI] [PubMed] [Google Scholar]
- Mohler RE, Dombek KM, Hoggard JC, Young ET, Synovec RE 2006. Comprehensive two-dimensional gas chromatography time-of-flight mass spectrometry analysis of metabolites in fermenting and respiring yeast cells. Anal Chem 78: 2700–2709 [DOI] [PMC free article] [PubMed] [Google Scholar]
- Mohler RE, Tu BP, Dombek KM, Hoggard JC, Young ET, Synovec RE 2008. Identification and evaluation of cycling yeast metabolites in two-dimensional comprehensive gas chromatography-time-of-flight-mass spectrometry data. J Chromatogr A 1186: 401–411 [DOI] [PMC free article] [PubMed] [Google Scholar]
- Raamsdonk LM, Diderich JA, Kuiper A, van Gaalen M, Kruckeberg AL, Berden JA, Van Dam K 2001a. Co-consumption of sugars or ethanol and glucose in a Saccharomyces cerevisiae strain deleted in the HXK2 gene. Yeast 18: 1023–1033 [DOI] [PubMed] [Google Scholar]
- Raamsdonk LM, Teusink B, Broadhurst D, Zhang N, Hayes A, Walsh MC, Berden JA, Brindle KM, Kell DB, Rowland JJ, et al. 2001b. A functional genomics strategy that uses metabolome data to reveal the phenotype of silent mutations. Nat Biotechnol 19: 45–50 [DOI] [PubMed] [Google Scholar]
- Robinson MD, De Souza DP, Keen WW, Saunders EC, McConville MJ, Speed TP, Likic VA 2007. A dynamic programming approach for the alignment of signal peaks in multiple gas chromatography-mass spectrometry experiments. BMC Bioinformatics 8: 419 doi: 10.1186/1471-2105-8-419 [DOI] [PMC free article] [PubMed] [Google Scholar]
- Rochfort S 2005. Metabolomics reviewed: A new “omics” platform technology for systems biology and implications for natural products research. J Nat Prod 68: 1813–1820 [DOI] [PubMed] [Google Scholar]
- Saldanha AJ 2004. Java Treeview—extensible visualization of microarray data. Bioinformatics 20: 3246–3248 [DOI] [PubMed] [Google Scholar]
- Sherlock G, Hernandez-Boussard T, Kasarskis A, Binkley G, Matese JC, Dwight SS, Kaloper M, Weng S, Jin H, Ball CA, et al. 2001. The Stanford Microarray Database. Nucleic Acids Res 29: 152–155 [DOI] [PMC free article] [PubMed] [Google Scholar]
- Sreekumar A, Poisson LM, Rajendiran TM, Khan AP, Cao Q, Yu J, Laxman B, Mehra R, Lonigro RJ, Li Y, et al. 2009. Metabolomic profiles delineate potential role for sarcosine in prostate cancer progression. Nature 457: 910–914 [DOI] [PMC free article] [PubMed] [Google Scholar] [Research Misconduct Found]
- Steffen KK, MacKay VL, Kerr EO, Tsuchiya M, Hu D, Fox LA, Dang N, Johnston ED, Oakes JA, Tchao BN, et al. 2008. Yeast life span extension by depletion of 60s ribosomal subunits is mediated by Gcn4. Cell 133: 292–302 [DOI] [PMC free article] [PubMed] [Google Scholar]
- Tong AH, Evangelista M, Parsons AB, Xu H, Bader GD, Page N, Robinson M, Raghibizadeh S, Hogue CW, Bussey H, et al. 2001. Systematic genetic analysis with ordered arrays of yeast deletion mutants. Science 294: 2364–2368 [DOI] [PubMed] [Google Scholar]
- Tsunoda M, Kato M, Fukushima T, Santa T, Homma H, Yanai H, Soga T, Imai K 1999. Determination of aspartic acid enantiomers in bio-samples by capillary electrophoresis. Biomed Chromatogr 13: 335–339 [DOI] [PubMed] [Google Scholar]
- Vandenbol M, Jauniaux JC, Vissers S, Grenson M 1987. Isolation of the NPR1 gene responsible for the reactivation of ammonia-sensitive amino-acid permeases in Saccharomyces cerevisiae. RNA analysis and gene dosage effects. Eur J Biochem 164: 607–612 [DOI] [PubMed] [Google Scholar]
- Villas-Boas SG, Hojer-Pedersen J, Akesson M, Smedsgaard J, Nielsen J 2005. Global metabolite analysis of yeast: Evaluation of sample preparation methods. Yeast 22: 1155–1169 [DOI] [PubMed] [Google Scholar]
- Wang J, Alexander P, Wu L, Hammer R, Cleaver O, McKnight SL 2009. Dependence of mouse embryonic stem cells on threonine catabolism. Science. 325, 435–439 [DOI] [PMC free article] [PubMed] [Google Scholar]
- Winzeler EA, Shoemaker DD, Astromoff A, Liang H, Anderson K, Andre B, Bangham R, Benito R, Boeke JD, Bussey H, et al. 1999. Functional characterization of the S. cerevisiae genome by gene deletion and parallel analysis. Science 285: 901–906 [DOI] [PubMed] [Google Scholar]
- Wishart DS 2007. Human Metabolome Database: Completing the ‘human parts list’. Pharmacogenomics 8: 683–686 [DOI] [PubMed] [Google Scholar]
- Zhu X, Shaw PN, Pritchard J, Newbury J, Hunt EJ, Barrett DA 2005. Amino acid analysis by micellar electrokinetic chromatography with laser-induced fluorescence detection: Application to nanolitre-volume biological samples from Arabidopsis thaliana and Myzus persicae. Electrophoresis 26: 911–919 [DOI] [PubMed] [Google Scholar]