Abstract
In this study, we explored the roles of microRNAs in adipocyte differentiation and metabolism. We first knocked down Argonaute2 (Ago2), a key enzyme in the processing of micro-RNAs (miRNAs), to investigate a potential role for miRNAs in adipocyte differentiation and/or metabolism. Although we did not observe dramatic differences in adipogenesis between Ago2 knock-down and control 3T3-L1 cells, incorporation of [14C]glucose or acetate into triacylglycerol, and steady-state levels of triacyglycerol were all reduced, suggesting a role for miRNAs in adipocyte metabolism. To study roles of specific miRNAs in adipocyte biology, we screened for miRNAs that are differentially expressed between preadipocytes and adipocytes for the 3T3-L1 and ST2 cell lines. Distinct subsets of miRNAs decline or increase during adipocyte conversion, whereas most miRNAs are not regulated. One locus encoding two miRNAs, 378/378*, contained within the intron of PGC-1β is highly induced during adipogenesis. When overexpressed in ST2 mesenchymal precursor cells, miRNA378/378* increases the size of lipid droplets and incorporation of [14C]acetate into triacylglycerol. Although protein and mRNA expression levels of C/EBPα, C/EBPβ, C/EBPδ, and PPARγ1 are unchanged, microarray and quantitative RT-PCR analyses indicate that a set of lipogenic genes are upregulated, perhaps due to increased expression of PPARγ2. Knock-down of miRNA378 and/or miRNA378* decreases accumulation of triacylglycerol. Interestingly, we made the unexpected finding that miRNA378/378* specifically increases transcriptional activity of C/EBPα and C/EBPβ on adipocyte gene promoters.
Keywords: adipogenesis, PPARγ coactivator-1β, micro-RNA
it has been estimated that miRNAs might regulate expression of one-third of human genes. Posttranscriptional RNA silencing is a conserved regulatory mechanism present in almost all eukaryotic organisms. More specifically, the micro-RNA (miRNA) pathway regulates gene expression by inducing degradation and/or translational repression of target mRNAs. Most animal miRNAs are partially complementary to their targets and mediate their silencing effects via translational repression. miRNAs are transcribed as primary transcripts (pri-miRNAs) that are afterward processed within the nucleus into pre-miRNAs by complexes containing the core RNAse III enzyme Drosha. Those pre-miRNAs are exported to the cytoplasm and cleaved by Dicer to produce miRNA/miRNA* duplexes. miRNAs associate with Argonaute (Ago) proteins to form the core effector complex known as RISC (for RNA-induced silencing complex). This complex is capable of recognizing mRNAs and inhibiting protein translation. In 2006, Schmitter and colleagues analyzed HEK293 cell lines depleted of Dicer or individual Ago proteins (20). Their results indicated that Ago2 was the most important Ago protein acting in the miRNA pathway in HEK293 cells and that knocking down Ago2 had a similar effect to that of Dicer. More recently, Su et al. demonstrated that mammalian Agos all contribute to miRNA silencing, and individual Agos have overlapping functions in this process (22). In addition to the role of Ago2 in the action of miRNAs, Diederichs and colleagues have shown that Ago2 also plays an important role in the processing of the mature form of several miRNAs (3).
A number of miRNAs have been reported to be expressed and regulated during adipocyte differentiation. Esau et al. (5) were the very first ones to show that miRNA-143 regulated adipocyte differentiation. More recently, Xie et al. (26) showed that miRNA-103 and miRNA-143 are induced during adipogenesis and accelerate fat cell development. Oskowitz and colleagues analyzed miRNA expression during human multipotent stromal cells differentiation (18). They identified 19 miRNAs that were upregulated during osteogenesis and 20 additional miRNAs induced during adipogenesis. Overexpression of miRNA-27 inhibits adipocyte formation by blocking expression of peroxisome proliferator-activated receptor (PPAR)γ and C/EBPα, without affecting myogenic differentiation (16). miRNA let-7 (24) also plays a role in adipogenesis. Expression of several others have been described as expressed and regulated in the adipogenic differentiation of adipose-derived stem cells (25) or in human omental and subcutaneous adipose tissue (12).
MATERIALS AND METHODS
Cell culture.
Maintenance and adipogenesis of 3T3-L1 preadipocytes were as described previously using methylisobutylxanthine, dexamethasone, and insulin (MDI) (7). For adipogenesis, cells that had been confluent for 2 days (day 0) were treated with 10% fetal calf serum (FCS), 1 μM dexamethasone, 0.5 mM methylisobutylxanthine, 1 μg/ml insulin, and 5 μM troglitazone. On day 2, cells were fed with 1 μg/ml insulin in 10% FCS media, and on day 4 and every 2 days thereafter, cells were refed with 10% FCS. Lipid accumulation in adipocytes was visualized by staining with Oil Red-O (4). Marrow-derived ST2 cells were incubated at 37°C and 5% CO2 in α-MEM supplemented with 10% FCS (Atlanta Biologicals, Lawrenceville, GA).
Plasmids and transfections.
A genomic fragment of 2.6 kb and encompassing miRNA378/378* was amplified with the primers 5′-gcctggagtcgtgtccatatc-3′ and 5′-ctggcaggaaggcctactaag-3′ with PfuTurboHotstart polymerase (Stratagene, La Jolla, CA), and subsequently subcloned into pMSCV PURO. Plasmids expressing wild-type C/EBPα and C/EBPβ were described previously (4). The promoter-luciferase reporter construct for GLUT4 was provided by Sven Enerbäck (Göteborg University) (8).
Retroviral transduction of cells.
293T cells (10-cm plates) were transfected by calcium phosphate coprecipitation with the viral packaging vectors SVε-E-MLV-env and SVΨ-E-MLV in addition to retroviral vectors as indicated in the figure legends (7.5 μg of each). Virus-containing medium was collected 16 h after transfection and passed through a 0.45-μm syringe filter. Polybrene (hexadimethrine bromide; Sigma) was added to a final concentration of 8 μg/ml. This medium was then applied to subconfluent (30–50%) cells in 10-cm plates. The infection protocol was repeated every 8–16 h until cells were 80% confluent. Cells were then trypsin-treated and replated in DMEM supplemented with 10% FCS and 2 μg/ml puromycin (Sigma) for pSUPERIOR/pMSCV-based vectors.
Transient transfection and luciferase assay.
NIH-3T3 cells were transfected using Fugene 6 (Roche, Basel, Switzerland). Cells were transfected with the indicated amount of luciferase reporter gene, 50 ng of pRL-SV40 Renilla (Promega, Madison WI), and the indicated amounts of expression plasmid in 6-well plates. To correct for variance in transfection efficiency, luciferase values were normalized against relative light units from Renilla activity.
Stable knock-down of Ago2 and Dicer in 3T3-L1 cells.
Twenty-one nucleotide short hairpin RNA loops were used to knock down Ago2 mRNA and Dicer mRNA. The sequences were as reported by Schmitter et al. (20): shAgo2: forward, 5′-GATCCCGCAGGACAAAGATGTATTATTCAAGAGATAATACATCTTTGTCCTGCTTTTTGGAAA-3′ and reverse 5′-AGCTTTTCCAAAAAGCAGGACAAAGATGTATATCTCTTGAAT AATACATCTTT GTCCTGCGG-3′; shDicer: forward 5′-GATCCCATTGGCTTCCTCCTGGTTATGTTCAAGAGACATAACCAGGAGGAAGCCAATTTTTGGAAA-3′ and reverse 5′-AGCTTT TCCAAAAAATTGGCTTCCTCCTGGTTATGTCTCTTGAACATAACCAGGAGGAAGCCAATGG-3′. The forward and reverse oligo strands were annealed and cloned into the pSUPERIOR.retro.puro vector (OligoEngine, Seattle, WA), which had been linearized with BglII and HindIII.
Transient transfections of antagomirs in 3T3-L1 cells.
Control antagomirs 378, 378*, and 132 (Applied Biosystems/Ambion, Austin, TX) at a concentration of 50 nM were added to adipocyte differentiation medium at day 3. Medium was changed at day 4 as usual. Cells were harvested or used for metabolic assays at day 7.
Quantitative RT-PCR.
One microgram of total RNA was transcribed to cDNA using the TaqMan system (Applied Biosystems, Foster City, CA). Quantitative RT-PCR was performed according to the manufacturer's protocol. SYBR Green I was used to monitor amplification of DNA on MyiQ quantitative PCR detection system (Bio-Rad, Hercules, CA). After amplification, melting curve analysis was performed as described by the manufacturer. Gene expression was normalized to 18S, cyclophilin, or TATA-box binding protein RNAs, depending on the relative abundance of mRNA. Oligonucleotide primers for amplification of 18S (10), cyclophilin (10), C/EBPα (10), PPARγ (10), and TATA-box binding protein (21) have been reported. Primers for the other genes were designed using PRIMER EXPRESS software (Applied Biosystems, Foster City, CA) and validated for quantitative RT-PCR. Sequences are available on request.
Lipid synthesis and extraction.
Cellular lipids were extracted essentially by the Folch method (6). Briefly, cells were incubated for 2 h at 37°C in the presence of [14C]acetic acid or [14C]glucose, washed once in cold PBS, and then lysed in 0.5 ml of ethanol. One milliliter of chloroform was added and mixed by vortexing. After addition of 0.5 ml of HCl (0.1 N), lysates were mixed by gentle inversion. Tubes were centrifuged at 500 g for 20 min. The upper phase and interface were discarded, and the organic phase was washed twice with 0.5 ml of water. Extracts were dried under N2, and the pellet was resuspended in the appropriate volume of chloroform-methanol (2:1). Extracts were separated by thin-layer chromatography with diethylether-hexane-glacial acetic acid (35:65:1, vol/vol/vol) as carrier solution on silica gel plates and exposed to film. Phospholipids and triacylglycerol were identified with standards.
β-Oxidation assay-mitochondrial β-oxidation of [9,10(n)3H]-palmitic acid (GE Healthcare Life Sciences, Piscataway, NJ) in 3T3-L1 adipocytes was assayed by the degree of incorporation of 3H into H2O, as described by Keller et al. (11).
Western blots.
Immunoblots were performed with antibodies specific for C/EBPβ, C/EBPα, PPARγ (Santa Cruz Biotechnology), and FABP4 (Cell Signaling). Bound horseradish peroxidase-coupled secondary antibody was visualized with Pierce Super Signal or Super Signal Ultra enhanced chemiluminescence substrates (Thermo Fisher Scientific, Rockford IL).
RNA purification and microarray analyses.
Total RNA was isolated from 3T3-L1 cells and ST2 stromal vascular cells with RNA Stat60 (Tel-Test B). The fraction containing miRNAs was further purified on a gel according to Ambion's protocol. The Ambion miRNA probe set was spotted in triplicate on Nexterion E slides and subsequently hybridized to enriched small RNA fraction labeled by Cy3 and Cy5 as recommended by the manufacturer. The arrays were scanned with a Genepix 4000 microarray scanner (Molecular Devices, Sunnyvale, CA). Expression profiling was performed using Affymetrix MOE430 chip set. Preparation of cRNA, hybridization, and scanning were performed as described previously (1).
Northern blots.
Polyacrylamide-TBE-Urea gel (15%; Invitrogen) was run in TBE 1× (Invitrogen). RNA was mixed with equal volume of denaturing gel loading buffer (95% formamide, 0.025% xylene cyanol, 0.025% bromophenol blue, 0.5 mM EDTA, 0.025% SDS) and denatured for 5 min at 95°C. Gel was run until the bromophenol blue migrated 4–5 cm. Gel was then transferred onto a Sequi-Gene GT membrane (Bio-Rad) and cross-linked using a Stratalinker (Stratagene, La Jolla, CA). Probes were labeled using 50 μCi [γ-32P]ATP (MP Biomedicals, Solon, OH) and then purified on Quick Spin Sephadex G25 columns (Roche). Sequences for miRNA378, 378*, 199b, 103, and 21 probes are respectively the following: 5′-ggccttctgactccaagtccag-3′, 5′-acacaggacctggagtcaggag-3′, 5′-gaacagatagtctaaacactggg-3′, 5′-tcatagccctgtacaatgctgct-3′, and 5′-tcaacatcagtctgataagcta-3′. Membrane was prehybridized in rapid hybridization buffer (GE Healthcare Life Sciences, Piscataway, NJ) at 42°C. After denaturing the probe, the membrane was incubated overnight at 42°C in hybridization buffer and then washed three times for 7 min at 32°C in SSC 2×, SDS 0.1%. Quantification of Northern blots was performed by phosphorimaging using Quantity One Software (Bio-Rad).
Triacylglycerol measurements.
The amount of cellular triacylglycerol was determined with Infinity triglyceride reagent (Sigma-Aldrich, St. Louis, MO) with glycerol as the standard.
RESULTS
Ago2 is required for efficient synthesis of triacylglycerols.
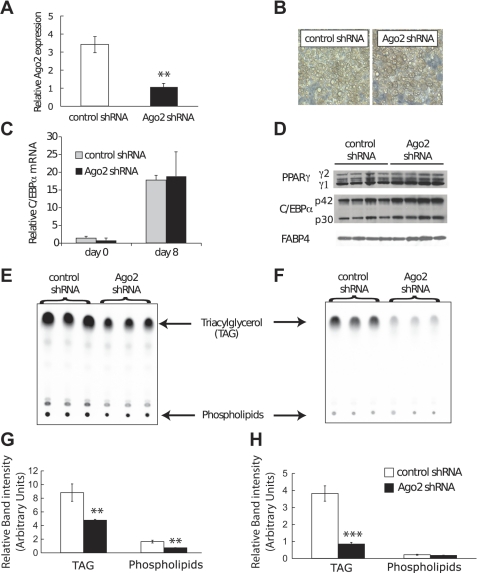
Ago2 plays a key role in the processing and stability of miRNAs, as well as action of endogenous siRNAs; therefore, to investigate potential roles of miRNAs on aspects of adipocyte biology, we evaluated effects of Ago2 deficiency on adipocyte differentiation and metabolism (3). We stably knocked down expression of Ago2 in 3T3-L1 preadipocytes using a retroviral shRNA expression vector (shAgo2) (20). Ago2 mRNA was reduced by ∼72% in Ago2 knock-down adipocytes at day 7 of differentiation (Fig. 1A). By phase-contrast microscopy, the rate and extent of adipogenesis did not appear to be different. Similarly, adipocyte morphology including size and number of lipid droplets appear similar (Fig. 1B). To confirm and extend these observations, we quantified expression of several adipocyte genes and found that C/EBPα mRNA levels are similar between control and shAgo2 3T3-L1 preadipocytes and adipocytes at day 8 (Fig. 1C). However, Western blot analysis revealed a slight but significant increase in expression of PPARγ and C/EBPα proteins in adipocytes with an Ago2 deficiency, although differences in FABP4 were not observed (Fig. 1D). Taken together, these data suggest that differentiation of adipocytes is not substantially influenced by knockdown of Ago2.
Fig. 1.
Ago2 is required for efficient incorporation of [14C]glucose into triacylglycerol. A: knockdown of Ago2 in 3T3-L1 adipocytes. After retroviral transduction with shRNAs, Ago2 expression levels in day 7 3T3-L1 adipocytes were measured by quantitative RT-PCR, and are shown relative to cyclophilin. Expression is means ± SD. B: Ago2 deficiency does not alter morphology in 3T3-L1 adipocytes. Phase contrast pictures shown were taken 11 days after induction of adipocyte differentiation. C and D: knockdown of Ago2 does not change C/EBPα, PPARγ, and FABP4 expression in 3T3-L1 adipocytes. C: C/EBPα mRNA expression is shown relative to cyclophilin as means ± SD. D: at day 8, cells were lysed, and expression of C/EBPα, PPARγ, and FABP4 proteins were analyzed by immunoblot analysis. E and F: Ago2 is required for efficient incorporation of [14C]acetate and [14C]glucose into triacylglycerol. E: day 11 adipocytes were incubated in presence of [14C]acetic acid for 1 h. Cells were washed once in PBS, and total cellular lipids were extracted by a mixture of methanol and chloroform (1:2), followed by separation by thin layer chromatography. F: day 11 adipocytes were starved for 3 h in PBS. After incubation with 2 μCi [14C]glucose for 2.5 h, cells were harvested and analyzed by thin-layer chromatography. G and H: quantification of indicated spots. Counts are shown as means ± SD in arbitrary units. Significant difference: * P < 0.05; ** P < 0.01.
To assess a potential role of Ago2 in lipid metabolism, we examined effects of Ago2 knock-down on lipogenesis. After metabolic labeling with [14C]acetate for 45 min or with [14C]glucose for 2 h, lipids were extracted and separated by thin-layer chromatography (Fig. 1, E and F, respectively). Knock-down of Ago2 resulted in a significant reduction in triacylglycerol and phospholipids newly synthesized from radiolabeled acetate (Fig. 1G). When incubated in presence of radiolabeled glucose, we also saw a significant reduction in newly synthesized triacylglycerol but not in phospholipids (Fig. 1H). These results suggest that impairing biosynthesis of miRNAs and action of miRNAs negatively influences adipocyte lipid production.
Microarray analysis of miRNAs in preadipocytes and adipocytes.
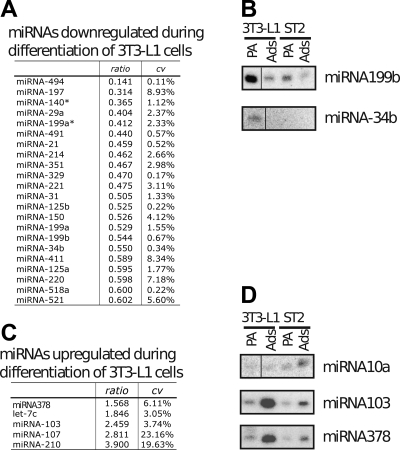
Given our results showing an impairment in adipocyte lipid synthesis following alterations in global miRNA processing, we next sought to identify specific miRNAs that modulate adipocyte function. To screen for miRNAs that were differentially regulated during adipocyte differentiation, we analyzed two different experimental systems: the 3T3-L1 preadipocyte line and the ST2 mesenchymal precursor line. Both cell lines can be efficiently induced to undergo adipocyte differentiation. The Ambion miRNA probe set was spotted on Nexterion glass slides and hybridized with small RNA fractions isolated from 3T3-L1 and ST2 preadipocytes and differentiated adipocytes. MiRNAs whose expression decreases during the transition between 3T3-L1 preadipocytes and adipocytes are ranked in Fig. 2A. By Northern blot, we confirmed that miRNA-199b (Fig. 2B), miRNA-197 (data not shown), and miRNA-34b (Fig. 2B) are downregulated during adipocyte differentiation. In contrast, miRNAs induced during adipogenesis were not as numerous. The most upregulated miRNAs were miRNA-378/378*, let-7c, miRNA-103, miRNA-107, and miRNA-210 (Fig. 2C). We confirmed by Northern blots using preadipocyte and adipocyte RNAs from two different cell lines (3T3-L1 and ST2) that miRNA-378/378*, miRNA-10a, miRNA-103, and miRNA-107 are induced during adipogenesis (Fig. 2D).
Fig. 2.
Regulated expression of micro-RNAs (miRNAs) during adipocyte differentiation. A: downregulated miRNAs during 3T3-L1 cell differentiation. The table shows the ratio of the level of expression in adipocytes vs. preadipocytes, as well as the coefficient of variation for two independent hybridizations with dye-swap. B: Northern blot analysis of preadipocytes (PA) and adipocytes (Ads) derived from 3T3-L1 and ST2 mesenchymal precursor cells for miRNA199b and miRNA34b. C: upregulated miRNAs during 3T3-L1 cell differentiation. Data are presented as in A. D: Northern blot analysis of preadipocytes (PA) and adipocytes (Ads) derived from 3T3-L1 and ST2 mesenchymal precursor cells for miRNA10a, miRNA103, and miRNA378.
To establish whether some of these miRNAs might play a role in adipocyte differentiation, we generated retroviral vectors that contain an ∼500-bp genomic region encompassing the indicated miRNAs. In one instance, inhibition of proliferation by miRNA34bc overexpression hampered its analysis during adipogenesis (1). Morphological changes such as increased lipid droplet size during adipocyte differentiation were only observed on overexpression of miRNA 378/378*. We therefore decided to focus our further analysis on these miRNAs.
Induction of miRNA378/378* during adipogenesis.
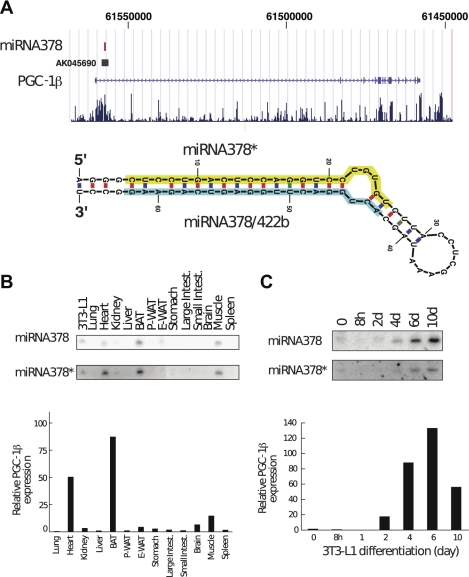
Among the miRNAs identified as regulated during preadipocyte differentiation, miRNA378/378* was of particular interest due to its peculiar genomic localization, since these miRNAs are localized in the first intron of PGC-1β (Fig. 3A, indicated by the filled square) and are highly conserved between species. Hence, we started by analyzing the abundance of miRNA378 and miRNA378* in different mouse tissues (Fig. 3B) by Northern blot. In parallel, we measured the levels of PGC-1β mRNA in the same tissues by quantitative RT-PCR. Expression of the 378/378* miRNAs and PGC-1β were highly concordant and showed peak levels in brown adipose tissue, heart muscle, and skeletal muscle, respectively. Given the role of PGC-1β in mitochondrial biogenesis, it is notable that all these tissues are very rich in mitochondria. Lower levels of these miRNAs were found in other tissues, including white adipose tissue. We then investigated the expression of miRNA378/378* during 3T3-L1 adipocyte differentiation. Total RNA was harvested at the indicated times, and Northern blot analysis was performed for miRNA378 and miRNA378*. In parallel, quantitative RT-PCR was performed to determine expression of PGC-1β mRNA. As shown in Fig. 3C, we observed that expression of miRNA378/378* and PGC-1β are all induced during adipogenesis. Thus miRNA378/378*, which are localized in the first intron of PGC-1β, are regulated similarly to the PGC-1β mRNA itself.
Fig. 3.
miRNA378/378* is derived from an intron of the PGC-1β gene and is coexpressed with PGC-1β during adipocyte differentiation. A: schematic representation of the genomic localization of miRNA378/378*. miRNA378/378* (red) is located in the first intron of the PGC-1β gene. miRNA378* is derived from the 5′ half and miRNA378 (formerly named miRNA422b) is derived from the 3′ half of the precursor hairpin. B: tissue distribution of miRNA378/378* and PGC-1β. Expression of miRNA378/422b and miRNA378* was analyzed by Northern blot of total RNA of the indicated tissues. PGC-1β mRNA expression was measured by quantitative RT-PCR and is shown relative to the expression of cyclophilin. P-WAT, perirenal white adipose tissue; E-WAT, epididymal white adipose tissue. C: level of expression of miRNA378/378* and PGC-1β during adipocyte differentiation. RNA from 3T3-L1 cells was harvested at the indicated times, and level of expression of miRNA378/378* was measured by Northern blot. The PGC-1β mRNA levels were measured at the same times by quantitative RT-PCR.
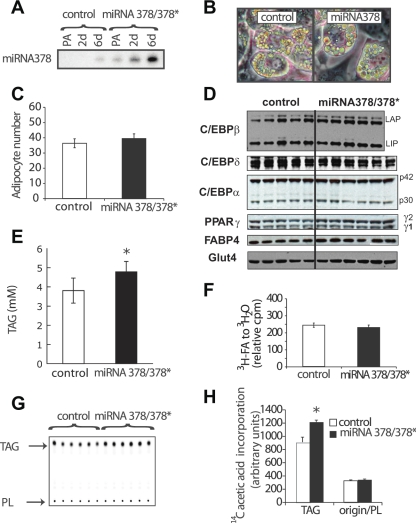
Expression of miRNA378/378* stimulates lipogenesis without effects on β-oxidation or adipogenesis. To investigate the roles of miRNA378/378* in adipocyte differentiation and/or metabolism, we ectopically expressed a longer precursor transcript that comprises the miRNA378/378* locus in ST2 mesenchymal precursors. We harvested total RNA at the indicated times and checked by Northern blot analysis the level of overexpression of miRNA378 during ST2 adipocyte differentiation. As shown in Fig. 4A, in control ST2 cells, expression of miRNA378 increases by approximately twofold between preadipocytes and day 6 adipocytes. In contrast, in ST2 cells infected with a miRNA378/378* retrovirus, the expression of miRNA378 in preadipocytes already surpasses the highest expression observed in control cells. With differentiation, expression increases a further 10-fold (Fig. 4A). Phenotypically, at day 3 after induction of adipocyte differentiation, lipid droplets are already well defined in ST2 cells overexpressing miRNA378/378*, whereas they are still budding in control cells (Fig. 4B). Adipogenesis is not influenced by enforced expression of miRNA378/378* as assessed by quantification of adipocyte number with phase-contrast microscopy (Fig. 4C). Western blot analyses for adipocyte markers revealed only marginal changes in the levels of expression of C/EBPβ, C/EBPδ, C/EBPα, PPARγ1, and FABP4; however, PPARγ2 and GLUT4 proteins show a slight but statistically significant increase in expression (Fig. 4D).
Fig. 4.
Overexpression of miRNA378/378* leads to increased lipid droplet size and lipogenesis. A: retroviral expression of miRNA378/378*. ST2 cells were transduced with a genomic fragment encompassing miRNA378/378* in the retroviral vector pMSCV-PURO (labeled as “miRNA378”) or with the empty vector (control). After selection of a polyclonal population, RNA was collected at confluence, as well as 2 and 6 days after induction of adipocyte differentiation. Northern blot analysis shows overexpression of miRNA378. B: phase contrast images of representative ST2 adipocytes are shown at day 3. Overexpression of miRNA378/378* increases the size of the lipid droplets. C: increased expression of miRNA378/378* in ST2 cells does not alter the number of adipocytes. Three days after induction of adipocyte differentiation, the number of adipocytes was counted in 30 fields at ×200 magnification for each cell line. Numbers represent means ± SE per field. D: overexpression of miRNA378/378* does not change C/EBPβ, C/EBPδ, C/EBPα, PPARγ, FABP4, and Glut4 expression in ST2 adipocytes. At day 3, cells were lysed, and expression of C/EBPβ, C/EBPδ, C/EBPα, PPARγ, FABP4, and Glut4 proteins was analyzed by immunoblot analysis. Each lane corresponds to a different well. E: triacylglycerol content in miRNA378/378* ST2 adipocytes is increased. Total amount was measured using the Infinity triglyceride reagent (Sigma) with glycerol as the standard in at least five different wells. F: β-oxidation is not affected by overexpression of miRNA378/378* in ST2 adipocytes. Cells were incubated in presence of [3H]palmitic acid (3H-FA) for 45 min. Media was loaded on Dowex AG1-X8 columns and [3H]H2O radioactivity was counted. G and H: [14C]acetic acid incorporation into triacylglycerol is increased by overexpression of miRNA378/378*. Day 3 ST2 cells were incubated in presence of [14C]acetic acid for 1 h. Cells were washed once in PBS, and total cellular lipids were extracted by a mixture of methanol and chloroform (1:2), followed by separation by thin-layer chromatography. G: the autoradiography with TAG for triacylglycerol and PL for phospholipids. H: a quantification of the indicated spots. Counts are shown as means ± SD in arbitrary units. Significant difference: *P < 0.05; **P < 0.01. These experiments are representative of at least three independent experiments.
To confirm our morphological observation that ectopic expression of miRNA378/378* increases lipid droplet size, we measured the total cellular content of triacyglycerols and found them elevated in miRNA378/378* adipocytes compared with controls (Fig. 4E). To assess potential roles for miRNA378/378* on lipid metabolism, we examined effects on β-oxidation and lipogenesis. On day 3 of differentiation, adipocytes were incubated for 2 h in presence of [3H]palmitate. Production of [3H]H2O was determined as an estimate of β-oxidation of fatty acids, and differences between control and miRNA378/378* cells were not observed (Fig. 4F). Another possibility for the cause of larger lipid droplets is increased lipogenesis. To test this possibility, day 3 adipocytes were metabolically labeled with [14C]acetate for 45 min, and lipids were extracted and separated by thin-layer chromatography (Fig. 4G). Whereas the phospholipid fraction (origin) was unchanged, we observed an ∼30% increase in triacyglycerol synthesis for the miRNA378/378* ST2 cells (Fig. 4H). Thus increased lipid droplet size in adipocytes with elevated expression of miRNA378/378* is due, at least in part, to increased lipogenesis.
Gene expression profiles in control and miRNA378/378* day 3 ST2 adipocytes.
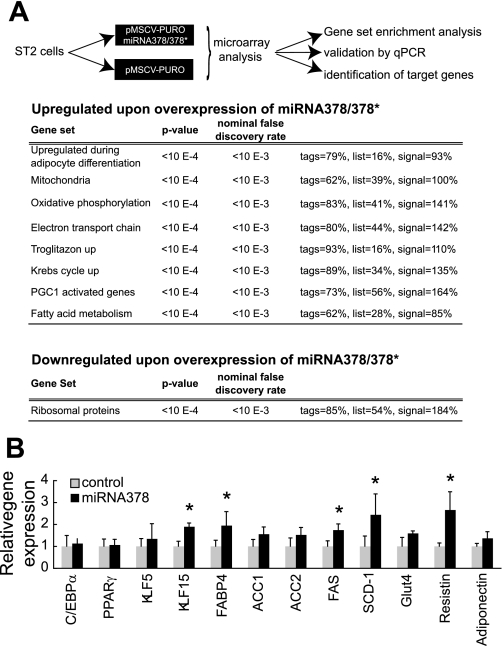
We used microarray analysis to better understand the effects of miRNA378/378* on global gene expression in ST2 cells. RNA was purified from control and miRNA378/378*-expressing ST2 cells at day 3 of adipocyte differentiation. The experimental design is illustrated in Fig. 5A. Using gene set enrichment analysis (GSEA), we profiled changes in gene expression that occur in response to overexpression of miRNA378/378* (17, 23). Eight sets of genes appeared to be preferentially upregulated by expression of miRNA378/378* (Fig. 5A). Among those eight sets of genes, three are related to adipocyte differentiation (“upregulated during adipocyte differentiation”, “troglitazone up”, and “fatty acid metabolism”). Interestingly, four additional sets were linked to mitochondria and their function like “mitochondria,” “oxidative phosphorylation,” “electron transport chain,” and “Krebs cycle up.” Finally, a “PGC1-activated genes” set was also upregulated on overexpression of miRNA378/378*. Only one group of genes was downregulated on overexpression of miRNA378/378*: “ribosomal proteins” (Fig. 5A). To validate whether predicted genes were indeed up- or downregulated on overexpression of miRNA378/378*, we performed quantitative RT-PCR on RNA samples that had been harvested at day 3 of differentiation. Figure 5B shows that several genes related to adipocyte differentiation and lipid synthesis are indeed upregulated, including KLF15, FABP4, FAS, SCD-1, and resistin.
Fig. 5.
Overexpression of miRNA378/378* induces fatty acid metabolism genes. A: affymetrix microarray and gene set enrichment analyses were performed on ST2 overexpressing miRNA378/378* and control cells at day 3 of differentiation. Selected gene sets enriched in upregulated and downregulated genes are shown. B: qualitated RT-PCR validation of selected genes shows increased expression of KLF15 as a potential mediator of the observed phenotype. *Significant difference (P < 0.05).
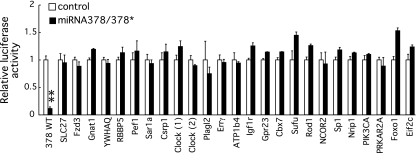
What are the targets of miRNA378/378* during adipogenesis? To investigate the potential mechanisms by which miRNA378/378* induces adipocyte gene expression and lipid accumulation, we amplified >20 3′-untranslated regions (UTRs) of target genes predicted either by TargetScan4.2 (15) or by Srivastava (unpublished data) and cloned them adjacent to luciferase to create a miRNA378/378* reporter construct. However, none of the predicted 3′UTRs were inhibited on overexpression of miRNA378/378* precursors (Fig. 6). To verify that translational repression by miRNAs can be assessed in our experimental setup, we chose as a positive control a 3′UTR that has been previously shown as a target for miRNA34 (1). As expected, we observed a strong downregulation of the Bcl2 3′UTR on overexpression of miRNA34 (data not shown).
Fig. 6.
Effects of miRNA378/378* overexpression on luciferase reporter constructs carrying 3′ UTR of predicted target genes. NIH-3T3 cells were transiently transfected with luciferase miRNA sensor genes containing the 3′ UTRs of a total of 24 predicted targets. Luciferase activity was normalized to a cotransfected SV40 promoter renilla luciferase construct. Control plasmid or miRNA378/378* retroviral plasmid was cotransfected as indicated. Error bars represent standard deviations (n = 3). The perfect reverse complement sequence of miRNA378 (378WT) was used as a positive control. Differences between control and miRNA378/378* were determined using Student's t-test. **Signifigant difference (P < 0.01).
Endogenous miRNA378/378* in lipid accumulation.
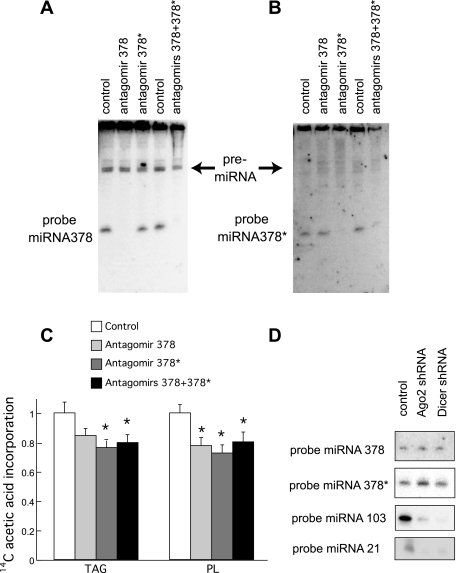
Because ST2 adipocytes have very low endogenous levels of miRNA378/378*, we assessed the consequences of antagonizing miRNA378/378* in day 7 3T3-L1 adipocytes. We used 3′ end-cholesterol-modified chemically engineered oligonucleotides [termed antagomirs (13)] to knock down miRNA378 and/or 378*. 3T3-L1 cells at day 3 of differentiation were treated with 50 nM of antagomirs 378, 378*, or both for 24 h, and RNA was harvested at day 7. Northern blot analysis shows that, in presence of antagomir 378 or both antagomirs, microRNA 378 is not detectable (Fig. 7A). The same is true for expression levels of miRNA378* when knocked down specifically with antagomir miRNA378* or both (Fig. 7B), suggesting that these antagomirs are useful tools for dissecting downstream effects of miRNA378/378*. Although antagomirs to miRNA378/378* did not cause an observable change to adipocyte morphology by day 7 of differentiation, metabolic labeling of day 7 adipocytes with [14C]acetic acid for 1 h revealed that synthesis of triacylglycerols is decreased by antagomir 378* or antagomirs 378 and 378* compared with a control antagomir (Fig. 7C) by 24 and 20%, respectively. In addition, a trend toward decreased TAG synthesis with antagomir 378 was observed. The amount of phospholipids synthesized was also reduced by antagomirs 378 or 378* alone or in combination. In presence of antagomir 132, no change was observed (data not shown).
Fig. 7.
Knock-down of miRNA 378/378* and knock-down of Dicer. A: 50 nM 3′ end-cholesterol-modified antisense oligonucleotides (called antagomirs) were added to 3T3-L1 cells at day 3 of differentiation for 24 h. RNA was harvested at day 7. Northern blot analysis of day 7 adipocytes transfected with control, antagomir 378, antagomir 378*, or both antagomirs, and probed for miRNA378. B: same as in A but probed for miRNA378*. C: day 7 3T3-L1 adipocytes transfected with the indicated antagomirs at day 3 were incubated in presence of [14C]acetic acid for 1 h. Cells were washed once in PBS, and total cellular lipids were extracted by a mixture of methanol and chloroform (1:2), followed by separation by thin-layer chromatography. Quantification of triacylglycerol and phospholipids is shown relative to the control. Data are the average of at least four experiments. *Significant difference (P < 0.05). D: 15 ug of RNA harvested from day 3 ST2 adipocytes overexpressing miRNA378/378*, from control 3T3-L1 day 7 adipocytes, from 3T3-L1 adipocytes where Ago2 or Dicer were knocked down were loaded on a gel for Northern blot analysis. Membrane was probed for miRNA378, miRNA378*, miRNA103, and miRNA21.
We also considered whether miRNA 378/378* might act through a mechanism independent of the classical miRNA machinery. In fact, the miRNA378/378* locus represents the head-to-head insertion of two common vertebrate genomic repeats, that form a very long, very stable, and perfectly complementary hairpin loop. Thus we evaluated expression of miRNA378 and miRNA378* in 3T3-L1 adipocytes where Ago2 or Dicer had been knocked down. As expected, miRNA103 and miRNA 21 levels are significantly reduced in cells with decreased expression of Ago2 or Dicer (Fig. 7D). Surprisingly, levels of miRNA378 or miRNA378* are unchanged when expression of Ago2 or Dicer is deficient (Fig. 7D), suggesting that a different processing mechanism is involved in the formation of these miRNAs. It should be noted that genetic inactivation of Dicer in other cellular systems does not completely abolish the generation of mature miRNAs (2). Similarly, Ago2 is not required for the generation of all miRNAs (3).
Transactivation of C/EBP transcription factors by miRNA378/378*.
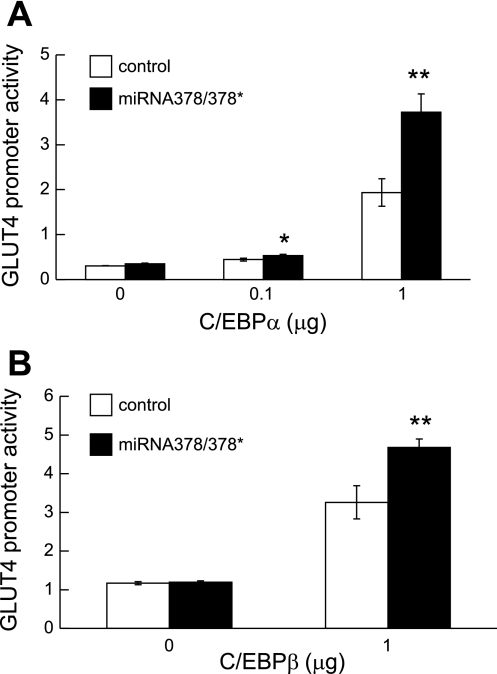
As part of our efforts to better understand the mechanism of miRNA378/378* action, we investigated other potential activities for these miRNAs. Interestingly, we observed that cotransfection of a miRNA378/378* expression vector increased transactivation of the GLUT4 promoter by C/EBPα and C/EBPβ (Fig. 8, A and B). Although expression of miRNA378/378* also increases transactivation of the GLUT4 promoter by C/EBPβ (Fig. 8B), coactivation properties appear specific to the C/EBPs since we did not observe interaction between miRNA378/378* and PPARγ on a PPRE reporter gene (data not shown). Also, no activation of the GLUT4 promoter by miRNA378/378* was observed in the absence of cotransfected C/EBP. These data suggest that effects of miRNA378/378* on lipid synthesis and adipocyte gene expression are mediated, at least in part, through transcriptional coactivation of C/EBP transcription factors.
Fig. 8.
Overexpression of miRNA378/378* regulates activation Glut4 promoter. 3T3-L1 cells were transfected with 500 ng luciferase reporter genes Glut4 promoters, along with the indicated amounts of expression vector for wild-type C/EBPα (A) or wild-type C/EBPα (B) and 1 μg of control or expression vector for miRNA378/378*. Luciferase activity was normalized to Renilla activity to correct for variations in transfection efficiency and is reported as units relative to the control values. Differences between control and miRNA378/378* were determined using Student's t-test. Significant difference: *P < 0.05; **P < 0.01.
DISCUSSION
There are a number of published reports asserting that miRNAs modulate adipogenesis (5, 12, 16, 18, 24–26). Several miRNAs have been reproducibly observed to be altered during adipogenesis in vitro and in vivo both in human and mouse systems (such as miRNA103, miRNA107, and miRNA378/378*). Although prior data have suggested that some of these miRNAs play a role in adipocyte differentiation, our data suggest that miRNAs are in addition likely to play a critical regulatory role in adipocyte metabolism. For example, knocking down Ago2 leads to slight increases in adipocyte gene expression but greatly impairs conversion of glucose or acetate to triacylglyerol (Fig. 1). In addition, among several miRNAs that are increased during adipocyte differentiation, we provide evidence that miRNA378/378* may play a regulatory role in lipid metabolism. Located in the first intron of PGC-1β, miRNA378/378* are coordinately expressed during adipogenesis and in the same tissues as PGC-1β (Fig. 3, B and C). Coordinate regulation of expression between an intronic miRNA and the parent gene has been observed previously for miRNA107 and pantothenate kinase, a key regulatory enzyme in the CoA biosynthetic pathway (26). We show that overexpression of miRNA378/378* during adipogenesis increases triacylglycerol (Fig. 4E) accumulation due to increased de novo lipogenesis (Fig. 4H). Adipogenesis per se did not appear to be influenced by miRNA378/378*; however, increased expression of PPARγ2 and GLUT4 was observed (Fig. 4, B–D).
We introduced point mutations into miRNA 378 or 378* that in theory should have allowed us to express functional 378 and 378* miRNAs singly. However, despite our efforts, we were not able to distinguish whether effects on adipocyte gene expression or lipogenesis were solely due to overexpression of microRNA378 or microRNA378* because disruption of one miRNA influenced the expression and/or stability of the other (data not shown). Knock-down with antagomirs suggests though that both miRNAs make independent but complementary contributions to effects on lipid metabolism (Fig. 7C).
Gene profiling of RNA harvested from adipocytes that overexpressed microRNA378/378* showed that increased fatty acid synthesis could be in part due to elevated expression of fatty acid synthase, which was then confirmed by qRT-PCR (Fig. 5B). We also showed that microRNA378 and 378* could be knocked down in 3T3-L1 adipocytes (Fig. 7, A and B), which resulted in a reduction in triacylglycerol and phospholipids synthesis, at least in presence of antagomir 378* or antagomirs 378 and 378* (Fig. 7C). Interestingly, when Dicer was knocked down, we could still detect microRNAs 378 or 378*, whereas several other microRNAs, as expected, were essentially not detectable (Fig. 7D). In a traditional search for potential targets for miRNA378 or miRNA378*, we observed that none of the 24 predicted 3′UTRs tested was downregulated in response to miRNA378 or miRNA378* (Fig. 6). Surprisingly, some of the suggested target genes showed an increase in reporter gene expression. Although this observation is consistent with an indirect effect on the transcriptional or translational efficiency of the reporter constructs, it is worthwhile to note that Kahai and colleagues similarly observed an increase in the activation of the predicted miRNA378* target gene nephronectin (9). Therefore, we considered whether these miRNAs might exert their effects in adipocytes through an atypical mechanism, such as transcriptional coactivators. We observed that, in the presence of microRNA378/378*, C/EBPα and C/EBPβ activity on the GLUT4 promoter was increased (Fig. 8). Although the mechanism might be through translational repression of a corepressor, it could also be that the pre- or mature miRNAs directly bind C/EBPs or their transcriptional coregulators to influence transcriptional activity (see supplemental materials available online at the Am J Physiol Endocrinol Metab website). RNAs have been demonstrated to serve as transcriptional coactivators (14, 19), and this possibility is also consistent with our inability to detect a classical target for these miRNAs among the predicted targets tested.
GRANTS
This work was supported by National Institute of Diabetes and Digestive and Kidney Diseases Grant DK-51563 to O. A. MacDougald, by the Belgian Fonds National de la Recherche Scientifique and a “Mandat de retour” from the Politique scientifique fédérale belge to I. Gerin, by the Région Bruxelles-Capitale (IRSIB BB2B 2008-1-01) to G. T. Bommer, and National Institute of Dental and Craniofacial Research Grant DE-007057-33 to K. M. Sousa. Additional support was provided by the Michigan Metabolomics and Obesity Center.
DISCLOSURES
No conflicts of interest, financial or otherwise, are declared by the author(s).
Supplementary Material
REFERENCES
- 1.Bommer GT, Gerin I, Feng Y, Kaczorowski AJ, Kuick R, Love RE, Zhai Y, Giordano TJ, Qin ZS, Moore BB, MacDougald OA, Cho KR, Fearon ER. p53-Mediated activation of miRNA34 candidate tumor-suppressor genes. Curr Biol 17: 1298–1307, 2007 [DOI] [PubMed] [Google Scholar]
- 2.Cummins JM, He Y, Leary RJ, Pagliarini R, Diaz LA, Jr, Sjoblom T, Barad O, Bentwich Z, Szafranska AE, Labourier E, Raymond CK, Roberts BS, Juhl H, Kinzler KW, Vogelstein B, Velculescu VE. The colorectal microRNAome. Proc Natl Acad Sci USA 103: 3687–3692, 2006 [DOI] [PMC free article] [PubMed] [Google Scholar]
- 3.Diederichs S, Haber DA. Dual role for argonautes in microRNA processing and posttranscriptional regulation of microRNA expression. Cell 131: 1097–1108, 2007 [DOI] [PubMed] [Google Scholar]
- 4.Erickson RL, Hemati N, Ross SE, MacDougald OA. p300 Coactivates the adipogenic transcription factor CCAAT/enhancer-binding protein alpha. J Biol Chem 276: 16348–16355, 2001 [DOI] [PubMed] [Google Scholar]
- 5.Esau C, Kang X, Peralta E, Hanson E, Marcusson EG, Ravichandran LV, Sun Y, Koo S, Perera RJ, Jain R, Dean NM, Freier SM, Bennett CF, Lollo B, Griffey R. MicroRNA-143 regulates adipocyte differentiation. J Biol Chem 279: 52361–52365, 2004 [DOI] [PubMed] [Google Scholar]
- 6.Folch J, Lees M, Sloane Stanley GH. A simple method for the isolation and purification of total lipides from animal tissues. J Biol Chem 226: 497–509, 1957 [PubMed] [Google Scholar]
- 7.Hemati N, Ross SE, Erickson RL, Groblewski GE, MacDougald OA. Signaling pathways through which insulin regulates CCAAT/enhancer binding protein alpha (C/EBPalpha) phosphorylation and gene expression in 3T3-L1 adipocytes. Correlation with GLUT4 gene expression. J Biol Chem 272: 25913–25919, 1997 [DOI] [PubMed] [Google Scholar]
- 8.Hwang CS, Mandrup S, MacDougald OA, Geiman DE, Lane MD. Transcriptional activation of the mouse obese (ob) gene by CCAAT/enhancer binding protein alpha. Proc Natl Acad Sci USA 93: 873–877, 1996 [DOI] [PMC free article] [PubMed] [Google Scholar]
- 9.Kahai S, Lee SC, Lee DY, Yang J, Li M, Wang CH, Jiang Z, Zhang Y, Peng C, Yang BB. MicroRNA miR-378 regulates nephronectin expression modulating osteoblast differentiation by targeting GalNT-7. PLoS One 4: e7535, 2009 [DOI] [PMC free article] [PubMed] [Google Scholar]
- 10.Kang S, Bennett CN, Gerin I, Rapp LA, Hankenson KD, Macdougald OA. Wnt signaling stimulates osteoblastogenesis of mesenchymal precursors by suppressing CCAAT/enhancer-binding protein alpha and peroxisome proliferator-activated receptor gamma. J Biol Chem 282: 14515–14524, 2007 [DOI] [PubMed] [Google Scholar]
- 11.Keller P, Petrie JT, De Rose P, Gerin I, Wright WS, Chiang SH, Nielsen AR, Fischer CP, Pedersen BK, MacDougald OA. Fat-specific protein 27 regulates storage of triacylglycerol. J Biol Chem 283: 14355–14365, 2008 [DOI] [PMC free article] [PubMed] [Google Scholar]
- 12.Kloting N, Berthold S, Kovacs P, Schon MR, Fasshauer M, Ruschke K, Stumvoll M, Bluher M. MicroRNA expression in human omental and subcutaneous adipose tissue. PLoS One 4: e4699, 2009 [DOI] [PMC free article] [PubMed] [Google Scholar]
- 13.Krutzfeldt J, Rajewsky N, Braich R, Rajeev KG, Tuschl T, Manoharan M, Stoffel M. Silencing of microRNAs in vivo with ‘antagomirs’. Nature 438: 685–689, 2005 [DOI] [PubMed] [Google Scholar]
- 14.Lanz RB, McKenna NJ, Onate SA, Albrecht U, Wong J, Tsai SY, Tsai MJ, O'Malley BW. A steroid receptor coactivator, SRA, functions as an RNA and is present in an SRC-1 complex. Cell 97: 17–27, 1999 [DOI] [PubMed] [Google Scholar]
- 15.Lewis BP, Burge CB, Bartel DP. Conserved seed pairing, often flanked by adenosines, indicates that thousands of human genes are microRNA targets. Cell 120: 15–20, 2005 [DOI] [PubMed] [Google Scholar]
- 16.Lin Q, Gao Z, Alarcon RM, Ye J, Yun Z. A role of miR-27 in the regulation of adipogenesis. FEBS J 276: 2348–2358, 2009 [DOI] [PMC free article] [PubMed] [Google Scholar]
- 17.Mootha VK, Lindgren CM, Eriksson KF, Subramanian A, Sihag S, Lehar J, Puigserver P, Carlsson E, Ridderstrale M, Laurila E, Houstis N, Daly MJ, Patterson N, Mesirov JP, Golub TR, Tamayo P, Spiegelman B, Lander ES, Hirschhorn JN, Altshuler D, Groop LC. PGC-1alpha-responsive genes involved in oxidative phosphorylation are coordinately downregulated in human diabetes. Nat Genet 34: 267–273, 2003 [DOI] [PubMed] [Google Scholar]
- 18.Oskowitz AZ, Lu J, Penfornis P, Ylostalo J, McBride J, Flemington EK, Prockop DJ, Pochampally R. Human multipotent stromal cells from bone marrow and microRNA: regulation of differentiation and leukemia inhibitory factor expression. Proc Natl Acad Sci USA 105: 18372–18377, 2008 [DOI] [PMC free article] [PubMed] [Google Scholar]
- 19.Saha S, Ansari AZ, Jarrell KA, Ptashne M. RNA sequences that work as transcriptional activating regions. Nucleic Acids Res 31: 1565–1570, 2003 [DOI] [PMC free article] [PubMed] [Google Scholar]
- 20.Schmitter D, Filkowski J, Sewer A, Pillai RS, Oakeley EJ, Zavolan M, Svoboda P, Filipowicz W. Effects of Dicer and Argonaute down-regulation on mRNA levels in human HEK293 cells. Nucleic Acids Res 34: 4801–4815, 2006 [DOI] [PMC free article] [PubMed] [Google Scholar]
- 21.St-Pierre J, Drori S, Uldry M, Silvaggi JM, Rhee J, Jager S, Handschin C, Zheng K, Lin J, Yang W, Simon DK, Bachoo R, Spiegelman BM. Suppression of reactive oxygen species and neurodegeneration by the PGC-1 transcriptional coactivators. Cell 127: 397–408, 2006 [DOI] [PubMed] [Google Scholar]
- 22.Su H, Trombly MI, Chen J, Wang X. Essential and overlapping functions for mammalian Argonautes in microRNA silencing. Genes Dev 23: 304–317, 2009 [DOI] [PMC free article] [PubMed] [Google Scholar]
- 23.Subramanian A, Tamayo P, Mootha VK, Mukherjee S, Ebert BL, Gillette MA, Paulovich A, Pomeroy SL, Golub TR, Lander ES, Mesirov JP. Gene set enrichment analysis: a knowledge-based approach for interpreting genome-wide expression profiles. Proc Natl Acad Sci USA 102: 15545–15550, 2005 [DOI] [PMC free article] [PubMed] [Google Scholar]
- 24.Sun T, Fu M, Bookout AL, Kliewer SA, Mangelsdorf DJ. MicroRNA let-7 regulates-L1 adipogenesis. Mol Endocrinol 23: 925–931, 2009 [DOI] [PMC free article] [PubMed] [Google Scholar]
- 25.Tang YF, Zhang Y, Li XY, Li C, Tian W, Liu L. Expression of miR-31, miR-125b-5p and miR-326 in the adipogenic differentiation process of adipose-derived stem cells. OMICS 13: 331–336, 2009 [DOI] [PubMed] [Google Scholar]
- 26.Xie H, Lim B, Lodish HF. MicroRNAs induced during adipogenesis that accelerate fat cell development are downregulated in obesity. Diabetes 58: 1050–1057, 2009. [DOI] [PMC free article] [PubMed] [Google Scholar]
Associated Data
This section collects any data citations, data availability statements, or supplementary materials included in this article.


