Abstract
Studies in various types of cells find that, on average, each mitochondrion becomes involved in a fusion event every 15 min, depending on the cell type. As most contact events do not result in mitochondrial fusion, it is expected that properties of the individual mitochondrion determine the likelihood of a fusion event. However, apart from membrane potential, the properties that influence the likelihood of entering a fusion event are not known. Here, we tag and track individual mitochondria in H9c2, INS1, and primary β-cells and determine the biophysical properties that increase the likelihood of a fusion event. We found that the probability for fusion is independent of contact duration and organelle dimensions, but it is influenced by organelle motility. Furthermore, the history of a previous fusion event of the individual mitochondrion influenced both the likelihood for a subsequent fusion event, as well as the site on the mitochondrion at which the fusion occurred. These observations unravel the specific properties that distinguish mitochondria that will enter fusion events from the ones that will not. Altogether, these properties may help to elucidate the molecular mechanisms that regulate fusion at the level of the single mitochondrion.
Keywords: mitochondrial fusion and fisson, mitochondrial movement, H9c2 cells, photoactivatable green fluorescent protein
changes in the extra mitochondrial milieu such as fuel type (14, 55), energy balance (19), and redox potential (3, 55), as well as balance between the expression level of pro-fusion and pro-fission proteins (13, 17, 21, 24, 44, 48) were shown to determine mitochondrial morphology. In contrast to these global regulators that affect the entire mitochondrial network, little is known about the parameters that determine the likelihood of a fusion event at the level of the individual mitochondrion. Indeed, most measurements of mitochondrial fusion determined the average cellular spread of matrix-targeted photoactivatable green fluorescent protein (GFP) (mtPA-GFP) within the mitochondrial web and only rarely characterize spatial-, temporal and energetic properties of single fusion events. So far, the only information gathered in studies of single fusion events is that juxtaposed mitochondria are not necessarily fused (50), that most intermitochondrial encounters do not result in fusion (2), and that the mitochondrion must show a certain value of mitochondrial membrane potential (51) for fusion to occur, findings that are indicative for selectivity of the fusion machinery.
Since fusion events do not occur synchronously in all mitochondria within the cell, we hypothesize that either local or intrinsic factors influence the likelihood of a fusion event. As fusion has been shown to be a selective event that exclude some mitochondria, allowing their elimination by autophagy, such factors may constitute relevant selection criteria and may be important in mitochondrial quality control (10, 52). These factors may include organelle size, orientation between engaging mitochondria, duration of contact between individual organelles, motility, and previous fusion history.
The goal of this study is to characterize the spatial, temporal, and energetic properties that influence the probability of fusion at the level of the individual mitochondrion. For this purpose, mtPA-GFP was used to allow tagging and tracking of individual mitochondria in H9c2, INS1, and primary β-cells. It was found that the matching of fusing mitochondria is largely independent of length, spatial orientation, and the hyperpolarizing range of mitochondrial membrane potential. In addition, the probability for a fusion event is independent of contact duration, but, importantly, it is influenced by organelle motility and preceding fusion history of the organelle. In all, the identification of parameters that determine the probability of fusion events provides insights into mechanisms for controlling fusion selectivity.
MATERIALS AND METHODS
Islet isolation, primary β-cells, and cell lines culture.
Twelve-week-old male C57BL6 mice fed a normal diet were maintained under controlled conditions (a constant temperature of 19–22°C and a 14:10-h light-dark cycle) until death by CO2 asphyxiation. Islets of Langerhans were isolated as previously described (52), and the islet cells were dispersed by treatment with Ca2+/Mg2+-free PBS supplemented with 0.05 mg/ml trypsin (GIBCO, Grand Island, NY) with occasional agitation. Dispersed cells were plated on poly-d-lysine-coated glass slide-bottom dishes (MatTek, Ashland, MA) in RPMI-1640 culture media (GIBCO) supplemented with 10 mmol/l glucose, 10% FCS (HyClone, South Logan, UT), 100 IU/ml penicillin (GIBCO), and 100 μg/ml streptomycin (GIBCO). Experiments were performed on individual cells not in contact with other cells after culture for 2–3 days at 37°C in a humidified atmosphere containing 5% CO2. All procedures were performed in accordance with the Boston University Institutional Guidelines for Animal Care (IACUC no. 1104) in compliance with United States Public Health Service Regulation. INS1 832/13 cells were cultured in RPMI media supplemented with 10% FBS, 10 mM HEPES buffer, 1 mM pyruvate, 50 μM 2-β-mercaptoethanol, 50 U/ml penicillin, 50 μg/ml streptomycin, and 11 mM glucose. H9c2 cells (obtained from ATCC) were cultured in Dulbecco's modified essential medium (DMEM no. 30-2002) supplemented with 10% fetal bovine serum, 2 mm glutamine, 100 U/ml penicillin, 100 μg/ml streptomycin, and 1 mm pyruvate in humidified air (CO2 5%) at 37°C as described previously (46). Thirty minutes before experiment and during measurement, the cells were kept at 10 mM glucose.
Chemical, DNA plasmids, and constructs.
mtPA-GFP was generated as described previously (50). Delivery to INS1 and primary β-cells was preformed by lentiviral and adenoviral infection, respectively, as described in detail previously (34, 49, 52). Tetramethylrhodamine-ethyl-ester-perchlorate (TMRE; Molecular Probes, Eugene, OR) was used at concentrations of 7 nM with a preimaging incubation period of 1.5 h. TMRE was kept in the medium throughout the experiments. H9c2 cells were transfected with mtPA-GFP and mtDsRed (Clontech) in suspension by electroporation. Adherent cells from confluent flasks were detached, centrifuged, and resuspended in medium to 2–3 × 10⁶ cells per 250-μl volume for each transfection and combined with 10 μg DNA of mtPAGFP and 4 μg DNA of mtDsRed. For imaging experiments, cells were plated to poly-d-lysine-coated glass coverslips.
Confocal and 2P microscopy.
Experiments were performed on live INS1 and primary β cells using a Zeiss LSM 510 Meta microscope (Carl Zeiss, Oberkochen, Germany) with a ×100 oil immersion objective. TMRE was excited with a 543-nm helium-neon laser and emission recorded through a bandpass 650- to 710-nm filter. GFP was excited by using a 488-nm argon laser, and emission was recorded through a bandpass 500- to 550-nm filter. During the experiments, cells were kept at 37°C in a humidified atmosphere containing 5% CO2. A transition of mtPA-GFP to its active (fluorescent) form was achieved by photoisomerization by using a 2-photon laser (750 nm) to give a 375-nm photon equivalence at the focal plane. This allowed for selective activation of regions <0.5 μm2. For H9c2 cells, all measurements were performed by using a Bio-Rad Radiance 2001 system fitted to an Olympus IX70 microscope with a ×40 oil immersion objective (UApo340, numerical aperature 1.35) and recording 512 × 512 pixel image pairs in every 0.25 s−1. The HeCd laser (442 nm) was used for photoactivation of mtPA-GFP. The dual-line Kr/Ar ion laser source was used for imaging of GFP at 488 nm excitation and mtDsRed at 568 nm. Imaging measurements were performed in an extracellular medium containing 0.25% BSA at 35°C (54). PA-GFP was photoactivated by using the region of interest scanning option in the LaserSharp2000 software. Three 25-μm2 areas were chosen per cell and illuminated with maximum power at 442 nm excitation, respectively, for eight consecutive images to achieve irreversible photoactivation.
Tracking single mitochondria.
Tracking of single mitochondria in all cell types was conducted as described by us previously. In all experiments, excluding experiments measuring mitochondrial membrane potential (Δψm), sampling of the tracked mitochondrion was performed in a single plane every 4–10 s and lasted 7–20 min. Measurement of Δψm in individual mitochondria during fusion events was performed in INS1 and dispersed β-cells expressing mtPA-GFP and costained with TMRE (7 nM). In these experiments a z-stack series (5–10 sections) was applied on the vicinity of the tracked mitochondrion. TMRE fluorescence of the donor mitochondrion and acceptor mitochondrion in the z-stack series were separately measured. Δψm was derived using the Nernst equation,
where FITMRE_m denotes the maximal TMRE fluorescence intensity (FI) in the prefusion frame of the donor or acceptor mitochondria and FITMRE_avg denotes the average potential of the entire mitochondrial web in the prefusion frame. Δψm denotes the mitochondrial potential of a given mitochondrion relative to mitochondrial web average.
Movement analysis.
For H9c2 cells, all image analysis was done with custom-designed imaging software (Spectralyzer) (54). Mitochondrial movement before fusion was measured in the final 1 min before the onset of the transfer of mtPA-GFP from the donor mitochondrion to the acceptor. Only linear movement (displacement of organelle center, ≥0.4 μm) was used for the calculation of velocity. Mitochondria with <0.4 μm/min movement were considered as stationary regardless of their saltatory movement (displacement of organelle ends in the absence of relocation of organelle center). Experiments were carried out with ≥3 different cell preparations. Data are presented as means ± SE unless stated otherwise.
Control for phototoxicity and imaging artifacts.
Controls for dye- or laser-induced phototoxicity as well as imaging artifacts are described in detail elsewhere (49, 50, 52). The intensity of the laser was set to 25% of threshold intensity that elicited a drop (Δ ≥ 5%) in TMRE FI over a period of 45 min according to toxicity (50). Safety of the 2-photon laser of both Leica and LSM510 was determined in a similar fashion. mtPA-GFP related-toxicity was ruled out by showing no significant change (Δ ≥ 5%) in TMRE FI values for single nonphotoactivated, single photoactivated mitochondria, or cell average Δψm during 1 h (50). Image processing and analysis of single mitochondria was performed with Metamorph software (Molecular Devices). The analysis of mtPA-GFP-positive structures defining single mitochondria was preformed using “integrated morphometry analysis” function as described in detail elsewhere (49, 50, 52).
RESULTS
Prolonged intermitochondrial proximity does not increase chance for fusion events.
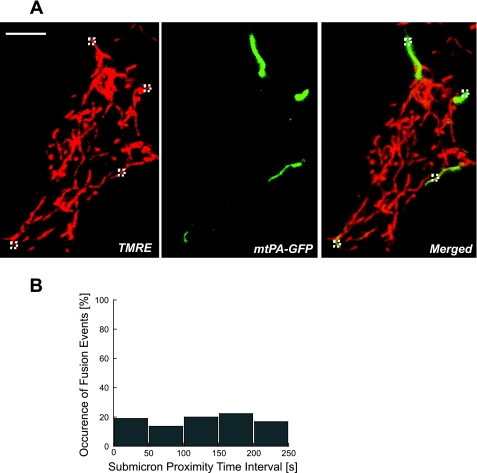
In both INS1 and primary β-cells discrete mitochondrial units are packed into a dense ramified mitochondrial mesh (34, 50). Figure 1A shows the mitochondrial web of an INS1 cell that was subjected to four sequential steps of photoactivation. It is evident that despite the mitochondrial proximity and density of web organization, the organelle size is small and they are not fused.
Fig. 1.
Differentiating between intermitochondrial contact and actual fusion. A: INS1 cell expressing matrix-targeted photoactivatable green fluorescent protein (GFP) (mtPA-GFP) that underwent 4 sequential photoactivation steps (each denoted with a small dashed square). Note the dense organization of discrete networks. B: individual mitochondria (n = 64) were tagged with PA-GFPmt and contacts (as judged from a submicron proximity; n = 170) and overt fusion events (n = 31) with neighbored nonphotoactivated mitochondria were classified according to the time duration interval. Note that the probability of intermitochondrial contact to develop to overt fusion is independent of the time interval.
Three separable steps for fusion have been described, namely, the first tethering or contact between mitochondria, outer membrane fusion, and inner membrane fusion (27, 31, 45). To test whether the duration of physical contact or tethering between neighboring units is associated with higher probability for the development of a fusion event, we counted 170 events (out of 52 different experiments) where the tagged mitochondrion was in physical contact with an adjacent mitochondrion for a time interval of 10–250 s (as judged from submicron proximity). We found that 18.9% (31 of 170) of these cases ultimately resulted in fusion events in INS1 cells. This value was independent of the duration of which the two mitochondria were found in submicron proximity (Fig. 1B). When the data were binned into intervals (0–50 s, 51–100 s, 101–150 s, 151–200 s, 201–250 s), a linear fit (R2 = 0.97) indicated a rise of only 0.4% for the chance for fusion for every additional 50 s of intermitochondrial contact. There was no significant change in the occurrence of fusion events between any pairs of bins (one-tailed Fisher's probability > 0.35). These findings suggest that except for proximity other local and intrinsic factors influenced the probability of fusion. The following assess the contribution of potential mechanisms as local regulators of mitochondrial fusion.
Location of fusion site and previous fusion history determines fusion probability.
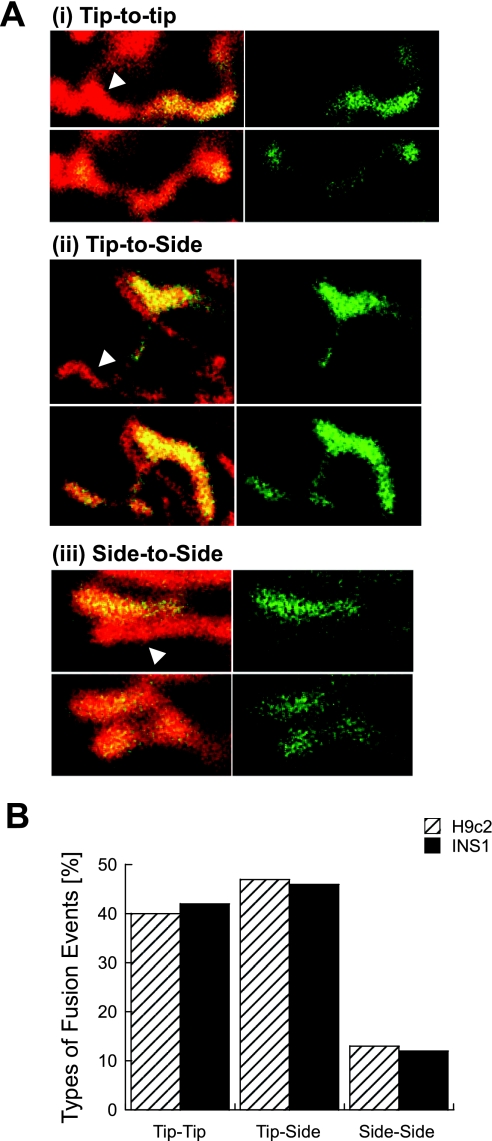
While previous studies localized mitofusin-2 to the tips of mitochondria (23), it is unknown to what extent mitochondrial fusion depends on the orientation between the engaging mitochondria. To determine whether orientation of two mitochondria may influence the likelihood of fusion, we tracked more than 200 fusion events in distinct cell types (Fig. 2A). Analysis included only mitochondria whose entire morphology and fusion site were clearly visualized [n(INS1) = 36 events, n(β cells) = 19 events, n(H9c2 cells) = 155 events]. Ball-shape mitochondria without clear tip-side boundaries were omitted from analysis. We found that fusion events can occur either tip-to-tip, side-to-tip, or side-to-side, being higher for a tip orientation in both INS1 and H9c2 cells (Fig. 2B).
Fig. 2.
Dependency of mitochondrial fusion upon orientation. A: example for the three orientations involving the tip and the side of the organelle. The acceptor mitochondrion is indicated with an arrow in the prefusion frame of each orientation are shown (top row of images in each panel). B: distribution of fusion orientation 155 events in H9c2 cells and 47 events in INS1 cells.
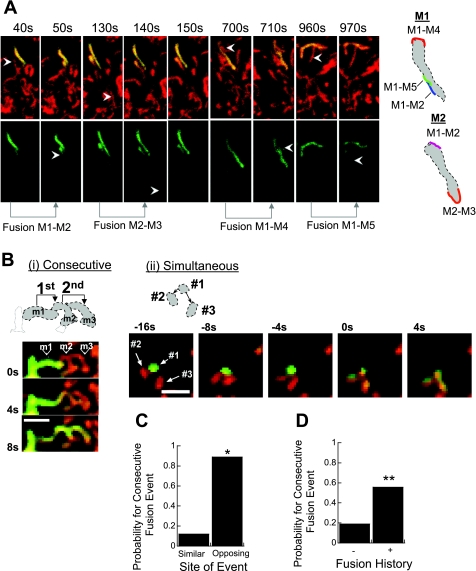
In 10 of 35 independent experiments, INS1 mitochondria underwent at least two successive fusion events within the same recording period. In 7 of the 10 experiments mentioned, the fusion sites could be accurately localized (n = 12 successive fusion events within the same recording period). Figure 3A shows a representative image for such experiments in INS1 cells. In 11 of the 12 successive events in INS1 mitochondria (92%) the fusion site was located in the opposite half of the mitochondrion (Fig. 3C) indicating a high probability for alternating sites for consecutive events (Fisher's two-tailed = 0.025). The time interval between successive fusion events was 168 ± 201 s (n = 12), spanning a range of 7–600 s and was always interrupted by a fission event from the previous fusion partner in INS1 cells. All cases where the fusion-to-fusion interval was <2 min (range 7–75 s) occurred in the opposite half of the mitochondrion (n = 9).
Fig. 3.
Repetitive fusion events in the same mitochondrion can occur at different sites. A: an experiment showing consecutive cycles of a fusion event followed by a fission event in INS1 mitochondria (fission events are not shown). The two mitochondria (labeled as M1 and M2) underwent a total of five cycles of fusion-fission events during a recording period of 20 min (only 4 cycles are shown). Note that in both mitochondria the consecutive fusion site was located in the opposite portion of the mitochondrion. Arrowheads indicate the acceptor mitochondrion in pre- and postfusion frames. B: consecutive (i) and simultaneous (ii) multiorganelle fusion events in two different H9c2 cells. Bar = 2 μm. C: probability for the occurrence of a repetitive fusion event in a given INS1 mitochondrion at the same or opposite portion (n = 12 fusion events; *P = 0.025). The orientation of the recurrent event in INS1 cells was set relative to the occurrence of the first event or to the site where most fusion events occurred. The frequency was normalized to the total number of events (n = 12). D: fusion event increases the probability for a consecutive fusion event. Data summarize 10 experiments that included 29 physical contacts of which 16 (55%) developed to full fusion event (**P = 0.006).
Previous imaging studies of single fusion events showed fusion between up to two mitochondria (2, 22).We observed that a fusion event could develop between several (n ≥ 3) organelles over successive frames or simultaneously as shown in two examples in Fig. 3B. We found 10 examples in INS1 cells where up to 14 s after fusion the donor and/or acceptor mitochondria engage in a physical contact with another mitochondrion(a). Sixteen of 29 (55%) contact events developed to a successive fusion event within up to 30 s. This rate is significantly higher than the general probability for fusion occurrence following a physical contact (Fig. 3D; Fisher's two-tailed = 0.006). Collectively, these data indicate that several fusion sites can be simultaneously recruited in a given mitochondrion and that the immediate fusion history of the organelle affects its fusion activity.
Mitochondrial fusion is independent of organelle size.
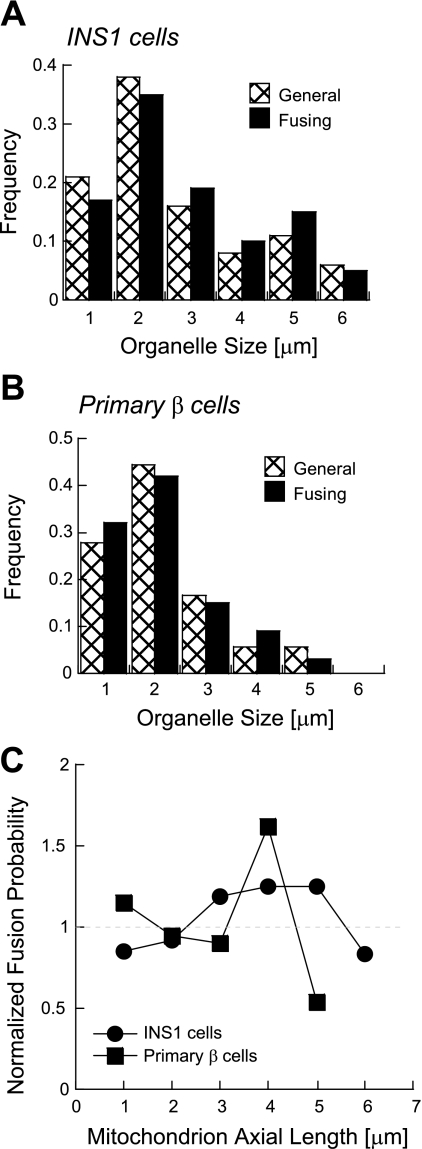
It was reported that mitochondria in both plant and mammalian cells can interact in a kiss-and-run pattern (1, 30, 49). This raises the possibility that mitochondrial fusion may be triggered by the need to maintain a certain size. The width of mitochondria in our experiments is homogeneous in accordance to a recent report in INS1 cells (41). Therefore, we determined the effect of mitochondrial size on fusion probability, by measuring only the axial length of mitochondrial units that were involved in fusion events in INS1 (n = 74) and primary β cells (n = 24) and its distribution is shown in Fig. 4, A and B (solid columns). In both types of cells, mitochondria of short length (≥2 μm) undergo fusion events to a higher frequency (∼4-fold) than that of longer ones (>4 μm). However, since the individual unit size varies within the cell, we analyzed organelle length distribution of mitochondria regardless of the occurrence of fusion or fission events. We found that mitochondria of short length are the largest population in INS1 and primary β cells (∼3–4-fold compared with long mitochondria). Therefore, this suggests that fusion is independent of organelle length, as the higher frequency of fusion events of short mitochondria is only due to their higher representation in the population. In this regard, Fisher's one-tailed probability indicated no significant difference (P > 0.3) between the two distributions for every mitochondrial length. For further clarity, Fig. 4C shows the ratio between the general and fusing mitochondrial length for every bin. The results of this normalization yield a ratio within a range of 0.84–1.19 indicating that fusion frequency is independent of mitochondrial length.
Fig. 4.
Dependency of fusion frequency upon mitochondrial length. A and B: distribution of the axial length of all the mitochondria involved in fusion events in INS1 (A, n = 74) and primary β cells (B, n = 24) is shown. The general distribution of mitochondrial length irrespective of fusion occurrence in individual mitochondria tagged by photoactivation is shown for comparison. There was insignificant difference between the two distributions (P > 0.3 for each bin). C: ratio between the two distributions is plotted for each bin.
Mitochondrial motility facilitates mitochondrial fusion.
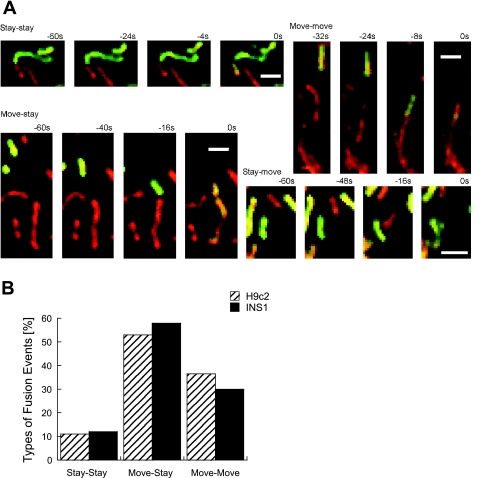
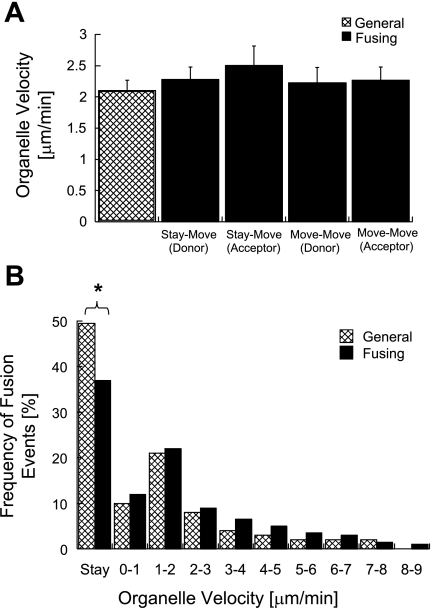
We next tested the relation between motility and fusion activity in H9c2 cells. Based on the motility of the mtPA-GFP donor or acceptor mitochondria, fusion events were sorted to stay-stay, stay-move, move-stay, and move-move groups (Fig. 5). Typical events of each group are shown in Fig. 5A. For quantification, linear movements (movement involving the center mass of the organelle) in the final minute before fusion were included in the analysis [n(H9c2)= 213 events, n(INS1) = 36 events, n(primary β) = 11 events]. In the stay-stay event, the donor fuses with its neighbor, whereas in the move-stay or stay-move groups, only donor or acceptor moves to their stationary partner. In move-move events, both donor and acceptor move to meet and fuse. We found that in all three cell types ∼90% of the fusion events (H9c2:187 of 213 events; INS1: 41 of 47 events) involved at least one motile mitochondrion. Given that 50% and 46% of H9c2 and INS1 mitochondria, respectively, are motile according to our criteria (Fig. 5B), it would be expected that ∼25% (H9c2) and 31% (INS1) of the fusion events will include stay-stay fusion type of events if fusion occurs independently of movement. The stay-stay group was, however, significantly smaller than expected in both cell types (H9c2: 26 of 213 events, Fisher's two-tailed = 0.005; INS1: 6 of 47 events, Fisher's two-tailed = 0.05). In this regard, the prevalence of stationary mitochondria in the general population is higher than those in the fusing population in both cell types (H9c2: 50% vs. 37%, Fisher's one-tailed = 0.05, “Stay” category in Fig. 6B; INS1: 55% vs. 41%, one-tailed Fisher's = 0.17).
Fig. 5.
Mitochondrial movement and fusion. A: time course of typical mitochondrial fusion events in H9c2 cells: stay-stay, move-move, move-stay, and stay-move. Bar = 2 μm. B: distribution of stay-stay, move-move, move-stay, and stay-move in occurrence of fusion events in H9c2 cells (n = 213) and in INS1 cells (n = 47).
Fig. 6.
Mitochondrial movement velocity before fusion. A: H9c2 mean mitochondrial velocity of donor (n = 48) in move-stay, acceptor in stay-move (n = 61), donor and acceptor (n = 78) in move-move. No significance was found between these three velocities (P > 0.3 for every bin). B: velocity distribution of H9c2 fusing mitochondria (n = 426) is compared with general mitochondrial population irrespective of dynamics activity (n = 200). Smaller fraction of stationary mitochondria was found in the fusing population (37% vs. 49%, *P = 0.05). The velocity distribution was similar for motile mitochondria in the two populations.
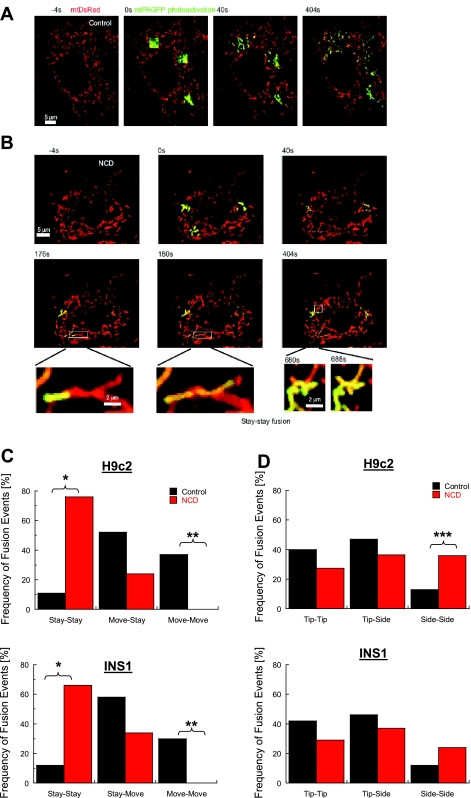
The contribution of mitochondrial movement to the distinct types of fusion events as classified, based on the site of fusion, is shown for H9c2 mitochondria in Table 1. In cases involving the mitochondria tip (side-tip, tip-side, and tip-tip) the prevalence of mitochondrial stay and move is similar. However, in H9c2 mitochondria the side-side case, the move-move is significantly less frequent (1/21) than its general occurrence (53/213; Fisher's one-tailed = 0.05). None of the other orientations exhibited a significant negative or positive correlation with mitochondrial movement. Nocodazole (NCD, 10 μM), a microtubule disrupting agent that inhibits mitochondrial movements without altering membrane or matrix properties (25, 26, 54), increased the side-side fusion events in H9c2 mitochondria to 36% compared with 14% in control (Fisher's one-tailed = 0.05). In INS1 mitochondria, the side-side fraction was doubled (6/47 to 9/35) under 10 μM NCD with a borderline significance (Fisher's one-tailed = 0.11). Tip-tip and side-tip fusion events decreased nonsignificantly in both cell types (Fig. 7, C and D).
Table 1.
Relationship between mitochondrial movement and fusion sites (donor acceptor)
| Side-Side | Side-Tip | Tip-Side | Tip-Tip | Undetermined | Total | |
|---|---|---|---|---|---|---|
| Stay-stay | 3 | 6 | 5 | 4 | 8 | 26 |
| Move-stay | 5 | 8 | 8 | 17 | 10 | 48 |
| Stay-move | 12 | 10 | 7 | 14 | 18 | 61 |
| Move-move | 1 | 12 | 13 | 27 | 25 | 78 |
| Undetermined | 0 | 1 | 1 | 1 | 27 | 30 |
| Total | 21 | 37 | 34 | 63 | 88 | 243 |
Contribution of mitochondrial movement to the distinct types of fusion events as classified based on the site of fusion. Relation between motility and fusion activity in H9c2 cells was analyzed based on the motility of the matrix-targeted photoactivatable green fluorescent protein (mtPA-GFP) donor or acceptor mitochondria. Fusion events were classified into four categories: stay-stay, stay-move, move-stay, and move-move, as shown in Fig. 5. For linear movements (movement involving the center mass of the organelle) in the final minute before fusion were used to categorize the different fusion events [n(H9c2) = 213 events].
Fig. 7.
Affect of cytoskeleton disruption on mitochondrial fusion. A: visualization of mitochondrial fusion by photoactivation in H9c2 nontreated cells. B: visualization of mitochondrial fusion by photoactivation in 10 μM Nocodazol (NCD)-pretreated (20 min) H9c2 cell. Two typical stay-stay fusion events were shown. Summary of fusion events (n = 15) in the presence of NCD. C: distribution for engagements according to motility in H9c2 and INS1 cells (*P < 0.0001; **P = 0.01). Move-stay were similar between the two groups (P > 0.3). D: summary of the same events in C for tip and side engagements (***P = 0.05).
The contribution of mitochondrial movement to the probability of fusion may be attributed to a different bioenergetic state of the moving organelles (16), the distance traveled by organelles, the collision energy, and/or the association with the cytoskeleton. To sort these components out, we compared the velocity of the donor and acceptor H9c2 mitochondria in the move-stay (n = 109) and move-move conditions (n = 78). No significant differences in movement velocity were found between either combination among these four groups (P > 0.35; Fig. 6A). The distribution of fusing and moving mitochondria according to their velocity (Fig. 6B) revealed similar fusion rate for slow- (1–2 μm/min) and fast- (>3 μm/min) moving mitochondria compared with their general occurrence in the cell (one-tailed Fisher's > 0.6).
To investigate the contribution of the cytoskeleton to the increased fusion rate of motile mitochondria regardless of their velocity, we assessed the effect NCD. In H9c2 mitochondria NCD treatment decreased fusion frequency by approximately fourfold (3.9 to 1.1 events·h−1·mitochondrion−1, Fisher's two-tailed = 0.02) and in INS1 mitochondria by ∼11-fold (2.6 to 0.25 events·h−1·mitochondrion−1, Fisher's two-tailed < 0.001). This reduction in fusion capacity selectively affected moving mitochondria; ∼73% and 65% of total fusion events in the presence of NCD were classified of stay-stay type in H9c2 and INS1 cells, respectively (compared with 12% and 11% in nontreated H9c2 and INS1 cells, respectively; P < 0.0001), whereas move-stay and move-move decreased.
Fusion pairing show a bioenergetic threshold of ±15 mV but not of physical length.
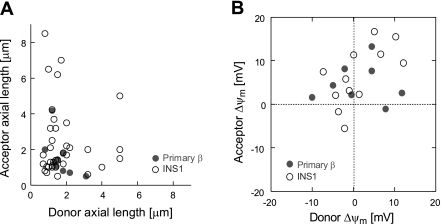
Mitochondria in every cell type studied were shown to exhibit morphological and bioenergetic heterogeneity (10, 11, 52, 53). We previously characterized the energetic level of nonfusing mitochondria (49), showing that depolarized mitochondria avoid fusion. We therefore addressed whether a threshold value of mitochondrial length and Δψm determined the fusion pairs. Therefore, we first determined whether mitochondria choose their fusion mates in a length-dependent manner. Figure 8A shows the relationship between the organelle length of the donor (the mitochondrion tagged by photoactivation) and acceptor mitochondrion (receiving activated mtPA-GFP from the donor) in INS1 (n = 37 fusion events) and primary β cells (n = 12 fusion events). We found that long mitochondria can engage with short or long mitochondria in both INS1 and primary β cells, which is in agreement with the findings shown in Fig. 4 (as short and long mitochondria have the same capacity to fuse). On the other hand, we also measured Δψm of mitochondria engaging in a fusion event using a serial z-stack (0.5 μm interval, 5–10 section per cell) obtained every 30–40 s (Fig. 8B). The value of Δψm of each mitochondrion is given relative to the average Δψm of the cell at the prefusion frame. We found that the difference in Δψm within fusing pairs spans a wide range. A mitochondrion may fuse with a mate that has a similar Δψm but also with one that differs by up to 15 mV. The average difference between engaging mitochondria was 6.2 ± 4.3 and 7.2 ± 4.1 mV in INS1 and primary β cells, respectively.
Fig. 8.
Bioenergetic dependence and consequence of single mitochondrial fusion. A: energetic properties of mitochondria engaging in a fusion event. The membrane potential of each mitochondrion was taken up to 40 s before occurrence of fusion and is represented relative to the average mitcochondrial membrane potential (Δψm) of the cell. Results summarize 12 events in INS1 cells and 8 events in primary β-cells. B: the relationship between the length of the mitochondrial donor and acceptor that are involved in fusion. Data are a summary of 37 fusion events in INS1 cells and 12 events in primary β cells.
DISCUSSION
A growing body of evidence demonstrates that the absolute rate of fusion and fission, and the balance between them, influence mitochondrial and cellular functions (1, 7, 29, 35, 48, 49, 51). The observations that mitochondrial fusion is unsynchronously occurring in different mitochondria within the cell suggested that intrinsic or local parameters play a key role in determining the likelihood of fusion. In the current work we identify the physical parameters that determine the probability of an individual mitochondrion to become involved in a fusion event.
Size and orientation.
We found that mitochondrial fusion does not depend on mitochondrial length, as the fusion probability for a given mitochondrial length is similar to its general prevalence in the cell. This is the first direct demonstration that maintaining a certain mitochondrial length is not a parameter that triggers or controls fusion selectivity, thereby ruling out the existence of an autonomous size regulation that limits or facilitates fusion when the organelle length exceeds or does not reach a certain length. This finding is in agreement with the observation that conditions that promote fusion (i.e., Opa1 overexpression) can occur in the presence of fragmented or ramified architecture (7, 9, 18), or that conditions with increased fission rates, do not block mitochondrial fusion activity (2, 38).
We found that ∼80% of fusion events in INS1 and H9c2 mitochondria involve the tip portion of the mitochondrion, whereas only ∼50% of these events involve organelle side. This ability of the mitochondrion to engage in a fusion event in diverse orientations is in agreement with a diffuse localization of both Mfn2 (8, 38, 40, 42, 43) and Opa1 (12, 29). Two factors may contribute to the preferred tip orientation. In COS-7 cells, a cell line with similar mitochondrial dynamics properties to INS1 cells (49), the profusion protein Mfn2 was preferably colocalized with Bax at the tips of mitochondria (23). In addition, since most fusion events involve moving mitochondria along the microtubule (Figs. 6 and 7), their tip is likely to be at the movement front, and therefore it has higher probability to be involved in a coming encounter. In the side-to-side case, both donor and acceptor movement would make the probability for side-to-side contacts smaller unless they come across touching each other.
From a functional point of view, nucleoids that contain mtDNA were shown to be preferably localized at the mitochondrial tip as well (15, 33). As mitochondrial fusion is an interorganelle complementation route (36, 39), mitochondrial fusion that involves the tip portion of the organelle favors an efficient exchange of mtDNA. This consideration is of special importance given the kiss-and-run pattern of dynamics that allows interorganelle equilibration for only tens of seconds and the slower mobility of mtDNA compared with matrix components (28, 32, 49).
Asymmetrical refractory period during consecutive fusion events is important for efficient dynamics.
We provide for the first time evidence that a fusion event by itself affects consequent mitochondrial fusion behavior in the short term. A fusion event increases by ∼2.5-fold the probability that a subsequent contact with another mitochondrion occurring up to 14 s after the event will result in consequent fusion event. This increased probability for a successive event has asymmetrical distribution that spares the original fusing site (Fig. 3C). This shows the existence of a refractory period that can be regulated at a submitochondrial level (i.e., the tip).
After a fusion-fission cluster, one of the daughter mitochondria undergo in most cases a transient depolarization during which it fusion capacity is smaller (49). Whereas the mechanisms underlying this depolarization remained to be elucidated, this significantly reduced the probability for a successive fusion between the two daughter mitochondria, progeny of a fission event. This phenomenon may contribute to the observed refractory period of the recent site of fusion or it may represent an additional mechanism that inhibits refusion of sibling mitochondria. Future studies are needed to explore the exact mechanisms(s) contributing to the development of such a local “refractory period” in the original fusion site.
From a functional point of view, this local regulation of fusion is a first evidence for directionality of matrix and nucleoid mixing within the mitochondrial web. Therefore, selective reduction in fusion probability in a site that just underwent fusion impedes futile fusion events and leaves the mitochondrion available for interaction(s) in other orientations with distinct mitochondria.
Mitochondrial movement as a regulator of fusion.
We show that mitochondrial motility facilitates mitochondrial fusion as ∼90% of fusion events involve moving mitochondria despite a similar prevalence of moving and static organelles in the general population (Fig. 5). On the other hand, dissection of this observation to its components reveals that fusion occurs irrespective of mitochondrial speed (Fig. 6B). This observation suggests that increased fusion rate in motile mitochondria is independent of their tendency to be in a different energy state (16) or from the total distance traveled by the organelle. However, higher probability for involvement of the tip as a fusion site and the selective Nocodazol inhibition of ∼90% of motile mitochondria involved in fusion events (Fig. 7) points to a movement-independent contribution of the cytoskeleton to mitochondrial fusion.
An intuitive explanation for facilitated dynamics in motile mitochondria is that mitochondrial movement increases the number of encounters with neighboring mitochondria and thereby the general probability for a fusion event in a given period of time. This, however, is likely not to be the sole explanation as fusion is independent of the exact velocity (Fig. 6). Mitochondrial movement subserves the localization of mitochondria in areas with high energetic demands as seen in neural synapse, growth cones, dendritic spines, and nodes of Ranvier (5, 6, 20). These areas are also likely to bear a necessity for higher fusion rate either as an intercomplementation mechanism that allows an instantaneous compensation of matrix (36, 39) and membranous metabolites depletion (4), and/or as a quality control mechanism that allows the removal of damaged organelles (47, 49). Within the context of our findings, since most fusing mitochondria are motile, they relocate after a kiss-and-run event, reducing the odds of re-engagement in what would be futile fusion events. Therefore, we suggest that movement of mitochondria is important for their ongoing function in metabolically active sites and not only for their localization in these areas.
Fusion occurs in a matching-independent fashion.
We show that the matching between fusing mitochondria does not show any specific preference of length, relative orientation, movement velocity above a certain threshold or exact potential of the fusion mate (Fig. 8). In agreement with previous results measuring Δψm in nonfusing INS1 mitochondria (49), no fusion events were observed below depolarization of more than 7 mV. Also, fusion capacity is retained for a hyperpolarizing range of 15 mV, which is in agreement with previous data which showed that hyperpolarized mitochondria could not be found within the nonfusing mitochondria population (49). Furthermore, there is no dependency on partner potential, not even when the bioenergetic difference in the engaging mitochondria is more than 10-fold in their ATP producing rate (37). This finding suggests that bioenergetic heterogeneity in the polarizing range does not limit mitochondrial fusion either by the degree of hyperpolarization or by requiring a certain bioenergetic match between the engaging mitochondria. Furthermore, it also argues against dynamics and exchange only within mitochondria restricted in certain subpopulations. This behavior is in agreement with both the metabolic need of the cell for frequent dynamics given the high morphological and functional heterogeneity within the mitochondrial population (10, 52). We recently modeled fusion dynamics and showed that increased fusion frequency (in the absence of any mtDNA repair mechanisms) is a robust mechanism that retains intact mitochondrial activity overtime (35). Therefore, the lack of morphological or bioenergetic limitations to the pairing of fusion mates allows mitochondria to extensively exchange their content.
In summary, these data suggest that certain physical properties predict the likelihood of a fusion event, and therefore, may contribute to the selective nature of the fusion process. The properties described here unravel that the exchange of mitochondrial contents is efficient, as it avoids re-engagements of recently fused mitochondria, which impedes energy-demanding futile mitochondrial fusion events.
GRANTS
This work was supported by National Institutes of Health (NIH) Grants R01HL-071629-03, R01DK-074778 (to O. S. Shirihai). M. Liesa is a recipient of a postdoctoral fellowship from Fundacion Ramon Areces. The study was also partially funded by a grant from NIH to G. Hajnóczky (AA017773) and by the ADA-Takeda postdoctoral fellow to A. J. A. Molina.
DISCLOSURES
No conflicts of interest, financial or otherwise, are declared by the author(s).
ACKNOWLEDGEMENTS
We acknowledge Dr. Lippincott-Schwartz for sharing the PAGFP construct.
REFERENCES
- 1.Arimura S, Yamamoto J, Aida GP, Nakazono M, Tsutsumi N. Frequent fusion and fission of plant mitochondria with unequal nucleoid distribution. Proc Natl Acad Sci USA 101: 7805–7808, 2004 [DOI] [PMC free article] [PubMed] [Google Scholar]
- 2.Berman SB, Chen YB, Qi B, McCaffery JM, Rucker EB, 3rd, Goebbels S, Nave KA, Arnold BA, Jonas EA, Pineda FJ, Hardwick JM. Bcl-x L increases mitochondrial fission, fusion, and biomass in neurons. J Cell Biol 184: 707–719, 2009 [DOI] [PMC free article] [PubMed] [Google Scholar]
- 3.Bindokas VP, Kuznetsov A, Sreenan S, Polonsky KS, Roe MW, Philipson LH. Visualizing superoxide production in normal and diabetic rat islets of Langerhans. J Biol Chem 278: 9796–9801, 2003 [DOI] [PubMed] [Google Scholar]
- 4.Busch KB, Bereiter-Hahn J, Wittig I, Schagger H, Jendrach M. Mitochondrial dynamics generate equal distribution but patchwork localization of respiratory. Complex I Mol Membr Biol 23: 509–520, 2006 [DOI] [PubMed] [Google Scholar]
- 5.Chada SR, Hollenbeck PJ. Mitochondrial movement and positioning in axons: the role of growth factor signaling. J Exp Biol 206: 1985–1992, 2003 [DOI] [PubMed] [Google Scholar]
- 6.Chada SR, Hollenbeck PJ. Nerve growth factor signaling regulates motility and docking of axonal mitochondria. Curr Biol 14: 1272–1276, 2004 [DOI] [PubMed] [Google Scholar]
- 7.Chen H, Chomyn A, Chan DC. Disruption of fusion results in mitochondrial heterogeneity and dysfunction. J Biol Chem 280: 26185–26192, 2005 [DOI] [PubMed] [Google Scholar]
- 8.Chen H, Detmer SA, Ewald AJ, Griffin EE, Fraser SE, Chan DC. Mitofusins Mfn1 and Mfn2 coordinately regulate mitochondrial fusion and are essential for embryonic development. J Cell Biol 160: 189–200, 2003 [DOI] [PMC free article] [PubMed] [Google Scholar]
- 9.Cipolat S, Martins de Brito O, Dal Zilio B, Scorrano L. OPA1 requires mitofusin 1 to promote mitochondrial fusion. Proc Natl Acad Sci USA 101: 15927–15932, 2004 [DOI] [PMC free article] [PubMed] [Google Scholar]
- 10.Collins TJ, Berridge MJ, Lipp P, Bootman MD. Mitochondria are morphologically and functionally heterogenous within cells. EMBO J 21: 1616–1627, 2002 [DOI] [PMC free article] [PubMed] [Google Scholar]
- 11.Collins TJ, Bootman MD. Mitochondria are morphologically heterogeneous within cells. J Exp Biol 206: 1993–2000, 2003 [DOI] [PubMed] [Google Scholar]
- 12.Delettre C, Lenaers G, Griffoin JM, Gigarel N, Lorenzo C, Belenguer P, Pelloquin L, Grosgeorge J, Turc-Carel C, Perret E, Astarie-Dequeker C, Lasquellec L, Arnaud B, Ducommun B, Kaplan J, Hamel CP. Nuclear gene OPA1, encoding a mitochondrial dynamin-related protein, is mutated in dominant optic atrophy. Nat Genet 26: 207–210, 2000 [DOI] [PubMed] [Google Scholar]
- 13.Duvezin-Caubet S, Koppen M, Wagener J, Zick M, Israel L, Bernacchia A, Jagasia R, Rugarli EI, Imhof A, Neupert W, Langer T, Reichert AS. OPA1 processing reconstituted in yeast depends on the subunit composition of the m-AAA protease in mitochondria. Mol Biol Cell 18: 3582–3590, 2007 [DOI] [PMC free article] [PubMed] [Google Scholar]
- 14.Egner A, Jakobs S, Hell SW. Fast 100-nm resolution three-dimensional microscope reveals structural plasticity of mitochondria in live yeast. Proc Natl Acad Sci USA 99: 3370–3375, 2002 [DOI] [PMC free article] [PubMed] [Google Scholar]
- 15.Garrido N, Griparic L, Jokitalo E, Wartiovaara J, van der Bliek AM, Spelbrink JN. Composition and dynamics of human mitochondrial nucleoids. Mol Biol Cell 14: 1583–1596, 2003 [DOI] [PMC free article] [PubMed] [Google Scholar]
- 16.Gerencser AA, Nicholls DG. Measurement of instantaneous velocity vectors of organelle transport: mitochondrial transport and bioenergetics in hippocampal neurons. Biophys J 95: 3079–3099, 2008 [DOI] [PMC free article] [PubMed] [Google Scholar]
- 17.Griparic L, Kanazawa T, van der Bliek AM. Regulation of the mitochondrial dynamin-like protein Opa1 by proteolytic cleavage. J Cell Biol 178: 757–764, 2007 [DOI] [PMC free article] [PubMed] [Google Scholar]
- 18.Griparic L, van der Wel NN, Orozco IJ, Peters PJ, van der Bliek AM. Loss of the intermembrane space protein Mgm1/OPA1 induces swelling and localized constrictions along the lengths of mitochondria. J Biol Chem 279: 18792–18798, 2004 [DOI] [PubMed] [Google Scholar]
- 19.Herlan M, Bornhovd C, Hell K, Neupert W, Reichert AS. Alternative topogenesis of Mgm1 and mitochondrial morphology depend on ATP and a functional import motor. J Cell Biol 165: 167–173, 2004 [DOI] [PMC free article] [PubMed] [Google Scholar]
- 20.Hollenbeck PJ. Mitochondria and neurotransmission: evacuating the synapse. Neuron 47: 331–333, 2005 [DOI] [PMC free article] [PubMed] [Google Scholar]
- 21.Ishihara N, Fujita Y, Oka T, Mihara K. Regulation of mitochondrial morphology through proteolytic cleavage of OPA1. EMBO J 25: 2966–2977, 2006 [DOI] [PMC free article] [PubMed] [Google Scholar]
- 22.Karbowski M, Arnoult D, Chen H, Chan DC, Smith CL, Youle RJ. Quantitation of mitochondrial dynamics by photolabeling of individual organelles shows that mitochondrial fusion is blocked during the Bax activation phase of apoptosis. J Cell Biol 164: 493–499, 2004 [DOI] [PMC free article] [PubMed] [Google Scholar]
- 23.Karbowski M, Lee YJ, Gaume B, Jeong SY, Frank S, Nechushtan A, Santel A, Fuller M, Smith CL, Youle RJ. Spatial and temporal association of Bax with mitochondrial fission sites, Drp1, and Mfn2 during apoptosis. J Cell Biol 159: 931–938, 2002 [DOI] [PMC free article] [PubMed] [Google Scholar]
- 24.Karbowski M, Norris KL, Cleland MM, Jeong SY, Youle RJ. Role of Bax and Bak in mitochondrial morphogenesis. Nature 443: 658–662, 2006 [DOI] [PubMed] [Google Scholar]
- 25.Knowles MK, Guenza MG, Capaldi RA, Marcus AH. Cytoskeletal-assisted dynamics of the mitochondrial reticulum in living cells. Proc Natl Acad Sci USA 99: 14772–14777, 2002 [DOI] [PMC free article] [PubMed] [Google Scholar]
- 26.Koopman WJ, Distelmaier F, Hink MA, Verkaart S, Wijers M, Fransen J, Smeitink JA, Willems PH. Inherited complex I deficiency is associated with faster protein diffusion in the matrix of moving mitochondria. Am J Physiol Cell Physiol 294: C1124–C1132, 2008 [DOI] [PubMed] [Google Scholar]
- 27.Koshiba T, Detmer SA, Kaiser JT, Chen H, McCaffery JM, Chan DC. Structural basis of mitochondrial tethering by mitofusin complexes. Science 305: 858–862, 2004 [DOI] [PubMed] [Google Scholar]
- 28.Legros F, Malka F, Frachon P, Lombes A, Rojo M. Organization and dynamics of human mitochondrial DNA. J Cell Sci 117: 2653–2662, 2004 [DOI] [PubMed] [Google Scholar]
- 29.Liesa M, Palacin M, Zorzano A. Mitochondrial dynamics in mammalian health and disease. Physiol Rev 89: 799–845, 2009 [DOI] [PubMed] [Google Scholar]
- 30.Liu X, Weaver D, Shirihai O, Hajnoczky G. Mitochondrial “kiss-and-run”: interplay between mitochondrial motility and fusion-fission dynamics. EMBO J 28: 3074–3089, 2009 [DOI] [PMC free article] [PubMed] [Google Scholar]
- 31.Malka F, Guillery O, Cifuentes-Diaz C, Guillou E, Belenguer P, Lombes A, Rojo M. Separate fusion of outer and inner mitochondrial membranes. EMBO Rep 6: 853–859, 2005 [DOI] [PMC free article] [PubMed] [Google Scholar]
- 32.Malka F, Lombes A, Rojo M. Organization, dynamics and transmission of mitochondrial DNA: focus on vertebrate nucleoids. Biochim Biophys Acta 1763: 463–472, 2006 [DOI] [PubMed] [Google Scholar]
- 33.Margineantu DH, Brown RM, Brown GK, Marcus AH, Capaldi RA. Heterogeneous distribution of pyruvate dehydrogenase in the matrix of mitochondria. Mitochondrion 1: 327–338, 2002 [DOI] [PubMed] [Google Scholar]
- 34.Molina AJ, Wikstrom JD, Stiles L, Las G, Mohamed H, Elorza A, Walzer G, Twig G, Katz S, Corkey BE, Shirihai OS. Mitochondrial Networking Protects Beta Cells from Nutrient Induced Apoptosis. Diabetes 58: 2303–2315, 2009 [DOI] [PMC free article] [PubMed] [Google Scholar]
- 35.Mouli PK, Twig G, Shirihai OS. Frequency and selectivity of mitochondrial fusion are key to its quality maintenance function. Biophys J 96: 3509–3518, 2009 [DOI] [PMC free article] [PubMed] [Google Scholar]
- 36.Nakada K, Inoue K, Ono T, Isobe K, Ogura A, Goto YI, Nonaka I, Hayashi JI. Inter-mitochondrial complementation: Mitochondria-specific system preventing mice from expression of disease phenotypes by mutant mtDNA. Nat Med 7: 934–940, 2001 [DOI] [PubMed] [Google Scholar]
- 37.Nicholls DG. Mitochondrial membrane potential and aging. Aging Cell 3: 35–40, 2004 [DOI] [PubMed] [Google Scholar]
- 38.Niemann A, Ruegg M, La Padula V, Schenone A, Suter U. Ganglioside-induced differentiation associated protein 1 is a regulator of the mitochondrial network: new implications for Charcot-Marie-Tooth disease. J Cell Biol 170: 1067–1078, 2005 [DOI] [PMC free article] [PubMed] [Google Scholar]
- 39.Ono T, Isobe K, Nakada K, Hayashi JI. Human cells are protected from mitochondrial dysfunction by complementation of DNA products in fused mitochondria. Nat Genet 28: 272–275, 2001 [DOI] [PubMed] [Google Scholar]
- 40.Pich S, Bach D, Briones P, Liesa M, Camps M, Testar X, Palacin M, Zorzano A. The Charcot-Marie-Tooth type 2A gene product, Mfn2, up-regulates fuel oxidation through expression of OXPHOS system. Hum Mol Genet 14: 1405–1415, 2005 [DOI] [PubMed] [Google Scholar]
- 41.Plecita-Hlavata L, Lessard M, Santorova J, Bewersdorf J, Jezek P. Mitochondrial oxidative phosphorylation and energetic status are reflected by morphology of mitochondrial network in INS-1E and HEP-G2 cells viewed by 4Pi microscopy. Biochim Biophys Acta 1777: 834–846, 2008 [DOI] [PubMed] [Google Scholar]
- 42.Rojo M, Legros F, Chateau D, Lombes A. Membrane topology and mitochondrial targeting of mitofusins, ubiquitous mammalian homologs of the transmembrane GTPase Fzo. J Cell Sci 115: 1663–1674, 2002 [DOI] [PubMed] [Google Scholar]
- 43.Santel A, Fuller MT. Control of mitochondrial morphology by a human mitofusin. J Cell Sci 114: 867–874, 2001 [DOI] [PubMed] [Google Scholar]
- 44.Song Z, Chen H, Fiket M, Alexander C, Chan DC. OPA1 processing controls mitochondrial fusion and is regulated by mRNA splicing, membrane potential, and Yme1L. J Cell Biol 178: 749–755, 2007 [DOI] [PMC free article] [PubMed] [Google Scholar]
- 45.Song Z, Ghochani M, McCaffery JM, Frey TG, Chan DC. Mitofusins and OPA1 Mediate Sequential Steps in Mitochondrial Membrane Fusion. Mol Biol Cell 20: 3525–3532, 2009 [DOI] [PMC free article] [PubMed] [Google Scholar]
- 46.Szalai G, Csordas G, Hantash BM, Thomas AP, Hajnoczky G. Calcium signal transmission between ryanodine receptors and mitochondria. J Biol Chem 275: 15305–15313, 2000 [DOI] [PubMed] [Google Scholar]
- 47.Tatsuta T, Langer T. Quality control of mitochondria: protection against neurodegeneration and ageing. EMBO J 27: 306–314, 2008 [DOI] [PMC free article] [PubMed] [Google Scholar]
- 48.Tondera D, Grandemange S, Jourdain A, Karbowski M, Mattenberger Y, Herzig S, Da Cruz S, Clerc P, Raschke I, Merkwirth C, Ehses S, Krause F, Chan DC, Alexander C, Bauer C, Youle R, Langer T, Martinou JC. SLP-2 is required for stress-induced mitochondrial hyperfusion. EMBO J 28: 1589–1600, 2009 [DOI] [PMC free article] [PubMed] [Google Scholar]
- 49.Twig G, Elorza A, Molina AJ, Mohamed H, Wikstrom JD, Walzer G, Stiles L, Haigh SE, Katz S, Las G, Alroy J, Wu M, Py BF, Yuan J, Deeney JT, Corkey BE, Shirihai OS. Fission and selective fusion govern mitochondrial segregation and elimination by autophagy. EMBO J 27: 433–446, 2008 [DOI] [PMC free article] [PubMed] [Google Scholar]
- 50.Twig G, Graf SA, Wikstrom JD, Mohamed H, Haigh SE, Elorza A, Deutsch M, Zurgil N, Reynolds N, Shirihai OS. Tagging and tracking individual networks within a complex mitochondrial web with photoactivatable GFP. Am J Physiol Cell Physiol 291: C176–C184, 2006 [DOI] [PubMed] [Google Scholar]
- 51.Twig G, Hyde B, Shirihai OS. Mitochondrial fusion, fission and autophagy as a quality control axis: the bioenergetic view. Biochim Biophys Acta 1777: 1092–1097, 2008 [DOI] [PMC free article] [PubMed] [Google Scholar]
- 52.Wikstrom JD, Katzman SM, Mohamed H, Twig G, Graf SA, Heart E, Molina AJ, Corkey BE, de Vargas LM, Danial NN, Collins S, Shirihai OS. beta-Cell mitochondria exhibit membrane potential heterogeneity that can be altered by stimulatory or toxic fuel levels. Diabetes 56: 2569–2578, 2007 [DOI] [PubMed] [Google Scholar]
- 53.Wikstrom JD, Twig G, Shirihai OS. What can mitochondrial heterogeneity tell us about mitochondrial dynamics and autophagy? Int J Biochem Cell Biol 41: 1914–1927, 2009 [DOI] [PubMed] [Google Scholar]
- 54.Yi M, Weaver D, Hajnoczky G. Control of mitochondrial motility and distribution by calcium signal: a homeostatic circuit. J Cell Biol 167: 661–672, 2004 [DOI] [PMC free article] [PubMed] [Google Scholar]
- 55.Yu T, Robotham JL, Yoon Y. Increased production of reactive oxygen species in hyperglycemic conditions requires dynamic change of mitochondrial morphology. Proc Natl Acad Sci USA 103: 2653–2658, 2006 [DOI] [PMC free article] [PubMed] [Google Scholar]


