Abstract
Sodium pyruvate can increase mitochondrial biogenesis in C2C12 myoblasts in a peroxisome proliferator-activated receptor-γ coactivator-1α (PGC1α)-independent manner. The present study examined the effect of 72-h treatment with sodium pyruvate (5–50 mM) or sodium chloride (50 mM) as an osmotic control on the regulation of mitochondrial substrate metabolism and biogenesis in C2C12 myotubes. Pyruvate (50 mM) increased the levels of fatty acid oxidation enzymes (CD36, 61%, and β-oxidative enzyme 3-hydroxyacyl-CoA dehydrogenase, 54%) and the expression of cytochrome-c oxidase subunit I (220%) and cytochrome c (228%), consistent with its previous described role as a promoter of mitochondrial biogenesis. However, in contrast, pyruvate treatment reduced glucose transporter 4 (42%), phosphofructokinase (57%), and PGC1α (72%) protein content as well as PGC1α (48%) and PGC1β (122%) mRNA. The decrease in PGC1α was compensated for by an increase in the PGC1α-related coactivator (PRC; 187%). Pyruvate treatment reduced basal and insulin-stimulated glucose uptake (41% and 31%, respectively) and palmitate uptake and oxidation (24% and 31%, respectively). The addition of the pyruvate dehydrogenase activator dichloroacetate (DCA) and the TCA precursor glutamine increased PGC1α expression (368%) and returned PRC expression to basal. Glucose uptake increased by 4.2-fold with DCA and glutamine and palmitate uptake increased by 18%. Coupled to this adaptation was an 80% increase in oxygen consumption. The data suggest that supraphysiological doses of pyruvate decrease mitochondrial function despite limited biogenesis and that anaplerotic agents can reverse this effect.
Keywords: glutamine, glucose metabolism, Type 2 diabetes, peroxisome proliferator-activated receptor-γ coactivator-1α
transcriptional coactivators are potent regulators of skeletal muscle metabolic function due to their ability to facilitate transcription factor activation in response to a number of extrinsic stimuli (2). The best characterized skeletal muscle coactivator is the peroxisome proliferator-activated receptor-γ coactivator-1α (PGC1α), which has been suggested as a master regulator of mammalian mitochondrial biogenesis (25). PGC1α is rapidly induced in skeletal muscle in response to exercise (3, 24), and global overexpression leads to a shift towards oxidative metabolism in skeletal and cardiac muscle (18). Muscle-specific overexpression of PGC1α leads to increased endurance performance (4), whereas decreased expression has been implicated in reduced exercise tolerance, chronic inflammation, and mitochondrial myopathy (10, 20).
Even though PGC1α is proposed as a master regulator of mitochondrial biogenesis, there are a number of situations where mitochondrial biogenesis occurs despite deleted or suppressed PGC1α expression/function. The Moyes group (15) has shown that PGC1α is not required for the increase in mitochondria associated with muscle differentiation. In mature skeletal muscle, Leick et al. (17) demonstrated that whole body PGC1α deletion does not completely repress adaptive responses to endurance training. This led the authors to conclude that PGC1α was not mandatory for mitochondrial adaptation. In support of this conclusion, Wilson et al. (31) have described PGC1α-independent mitochondrial biogenesis in C2C12 myoblasts.
PGC1α is downregulated in humans during both hyperglycemia and hyperlipidemia with PGC1α expression directly related to physical activity, substrate supply, and the interaction of these factors (11). The decrease in PGC1α in these pathological states appears to be a direct result of nutrient excess because high glucose (22) and/or saturated fatty acids (5) both suppress PGC1α in vitro. Acute treatment with lactate (12) or pyruvate (26) promotes mitochondrial biogenesis in a PGC1α-dependent manner. However, prolonged treatment with pyruvate promotes mitochondrial biogenesis in a PGC1α-independent manner (31). This suggests that pyruvate transiently increases PGC1α, whereas prolonged exposure to elevated pyruvate is seen as nutrient excess, similar to hyperglycemia, resulting in a fundamentally different cellular response.
It was therefore the aim of the present study to determine the mechanism underlying the pyruvate-induced mitochondrial biogenesis described by Wilson et al. (31). However, when the effects of pyruvate administration on mitochondrial function were examined, substrate metabolism, regulators of mitochondrial biogenesis, and mitochondrial function were decreased in differentiated C2C12 myotubes. We hypothesized that this decrease in function was due to metabolic overload and decreased TCA cycle flux. This hypothesis was tested by increasing the entry of pyruvate into the TCA cycle, via the pyruvate dehydrogenase (PDH) activator dichloroacetate (DCA), and increasing TCA flux via the anaplerotic amino acid glutamine.
METHODS
Materials.
C2C12 cells were from American Type Culture Collection. Sodium pyruvate was from Lonza Biologics (Berkshire, UK). All other materials were from Sigma Aldrich (Dorset, UK).
Cell culture.
C2C12 myoblasts were cultured on 100-mm or 35-mm plates (DMEM, 10% FBS, and 1% penicillin-streptomycin; Invitrogen, Paisley, UK) until 90% confluent when they were differentiated (DMEM, 2% normal horse serum, 1% penicillin-streptomycin; Invitrogen). All experiments took place after 5 days of differentiation on fully formed myotubes. Myotubes were treated for 72 h with sodium pyruvate (5–50 mM), DCA, glutamine, or sodium chloride (50 mM) as an osmotic control.
Following treatment, cells were collected in lysis buffer (50 mM Tris, pH 7.5, 250 mM sucrose, 1 mM EDTA, 1 mM EGTA, 1% Triton X-100, 1 mM NaVO4, 50 mM NaF, 0.10% DTT, and 0.50% protease inhibitor cocktail), shaken at 4°C for 20 min (12,000 rpm), and centrifuged for 5 min at 12,000 rpm, and the supernatant was removed for protein determination. Protein concentration was determined using the DC protein assay (Bio-Rad, Hertfordshire, UK).
Western blot analysis.
Equal aliquots of protein were boiled in Laemmli sample buffer (250 mM Tris·HCl, pH 6.8, 2% SDS, 10% glycerol, 0.01% bromophenol blue, and 5% β-mercaptoethanol) and separated on SDS polyacrylamide gels (7.5–10%) for 1 h. Following electrophoresis, proteins were transferred to a Protran nitrocellulose membrane (Whatman, Dassel, Germany) at 100 V for 1 h. The membranes were incubated overnight at 4°C with appropriate primary antibody. The primary antibodies used were PGC1α (516557, Calbiochem), glucose transporter 4 (GLUT4) (7938, Santa Cruz), carnitine palmitoyltransferase (CPT) 1 (CPT1M11-S, Alpha Diagnostics), succinate dehydrogenase (SDH) (A11142, Molecular Probes), ATPsynthase-β (A21351, Molecular Probes), CD36 (36977, Abcam), β-3-hydroxyacyl-CoA dehydrogenase (β-HAD) (37673, Abcam), phosphofructokinase (PFK) (31712, Santa Cruz), and eukaryotic elongation factor 2 (2332, Cell Signaling). Malonyl-CoA decarboxylase (MCD), phospho-PDH, PDH, and acetyl-CoA carboxylase-β were provided by Prof. Grahame Hardie (Univ. of Dundee, Dundee, UK). Antibody binding was detected using enhanced chemiluminescence (Millipore, Billerica, MA). Imaging and band quantification were carried out using a Chemi Genius Bioimaging Gel Doc System (Syngene, Cambridge, UK).
RNA extraction and cDNA synthesis.
RNA was extracted from cells using the phenol/chloroform method as previously described (19). RNA was quantified using a NanoDrop 1000 spectrophotometer (Thermo Scientific, Leicestershire, UK) at 260 and 280 nm. First-strand cDNA was synthesized on a Thermo Hybaid cycler (Thermo Scientific) from 1 μg of RNA using the reverse transcription system (Promega, Hampshire, UK) according to the manufacturer's instructions.
Quantitative RT-PCR.
Real-time PCR was performed to measure relative mRNA expression using an Eppendorf Light Cycler PCR machine, SYBR green PCR plus reagents (Sigma Aldrich), and custom designed primers. Ten-microliter PCR reactions were assayed in triplicate on a 96-well heat-sealed PCR plate (Thermo Scientific). Each reaction contained 5 μl SYBR green taq, 1 μl of forward and reverse primers, and 3 μl of cDNA (1:10 dilution). The target gene expression was calculated relative to values from glyceraldehyde-3-phosphate dehydrogenase (GAPDH) and is expressed normalized to pretreatment values. Absolute cycle number at threshold for GAPDH was unchanged by any of the treatments. Primers for real-time PCR were designed to span exon-exon boundaries to avoid amplification of genomic DNA. Sequences used are available online at http://www.fmblab.com.
Glucose uptake.
Following 72-h treatment, C2C12 myotubes were treated with either 100 nM insulin or ETH for 30 min and then washed three times with HEPES-buffered saline (HBS; 140 mM NaCl, 20 mM HEPES, 5 mM KCl, 2.5 mM MgSO4, and 1 mM CaCl2, pH 7.4). Glucose uptake was assayed by incubation with 10 μM 2-deoxy-[3H]d-glucose (1 μCi/ml) for 10 min (NET549, Perkin Elmer). Nonspecific binding was determined by quantifying cell-associated radioactivity in the presence of 10 μM cytochalasin B (7). Media were aspirated before adherent cells were rapidly washed three times with 0.9% (wt/vol) ice-cold saline. Cells were subsequently lysed in 50 mM NaOH, and intracellular [3H]d-glucose was quantified using a Beckman LS 6000IC scintillation counter. Protein concentration in cell lysates was determined using the Bradford reagent as described above.
Palmitate uptake and oxidation.
Myotubes were washed with HBS and subsequently incubated with media containing 0.75 mM palmitate (conjugated to 2% fatty acid-free BSA)-[14C]palmitate at 2 μCi/ml (GE Healthcare-CFA23) for 2 h. Following this incubation period, 1 ml of the culture medium was carefully transferred to a sealable tube, the cap of which housed a Whatman (GF/B) filter paper disc that had been presoaked with 1 M KOH. 14CO2 trapped in the media was then released by acidification of media using 60% (vol/vol) perchloric acid and gentle agitation of the tubes at 37°C for 2 h. Radioactivity that had become adsorbed onto the filter discs was subsequently quantified by liquid scintillation counting. For measurement of palmitate uptake, cells were washed and lysed, and [14C]palmitate was measured as previously described for glucose uptake.
Cellular respiration.
Cells were seeded in XF 24-well cell culture microplates (Seahorse Bioscience, Fisher Scientific) at 2.0–3.0 × 10⁴ cells/well (0.32 cm2) in 500 μl growth medium, incubated at 37°C/5% CO2 for 24 h, and then differentiated for 3 days with the relevant nutrient intervention. A total of 10 measurements were made throughout the testing period.
SirT1 activity.
SirT1 activity was determined via a commercially available two-step enzymatic reaction kit (Sigma-Aldrich). Cells were collected in lysis buffer as previously described, and 30 μg protein was used in the reaction (9). Measured fluorescence is directly proportional to the deacetylation activity of the enzyme in the sample. Parallel control samples were treated with either the SirT1 inhibitor nicotinamide (Sigma-Aldrich) or the activator resveratrol (Sigma-Aldrich).
Nucleotide measurements.
Cellular ATP and ADP were determined as previously described (8). Following nutrient treatments, cells were washed with 1 ml of ice-cold PBS and 300 μl of ice-cold 5% perchloric acid was added to each 10-cm plate. Collected samples were vortex-mixed for 10 s to ensure complete lysis and centrifuged at 14,000 g for 3 min at 4°C to remove acid-insoluble material. The supernatant was extracted with two washes of an equal volume of 1:1 tri-n-octylamine and 1,1,2-trichlorotrifluoroethane. The nucleotides remaining in the aqueous phase were then separated by capillary electrophoresis with on-column isotachophoretic concentration, using run buffers consisting of 50 mM sodium phosphate and 50 mM NaCl (pH 5.2; leading buffer) and 100 mM Mes-Tris (pH 5.2; tailing buffer). To each buffer was added 0.2% hydroxyethylcellulose to decrease electro-osmotic flow. Nucleotide peaks were detected by UV absorbance at 260 nM and were integrated using System Gold software (Beckman). Nucleotide ratios were calculated from peak areas after correction for retention times. Identification of peaks as ATP, ADP, and AMP was confirmed by additional runs spiked with internal standards and analysis of absorbance spectra of individual peaks.
NAD and NADH content was determined via a commercially available kit (K337–100 Biovision). Following nutrient treatments, cells were washed with 1 ml of ice-cold PBS, scraped, and centrifuged at 425 g for 5 min at 4°C. NAD/NADH extraction was performed via 20 min of freeze-thawing on dry ice. To quantify NADH, total NAD was decomposed via heating at 60°C for 30 min. NAD cycling mix was added to both samples, and the samples were incubated at room temperature for 5 min before the addition of NADH developer solution. Samples were left to incubate at room temperature for 3 h before the addition of stop solution. Samples were then read on a spectrophotometer at 450 nM (Epoch, Biotech). Protein content was determined in each sample via the Bradford method, and values are expressed relative to protein content.
Statistical analysis.
A two-way analysis of variance (http://brightstat.com) was used to determine differences in protein content, mRNA expression, or substrate uptake/oxidation following each nutrient intervention. Values are displayed as means ± SE, with statistical significance set at 0.05.
RESULTS
Pyruvate upregulates electron transport chain enzymes but decreases metabolic rate.
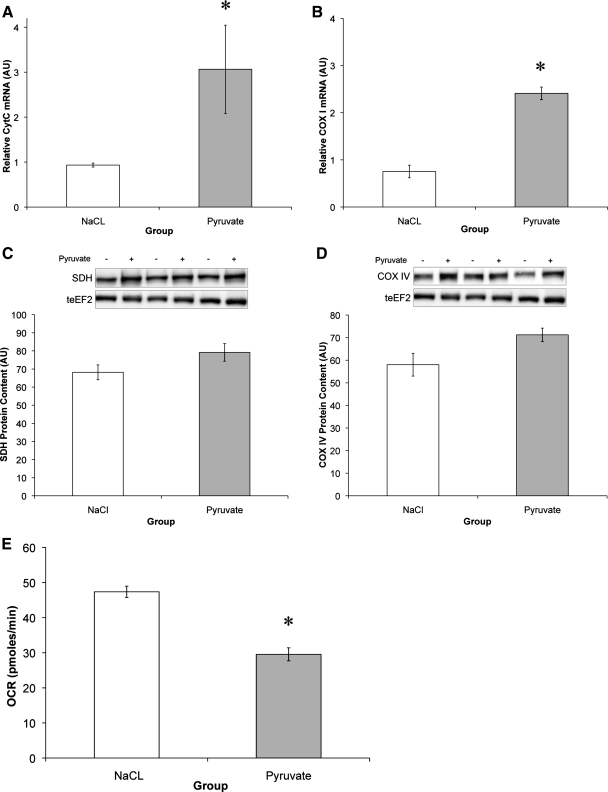
Treatment of C2C12 myotubes with 50 mM pyruvate for 72 h resulted in an upregulation of components of the respiratory chain. COX-I mRNA increased 220%, and cytochrome c by 228% (Fig. 1, A and B). Similarly, protein content of succinate dehydrogenase (16%), COX IV (22%), and ATP synthase-γ (10%) tended to increase following the 72-h pyruvate intervention (Fig. 1, C and D). These observations are in accordance with previous research, which showed that pyruvate could induce mitochondrial biogenesis in C2C12 myoblasts via upregulation of respiratory chain function and expression (31). However, the functional capacity of the cells decreased by 38% following 3 days of pyruvate treatment.
Fig. 1.
Pyruvate upregulates electron transport chain enzymes but decreases metabolic rate. A and B: mRNA expression levels of cytochrome c (CytC) (A) and cytochrome-c oxidase subunit I (COX I) (B) relative to GAPDH. AU, arbitrary units. C and D: protein content of succinate dehydrogenase (SDH) (C) and COX IV (D) relative to total eukaryotic elongation factor 2 (teEF2) content. E: oxygen consumption rate (OCR) following 72-h pyruvate or NaCl treatment. *Significantly different from NaCl (P < 0.05).
Pyruvate increases fatty acid oxidative enzyme levels while decreasing uptake.
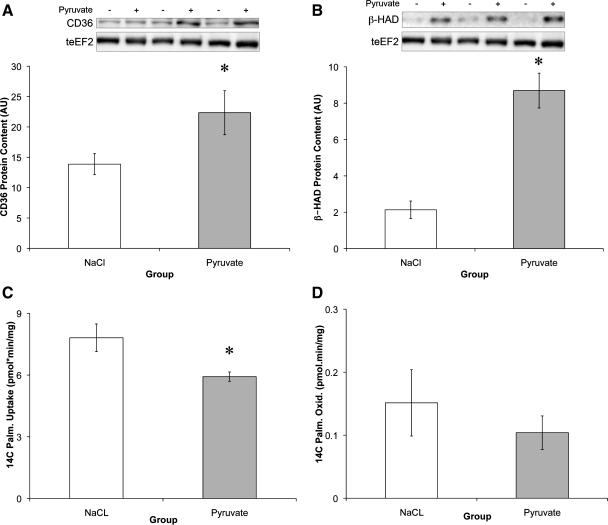
As with the respiratory chain enzymes, there was a significant increase in the protein content of the fatty acid transporter CD36 (61%) and the β-oxidation enzyme HAD (307%; Fig. 2, A and B). However, this increase in protein did not translate into increased fatty acid uptake or oxidation. In fact, palmitate uptake decreased 24.2% following 3 days of pyruvate treatment (Fig. 2, C and D).
Fig. 2.
Pyruvate increases fatty acid oxidative enzyme levels while decreasing uptake. A and B: protein content of CD36 (A) and β-oxidative enzyme 3-hydroxyacyl-CoA dehydrogenase (β-HAD) (B) relative to teEF2 content. C and D: cells were treated with [14C]palmitate (Palm) for 2 h to measure basal levels of [14C]palmitate uptake (C) and oxidation (Oxid) (D) following 72-h pyruvate or NaCl treatment. *Significantly different from NaCl (P < 0.05).
Impaired carbohydrate metabolism and insulin resistance following pyruvate treatment.
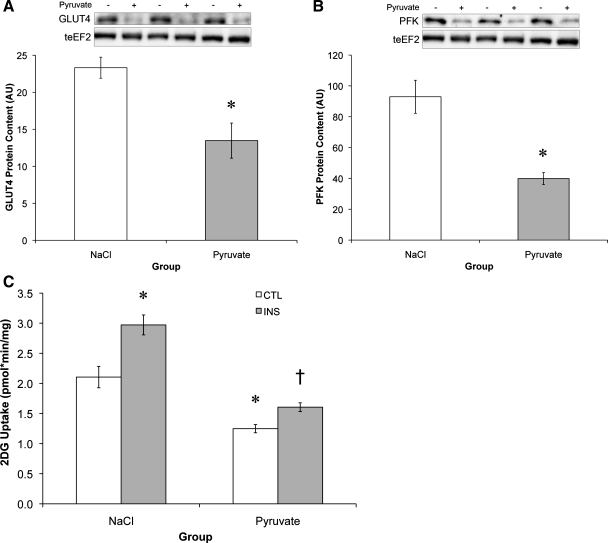
While respiratory chain and fatty acid oxidative enzymes increased, glycolytic enzymes were decreased with pyruvate treatment. The glucose transporter GLUT4 was reduced 42%, and PFK, the rate-limiting enzyme in glycolysis, was reduced 57% (Fig. 3, A and B). Concomitant with the decrease in glycolytic enzymes was a 41% reduction in basal glucose uptake and a 31% reduction in insulin-stimulated glucose uptake (Fig. 3C). The resulting metabolic phenotype, decreased fatty acid and carbohydrate (CHO) uptake and a decrease in oxygen consumption, is similar to that observed in Type 2 diabetes, where oversupply of a single substrate leads to impaired metabolic function (13, 23).
Fig. 3.
Pyruvate decreases glycolytic enzyme levels and glucose uptake. A and B: protein content of glucose transporter 4 (GLUT4) (A) and phosphofructokinase (PFK) (B) relative to teEF2 protein content. C: 2-deoxy-[3H]d-glucose (2DG) uptake was assessed either in the basal state (control, CTL) or following 30-min insulin treatment (INS). *Significantly different from NaCl (P < 0.05); †significantly different from NaCl-insulin treatment (P < 0.05).
Chronic pyruvate at physiological and supraphysiological levels potently suppresses PGC1α.
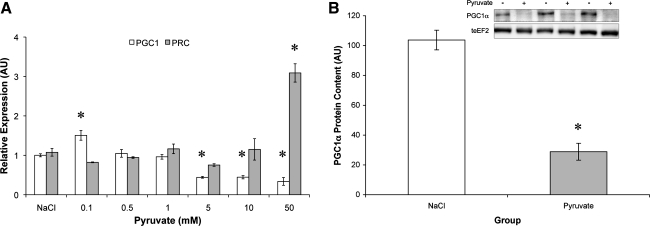
Consistent with impaired metabolic function, pyruvate administration at physiological and supraphysiological concentrations (5–50 mM) reduced PGC1α (Fig. 4A) and PGC1β (not shown) expression and PGC1α protein content (Fig. 4B). While PGC1α and -β were suppressed, expression of the PGC1α-related coactivator (PRC) was markedly upregulated by pyruvate treatment (Fig. 4A).
Fig. 4.
Chronic pyruvate suppresses peroxisome proliferator-activated receptor-γ coactivator-1α (PGC1α) but increases PGC1α-related coactivator (PRC). A: dose-response relationship between pyruvate concentration and the change in PGC1α and PRC mRNA. B: PGC1α protein content relative to teEF2 protein content. *Significantly different from NaCl (P < 0.05).
Increasing TCA cycle flux relieves the pyruvate metabolic impairment.
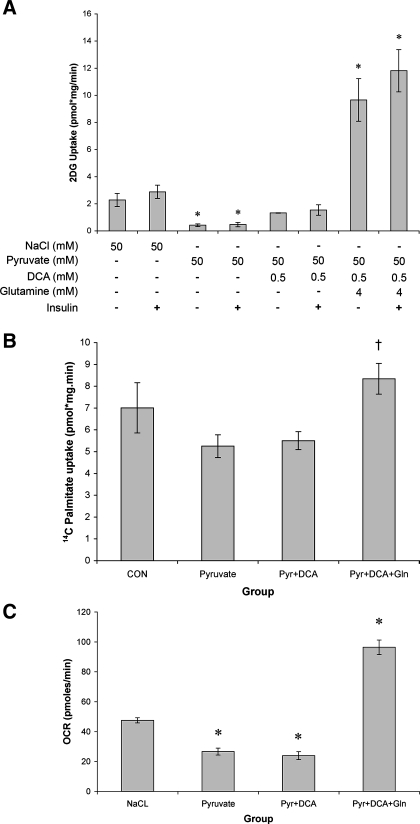
We hypothesized that the sustained elevation in pyruvate was slowing TCA flux and suppressing metabolism in the C2C12 myotubes. In light of this, we sought to examine whether increasing entry of pyruvate into the TCA cycle could reverse the negative metabolic phenotype. Pyruvate together with the PDH activator DCA returned glucose uptake to control levels (Fig. 5A). To further increase TCA cycle flux, glutamine was included to stimulate anaplerosis at a second position (α-ketogluterate). The addition of glutamine and DCA increased basal glucose uptake 4.2-fold compared with control cells and 23.1-fold compared with pyruvate-treated cells (Fig. 5A).
Fig. 5.
Increasing TCA cycle flux relieves the pyruvate metabolic impairment. A: basal and insulin-stimulated 2DG uptake was measured following 72-h treatment with NaCl (50 mM) or pyruvate (50 mM) alone, or pyruvate with dichloroacetate (DCA: 0.5 mM) or glutamine (4 mM). B: basal [14C]palmitate uptake following 72-h treatment with NaCl (50 mM) or pyruvate (Pyr; 50 mM) alone, or pyruvate with DCA (0.5 mM) or glutamine (Gln; 4 mM). CON, control. C: basal oxygen consumption rate following 72-h treatment with NaCl (50 mM) or pyruvate (50 mM) alone, or pyruvate with DCA (0.5 mM) or glutamine (4 mM). *Significantly different from NaCl (P < 0.05); †significantly different from pyruvate (P < 0.05).
In contrast to the effects on glucose metabolism, DCA treatment alone had little effect on palmitate uptake (Fig. 5B). However, the combination of DCA and glutamine increased palmitate uptake 18% compared with the NaCl control and by 59% compared with pyruvate treatment. Finally, the combination of DCA and glutamine increased myotube oxygen consumption rate by 103% compared with NaCl treatment controls and by 261% compared with pyruvate treatment alone.
Increasing TCA cycle flux induces mitochondrial biogenesis.
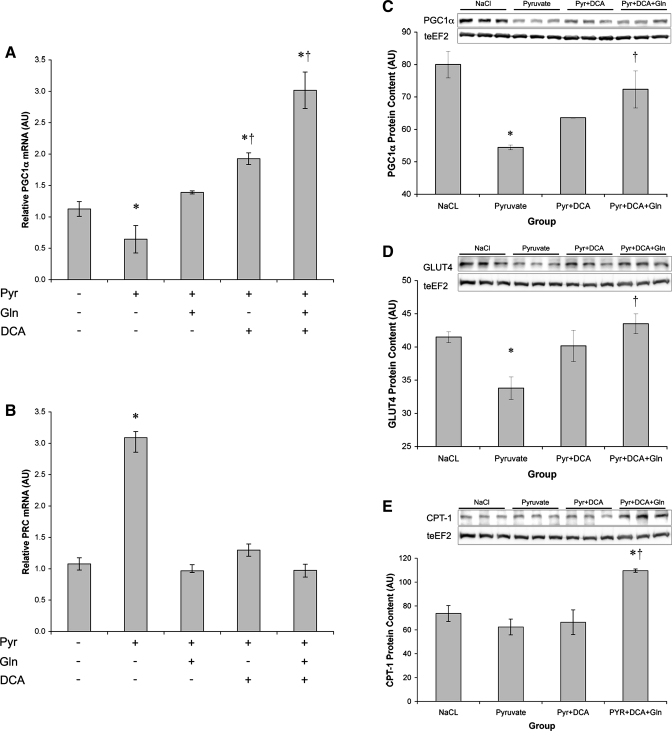
Having rescued palmitate uptake and enhanced glucose uptake and cell respiration, we next sought to examine whether the addition of DCA, glutamine, or both agents would alter mitochondrial biogenesis. The addition of DCA or glutamine individually reversed the pyruvate-induced suppression of PGC1α mRNA (Fig. 6A). Combining DCA and glutamine increased PGC1α expression 2.67-fold over control. In contrast, PRC expression returned to baseline levels when DCA, glutamine, or both agents were included with pyruvate (Fig. 6B). DCA partially reversed the loss of PGC1α protein with pyruvate treatment (Fig. 6C), and DCA and glutamine combined returned PGC1α protein to basal levels. The addition of DCA and glutamine also rescued GLUT4 levels (Fig. 6D) and increased CPT-1 protein (Fig. 6E). DCA and glutamine treatment also increased ATPsynthase-γ [NaCl = 90.5 ± 4.3 arbitrary units (AU); pyruvate + DCA + glutamine = 109.9 ± 4.1 AU].
Fig. 6.
Increasing TCA cycle flux induces mitochondrial biogenesis. A and B: PGC1α (A) and PRC (B) mRNA expression relative to GAPDH expression following 72-h treatment with NaCl (50 mM) or pyruvate (50 mM) alone, or pyruvate with DCA (0.5 mM) or glutamine (4 mM). C–E: PGC1α (C), GLUT4 (D), and carnitine palmitoyltransferase 1 (CPT-1) (E) protein content relative to teEF2 content following 72-h treatment with NaCl (50 mM) or pyruvate (50 mM) alone, or pyruvate with DCA (0.5 mM) or glutamine (4 mM). *Significantly different from NaCl (P < 0.05); †significantly different from pyruvate (P < 0.05).
TCA cycle flux regulates cellular energy balance.
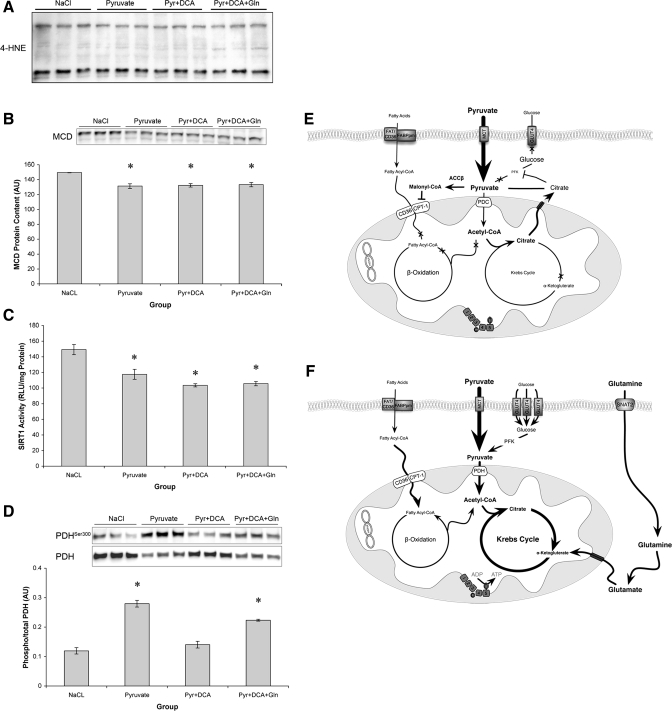
On the basis of our data set, we hypothesized that the negative effects of pyruvate on cellular metabolism were due to saturation of glycolytic metabolites, which resulted in reduced substrate supply to the TCA cycle (Fig. 7, E and F). To test this hypothesis, we measured cellular nucleotide concentrations and reactive oxygen species (ROS) production in an attempt to gauge cellular energy status (Table 1 and Fig. 7A). In support of our hypothesis, 72-h pyruvate treatment reduced cellular NAD and ATP content, whereas cotreatment with glutamine and DCA rescued this suppression and led to a significant increase in NAD (Table 1). Furthermore, it appeared that the effect of pyruvate treatment was independent of ROS production because there was no increase in 4-hydroxy-2-nonenal protein, a readout of lipid peroxidation [Fig. 7A (21)].
Fig. 7.
Effects of TCA cycle flux on regulators of metabolism. A: absolute levels of 4-hydroxy-2-nonenal (4-HNE)-conjugated proteins. B: malonyl-CoA decarboxylase (MCD) protein content relative to teEF2 content. C: SirT1 activity relative to total protein. D: phosphorylation of pyruvate dehydrogenase Ser300 (PDH) relative to total PDH content. *Significantly different from NaCl (P < 0.05). E: proposed model of the effects of pyruvate on C2C12 metabolism. Elevated pyruvate leads to phosphorylation of PDH, suppression of PFK, and reduced GLUT4 and CPT-1 content. Cumulatively, this results in reduced substrate flux through the TCA cycle and suppression of PGC1α. ACCβ, acetyl-CoA carboxylase-β. F: reversal of chronic pyruvate phenotype following the addition of DCA and glutamine. DCA and glutamine addition increases PGC1α expression and GLUT4 and CPT-1 content and alleviates the effect of pyruvate, presumably via increased TCA cycle flux.
Table 1.
Nucleotide concentration following 3 days of treatment
| NaCl | Pyruvate | Pyr + DCA | Pyr + DCA + Gln | |
|---|---|---|---|---|
| NAD, ng/mg protein | 78.7 ± 11.82 | 46.8 ± 4.13 | 82.0 ± 5.33† | 81.4 ± 6.67† |
| NADH, ng/mg protein | 5.0 ± 1.72 | 5.1 ± 0.73 | 7.7 ± 0.15 | 25.6 ± 0.27*†‡ |
| NAD:NADH | 16.45 ± 1.72 | 9.3 ± 0.56* | 10.7 ± 0.66* | 3.2 ± 0.26*†‡ |
| ATP, nmol/mg protein | 28.8 ± 1.4 | 22.5 ± 1.24* | 23.5 ± 1.2 | 27.4 ± 1.6 |
| ADP, nmol/mg protein | 2.5 ± 0.16 | 1.7 ± 0.05 | 1.85 ± 0.14 | 3.2 ± 0.32†‡ |
| ADP:ATP | 0.085 ± 0.003 | 0.079 ± 0.002 | 0.078 ± 0.002 | 0.115 ± 0.006*†‡ |
Values are means ± SE for n = 3. Data were consistent across two replicates. Gln, glutamine.
Different from NaCl control,
different from pyruvate (Pyr),
different from Pyr + dichloroacetate (DCA): P < 0.05.
To begin to address how pyruvate might be exerting its affects on substrate regulation, the phosphorylation of PDH, the protein content of MCD, and the activity of SirT1 were determined. Phosphorylation of PDH was increased by pyruvate treatment (Fig. 7B), reduced to basal levels by DCA, and elevated when pyruvate, glutamine, and DCA were added together. MCD protein content was decreased (Fig. 7C) by all of the treatments. Finally, pyruvate treatment decreased the activity of SirT1. Activity remained suppressed with the addition of DCA and glutamine despite recovery of substrate transport capacity and enhanced PGC1α expression (Fig. 7D).
DISCUSSION
The principal finding of the present study was that prolonged exposure of myotubes to supra-physiological levels of pyruvate resulted in decreased glucose and palmitate uptake and suppressed oxygen consumption in spite of an increase in select mitochondrial proteins and fatty acid oxidation enzymes. These metabolic changes were associated with decreased expression of the transcriptional coactivator PGC1α, resulting in a phenotype reminiscent of Type 2 diabetes. This metabolic milieu was reversed by increasing pyruvate entry into the TCA cycle using DCA and glutamine, suggesting that TCA flux might control PGC1α expression and the metabolic state of muscle (Fig. 7, E and F).
Wilson et al. (31) demonstrated that pyruvate induced limited mitochondrial biogenesis in C2C12 myoblasts in a PGC1α-independent manner. They reached this conclusion after determining mitochondrial mass with Mito Tracker Green, a probe that is a partially selective label of mitochondrial proteins and measuring cytochrome c and complex I, II, III, and V protein. Interestingly, they showed that only complex I and III proteins and cytochrome c were increased. We have extended this work to show that even though chronic pyruvate treatment did increase select mitochondrial proteins, this did not improve the functional capacity of the cells. The difference between the studies may be the result of a difference between the myoblasts used in the previous work and the myotubes used in the current study. However, another explanation is that the Mito Tracker Green binds to component of the mitochondria that is increased by pyruvate treatment such as cytochrome c, or a member of complex I or III, and this is not sufficient to increase oxidative capacity. The current work supports Wilson et al. (31) in that the selective increase in mitochondrial proteins following pyruvate treatment occurs in a PGC1α-independent manner. In both studies, PGC1α mRNA decreased with pyruvate treatment. Consistent with the increase in cytochrome c shown by Wilson et al. (31), we also see the increase in cytochrome c. The increase in cytochrome c is likely due to the increase in the PGC1α-related coactivator with chronic pyruvate treatment. PRC is the third member of the PGC1α family and is characterized by its structural similarity to PGC1α (1). PRC controls cytochrome c levels (29) and can induce mitochondrial biogenesis in HeLa cells via interaction with nuclear respiratory factor 1 (NRF-1)/cAMP-response element-binding protein and NRF-2/GA-binding protein, respectively (27). Furthermore, short hairpin RNA knockdown of PRC induces mitochondrial deficiency (28). In the present study, PGC1α and -β (data not shown) were suppressed following pyruvate treatment, whereas PRC expression increased 2.9-fold. Preliminary experiments in our laboratory suggest that PRC gain of function can increase respiratory subunit content and cell respiration in C2C12 myotubes (Philp A and Baar K, unpublished observations), indicating a role for PRC in skeletal muscle mitochondrial regulation. The fact that restoration of PGC1α decreased PRC suggests an inverse relationship between PRC and PGC1α. That PRC compensates for the loss of PGC1α following pyruvate treatment and can increase select respiratory chain mRNA suggests that PRC may mediate mitochondrial biogenesis independent of PGC1α (31) or during PGC1α deletion (17). Clearly, further investigation is required to examine the relationship between PRC and PGC1α in skeletal muscle.
Supraphysiological levels of pyruvate can directly suppress PGC1α (Fig. 4D), adding pyruvate to a growing list of metabolic substrates that affect PGC1α when in excess. PGC1α is also suppressed by high saturated lipid concentrations (6), hyperglycemia (22), and high fructose (16). Taken together, these studies suggest that substrate excess leads to the development of insulin resistance, potentially via decreases in PGC1α.
As a point of convergence for cellular substrate stores, flux through the TCA cycle is a key determinant of the metabolic state of muscle. In times of altered metabolic homeostasis, such as muscle contraction, caloric restriction, or surplus nutrient supply, substrate utilization can be adjusted (i.e., shifting from free fatty acid towards CHO utilization or vice versa) to maintain a balance between ATP demand and production. This substrate flexibility is maintained only over short durations (i.e., minutes to hours). When the imbalance is maintained for prolonged periods (hours to days), such as during nutrient excess, metabolic flexibility is lost. The data presented in this study clearly show that chronic, high levels of pyruvate present another form of nutrient excess. As with other forms of nutrient excess, pyruvate can decrease cellular NAD and ATP production (Table 1) and the expression of PGC1α (Fig. 4) and cause widespread alterations in substrate utilization.
Nutrient buildup is ultimately neutralized by oxidizing the nutrient in the TCA cycle. With this in mind, we examined whether increasing pyruvate entry into the TCA cycle could reduce the pyruvate-induced metabolic impairment. Activation of pyruvate dehydrogenase via DCA administration returned basal and insulin-stimulated glucose uptake to normal and rescued the suppression of PGC1α mRNA by pyruvate. Further increasing TCA cycle flux with the anaplerotic amino acid glutamine induced a fourfold increase in glucose uptake, enhanced insulin sensitivity, increased CPT-1, increased palmitate uptake, increased oxygen consumption, and elevated NAD content despite maintained NADH levels. Interestingly, the increased entry of substrate into the TCA cycle also increased expression of PGC1α, which may have coordinated the functional and mitochondrial changes observed with pyruvate, DCA, and glutamine. Koves et al. (14) have previously suggested that an increase in PGC1α could be a key target for therapeutic interventions because this transcriptional coactivator can induce expression of genes involved in lipid and glucose metabolism. However, it is important to note that even though PGC1α mRNA increased with the addition of the anaplerotic agents, and this is a good indicator of PGC1α activity, we did not see an increase in PGC1α protein compared with the NaCl controls, raising the possibility that PGC1α is not mediating the metabolic recovery. To our knowledge, this is the first investigation to specifically attempt to manipulate TCA flux to alleviate mitochondrial substrate saturation, although the feasibility of this concept has been discussed recently in the literature (30). It will be interesting to see whether strategies aimed at increasing substrate flux through the TCA cycle, such as promoting anaplerosis, can be a beneficial strategy for reducing mitochondrial substrate overload in models of insulin resistance.
In conclusion, we have demonstrated that increasing cellular pyruvate concentrations has profound effects on substrate partitioning, utilization, and transcriptional coactivator expression. This phenotype was reversed by the addition of anaplerotic agents that promote TCA cycle flux. Anaplerosis increased basal and insulin stimulated glucose uptake as well as basal oxygen consumption. Our data would therefore suggest that PGC1α regulation is sensitive to substrate flux through the TCA cycle, and that strategies aimed at increasing TCA flux may be effective in treating nutrient-induced insulin resistance.
GRANTS
This work was supported by the Engineering and Physical Sciences Research Council (EP/E008925/1) and the Wellcome Trust (077426/Z/05/Z).
DISCLOSURES
No conflicts of interest, financial or otherwise, are declared by the authors.
ACKNOWLEDGMENTS
The authors thank Ashleigh Evans, Matthew Mackenzie, Alastair Khodabukus, Cara Martin, Kerr Brogan, Kevin Green, and Leonie Wood for excellent technical assistance throughout the course of the study. We also acknowledge Prof. Grahame Hardie (Univ. of Dundee) for the generous donation of antibodies and reagents, and Dr. Hari Hundal (Univ. of Dundee) for help with the glucose and palmitate turnover procedures.
REFERENCES
- 1.Andersson U, Scarpulla RC. Pgc-1-related coactivator, a novel, serum-inducible coactivator of nuclear respiratory factor 1-dependent transcription in mammalian cells. Mol Cell Biol 21: 3738–3749, 2001 [DOI] [PMC free article] [PubMed] [Google Scholar]
- 2.Baar K. Involvement of PPAR gamma co-activator-1, nuclear respiratory factors 1 and 2, and PPAR alpha in the adaptive response to endurance exercise. Proc Nutr Soc 63: 269–273, 2004 [DOI] [PubMed] [Google Scholar]
- 3.Baar K, Wende AR, Jones TE, Marison M, Nolte LA, Chen M, Kelly DP, Holloszy JO. Adaptations of skeletal muscle to exercise: rapid increase in the transcriptional coactivator PGC-1. FASEB J 16: 1879–1886, 2002 [DOI] [PubMed] [Google Scholar]
- 4.Calvo J, Daniels T, Wang X, Paul A, Lin J, Spiegelman B, Stevenson S, Rangwala S. Muscle-specific expression of PPARγ coactivator-1α improves exercise performance and increases peak oxygen uptake. J Appl Physiol 104: 1304–1312, 2008 [DOI] [PubMed] [Google Scholar]
- 5.Coll T, Jové M, Rodriguez-Calvo R, Eyre E, Palomer X, Sanchez RM, Merlos M, Laguna JC, Vazquez-Carrera M. Palmitate-mediated downregulation of peroxisome proliferator-activated receptor-gamma coactivator 1alpha in skeletal muscle cells involves MEK1/2 and nuclear factor-kappaB activation. Diabetes 55: 2779–2787, 2006. [DOI] [PubMed] [Google Scholar]
- 6.Crunkhorn S, Dearie F, Mantzoros C, Gami H, da Silva WS, Espinoza D, Faucette R, Barry K, Bianco AC, Patti ME. Peroxisome proliferator activator receptor gamma coactivator-1 expression is reduced in obesity: potential pathogenic role of saturated fatty acids and p38 mitogen-activated protein kinase activation. J Biol Chem 282: 15439–15450, 2007 [DOI] [PubMed] [Google Scholar]
- 7.Dimopoulos N, Watson M, Green C, Hundal HS. The PPARdelta agonist, GW501516, promotes fatty acid oxidation but has no direct effect on glucose utilisation or insulin sensitivity in rat L6 skeletal muscle cells. FEBS Lett 581: 4743–4748, 2007 [DOI] [PubMed] [Google Scholar]
- 8.Fogarty S, Hawley SA, Green KA, Saner N, Mustard KJ, Hardie DG. Calmodulin-dependent protein kinase kinase-beta activates AMPK without forming a stable complex: synergistic effects of Ca2+ and AMP. Biochem J 426: 109–118, 2010 [DOI] [PMC free article] [PubMed] [Google Scholar]
- 9.Fulco M, Cen Y, Zhao P, Hoffman EP, McBurney MW, Sauve AA, Sartorelli V. Glucose restriction inhibits skeletal myoblast differentiation by activating SIRT1 through AMPK-mediated regulation of Nampt. Dev Cell 14: 661–673, 2008 [DOI] [PMC free article] [PubMed] [Google Scholar]
- 10.Handschin C, Chin S, Li P, Liu F, Maratos-Flier E, Lebrasseur N, Yan Z, Spiegelman B. Skeletal muscle fiber-type switching, exercise intolerance, and myopathy in PGC-1alpha muscle-specific knock-out animals. J Biol Chem 282: 30014–30021, 2007 [DOI] [PubMed] [Google Scholar]
- 11.Handschin C, Spiegelman B. The role of exercise and PGC1alpha in inflammation and chronic disease. Nature 454: 463–469, 2008 [DOI] [PMC free article] [PubMed] [Google Scholar]
- 12.Hashimoto T, Hussien R, Oommen S, Gohil K, Brooks GA. Lactate sensitive transcription factor network in L6 cells: activation of MCT1 and mitochondrial biogenesis. FASEB J 21: 2602–2612, 2007. [DOI] [PubMed] [Google Scholar]
- 13.Holloszy JO. Skeletal muscle “mitochondrial deficiency” does not mediate insulin resistance. Am J Clin Nutr 89: S463–S466, 2009 [DOI] [PubMed] [Google Scholar]
- 14.Koves TR, Li P, An J, Akimoto T, Slentz D, Ilkayeva O, Dohm GL, Yan Z, Newgard CB, Muoio DM. Peroxisome proliferator-activated receptor-gamma co-activator 1alpha-mediated metabolic remodeling of skeletal myocytes mimics exercise training and reverses lipid-induced mitochondrial inefficiency. J Biol Chem 280: 33588–33598, 2005. [DOI] [PubMed] [Google Scholar]
- 15.Kraft C, LeMoine C, Lyons C, Michaud D, Mueller C, Moyes C. Control of mitochondrial biogenesis during myogenesis. Am J Physiol Cell Physiol 290: C1119–C1127, 2006 [DOI] [PubMed] [Google Scholar]
- 16.Le KA, Faeh D, Stettler R, Debard C, Loizon E, Vidal H, Boesch C, Ravussin E, Tappy L. Effects of four-week high-fructose diet on gene expression in skeletal muscle of healthy men. Diabetes Metab 34: 82–85, 2008 [DOI] [PubMed] [Google Scholar]
- 17.Leick L, Wojtaszewski JF, Johansen ST, Kiilerich K, Comes G, Hellsten Y, Hidalgo J, Pilegaard H. PGC-1α is not mandatory for exercise- and training-induced adaptive gene responses in mouse skeletal muscle. Am J Physiol Endocrinol Metab 294: E463–E474, 2008 [DOI] [PubMed] [Google Scholar]
- 18.Lin J, Wu H, Tarr PT, Zhang CY, Wu Z, Boss O, Michael LF, Puigserver P, Isotani E, Olson EN, Lowell BB, Bassel-Duby R, Spiegelman BM. Transcriptional co-activator PGC-1 alpha drives the formation of slow-twitch muscle fibres. Nature 418: 797–801, 2002 [DOI] [PubMed] [Google Scholar]
- 19.McGee S, Howlett K, Starkie R, Cameron-Smith D, Kemp B, Hargreaves M. Exercise increases nuclear AMPK alpha2 in human skeletal muscle. Diabetes 52: 926–928, 2003 [DOI] [PubMed] [Google Scholar]
- 20.Mootha VK, Lindgren CM, Eriksson KF, Subramanian A, Sihag S, Lehar J, Puigserver P, Carlsson E, Ridderstrale M, Laurila E, Houstis N, Daly MJ, Patterson N, Mesirov JP, Golub TR, Tamayo P, Spiegelman B, Lander ES, Hirschhorn JN, Altshuler D, Groop LC. PGC-1alpha-responsive genes involved in oxidative phosphorylation are coordinately downregulated in human diabetes. Nat Genet 34: 267–273, 2003 [DOI] [PubMed] [Google Scholar]
- 21.Morris RT, Laye MJ, Lees SJ, Rector RS, Thyfault JP, Booth FW. Exercise-induced attenuation of obesity, hyperinsulinemia, and skeletal muscle lipid peroxidation in the OLETF rat. J Appl Physiol 104: 708–715, 2008 [DOI] [PubMed] [Google Scholar]
- 22.Pagel-Langenickel I, Bao J, Joseph J, Schwartz D, Mantell B, Xu X, Raghavachari N, Sack M. PGC-1alpha integrates insulin signaling, mitochondrial regulation, and bioenergetic function in skeletal muscle. J Biol Chem 283: 22464–22472, 2008 [DOI] [PMC free article] [PubMed] [Google Scholar]
- 23.Petersen K, Shulman G. Etiology of insulin resistance. Am J Med 119: S10–S16, 2006 [DOI] [PMC free article] [PubMed] [Google Scholar]
- 24.Pilegaard H, Saltin B, Neufer PD. Exercise induces transient transcriptional activation of the PGC-1alpha gene in human skeletal muscle. J Physiol 546: 851–858, 2003 [DOI] [PMC free article] [PubMed] [Google Scholar]
- 25.Scarpulla R. Transcriptional paradigms in mammalian mitochondrial biogenesis and function. Physiol Rev 88: 611–638, 2008 [DOI] [PubMed] [Google Scholar]
- 26.Suchankova G, Nelson L, Gerhart-Hines Z, Kelly M, Gauthier M, Saha A, Ido Y, Puigserver P, Ruderman N. Concurrent regulation of AMP-activated protein kinase and SirT1 in mammalian cells. Biochem Biophys Res Commun 378: 836–841, 2009 [DOI] [PMC free article] [PubMed] [Google Scholar]
- 27.Vercauteren K, Gleyzer N, Scarpulla R. PGC-1-related coactivator complexes with HCF-1 and NRF-2beta in mediating NRF-2(GABP)-dependent respiratory gene expression. J Biol Chem 283: 12102–12111, 2008 [DOI] [PMC free article] [PubMed] [Google Scholar]
- 28.Vercauteren K, Gleyzer N, Scarpulla R. Short hairpin RNA-mediated silencing of PRC (PGC-1-related coactivator) results in a severe respiratory chain deficiency associated with the proliferation of aberrant mitochondria. J Biol Chem 284: 2307–2319, 2009 [DOI] [PMC free article] [PubMed] [Google Scholar]
- 29.Vercauteren K, Pasko R, Gleyzer N, Marino V, Scarpulla R. PGC-1-related coactivator: immediate early expression and characterization of a CREB/NRF-1 binding domain associated with cytochrome c promoter occupancy and respiratory growth. Mol Cell Biol 20: 7409–7419, 2006 [DOI] [PMC free article] [PubMed] [Google Scholar]
- 30.Watt M, Hevener A. Fluxing the mitochondria to insulin resistance. Cell Metab 7: 5–6, 2008 [DOI] [PubMed] [Google Scholar]
- 31.Wilson L, Yang Q, Szustakowski JD, Gullicksen PS, Halse R. Pyruvate induces mitochondrial biogenesis by a PGC-1 α-independent mechanism. Am J Physiol Cell Physiol 292: C1599–C1605, 2007 [DOI] [PubMed] [Google Scholar]


