

Abstract
High-yield heterologous SERCA1 (Ca2+ ATPase) expression was obtained in COS-1 cells infected with recombinant adenovirus vector (rAdSERCA). Higher transcription and expression were obtained in the presence of a His6 tag at the amino terminus, as compared with a His6 tag at the carboxyl SERCA terminus, or no tag. The expressed protein was targeted extensively to intracellular membranes. Optimal yield of functional Ca2+ ATPase corresponded to 10% of total protein, with phosphoenzyme levels, catalytic turnover and Ca2+ transport identical with those of native SERCA1. This recombinant membrane-bound (detergent-free) enzyme was used for characterization of Ca2+ binding at the two specific transmembrane sites (ATP-free) by measurements of net charge transfer upon Ca2+ binding to the protein, yielding cooperative isotherms (K1=5.9±0.5×10⁵ M−1 and K2=5.7± 0.3×10⁶ M−1). Non-cooperative binding of only one Ca2+, and loss of ATPase activation, were observed following E309 mutation at site II. On the other hand, as a consequence of the site II mutation, the affinity of site I for Ca2+ was increased (K=4.4±0.2×10⁶ M−1). This change was due to a pKa shift of site I acidic residues, and to contributions of oxygen functions from empty site II to Ca2+ binding at site I. No charge movement was observed following E771Q mutation at site I, indicating no Ca2+ binding to either site. Therefore, calcium occupancy of site I is required to trigger cooperative binding to site II and catalytic activation. In the presence of millimolar Mg2+, the charge movement upon addition of Ca2+ to WT ATPase was reduced by 50%, while it was reduced by 90% when Ca2+ was added to the E309Q/A mutants, demonstrating that competitive Mg2+ binding can occur at site I but not at site II.
Keywords: Ca2+ ATPase mutants, Ca2+ binding, charge transfer, heterologous expression, SERCA1
Introduction
The sarco(endo)plasmic reticulum ATPase (SERCA) is required for active transport of Ca2+ into intracellular stores, whereby Ca2+ is available for passive release and signaling functions. The SERCA1 iso-form, obtained with sarcoplasmic reticulum (SR) vesicles derived from skeletal muscle, is the best characterized so far. Its sequence comprises 994 amino acids,1 and includes 10 transmembrane helical segments (M1 – M10) and a three domain (A, N and P) headpiece protruding from the cytosolic side of the membrane. The catalytic and transport cycle is activated by calcium binding, allowing transfer of the ATP terminal phosphate to a conserved aspartyl residue (P domain) to form a phosphorylated enzyme intermediate. Conformational isomerization of the phosphoenzyme is followed by vectorial translocation of bound calcium, and the cycle is then completed by hydrolytic cleavage of the phosphoenzyme.2,3
Calcium binding to SERCA1 was first characterized by measurements at equilibrium in the absence of ATP, utilizing a radioactive calcium tracer. The isotherms so derived revealed a binding stoichiometry of two calcium ions per ATPase molecule,4 exhibiting positive cooperativity and a Kapp=2.3×10⁶ M−1, which is consistent with the Ca2+ concentration dependence of ATPase activation. At acid pH, calcium binding occurs in exchange with protons,5 and this exchange continues as the ATPase undergoes catalytic cycles.6 Most importantly, initial work on the transfection of cultured cells and expression of exogenous SERCA cDNA indicated that single side chain mutation of any of six residues (Glu309, Glu771, Asn796, Thr799, Asp800 or Glu908) within the transmembrane region (M4, M5, M6, and M8), interferes with calcium-dependent ATPase activity.7 On the contrary, ATPase phosphorylation with Pi in the reverse direction of the cycle, which is normally inhibited by calcium,8 still occurred in the mutants without undergoing any inhibition by calcium.7 This led to the proposal that the six residues are involved in calcium binding, and that the calcium-binding domain resides within the membrane region.7,9,10 However, direct measurements of calcium binding to the mutants were precluded at that time by the low yield of transfection procedures and SERCA expression. Introduction of viral vectors for efficient delivery of cDNA subsequently allowed sufficient expression and direct demonstration of mutational interference with calcium binding stoichiometry,11 even though the signal was still insufficient for determination of equilibrium isotherms. Meanwhile, crystallization of SERCA1 in the presence of Ca2+ demonstrated two neighboring calcium sites within the transmembrane region (see Discussion),12 and provided an atomic model for the structure of the entire protein. Additional characterization of calcium binding was obtained by measurements of charge movements upon addition of calcium to native SR vesicles adsorbed on an alkanethiol/phospholipid bilayer anchored to a gold electrode, the so-called solid supported membrane (SSM).13 These measurements revealed net charge movements upon Ca2+ binding to the SERCA protein, which may be stoichiometrically equivalent to the Ca2+ bound, or reduced by exchange with other bound cations (i.e., H+).
We report here the development of new constructs and adenoviral vectors, yielding high levels of heterologous expression of SERCA protein. Our studies include comparative transfection and infection experiments, using SERCA1 cDNA with 5′ or 3′ extensions encoding SERCA1 protein with amino or carboxy His6 tags. In fact, these tags were recently shown to have a strong and variable influence on heterologous expression of membrane proteins, depending on the gene of interest.14 We found that the SERCA protein, which is recovered with the microsomal fraction of expression cells infected under optimally selected conditions, exhibits functional properties identical with the native protein. This includes ATPase activity and intermediate reactions, as well as ATP-dependent Ca2+ transport. The membrane-bound (not exposed to detergents) recombinant ATPase obtained under such conditions is suited for adsorption onto SSM and charge transfer measurements. We obtained a detailed characterization of Ca2+ binding to each of the two sites of wild type (WT) and mutant protein, gaining a further understanding of the cooperative binding mechanism, Ca2+/H+ exchange and competitive Mg2+ binding.
Results
Microscopic views of COS-1 cells transfected with plasmid carrying SERCA1 cDNA revealed that the frequency of cells exhibiting SERCA expression (revealed by specific immunostaining, as compared with nuclear stain of all cells) was approximately 15% (Fig. 1, left-hand panel). This indicates that the plasmid transfection efficiency was rather low. On the other hand, evaluation of the recombinant ATPase expression level by Western blots obtained with SERCA1 monoclonal antibodies indicated that the microsomes derived from cells transfected with a 5′ His6 tag (amino terminus tag) yielded significantly higher expression than constructs containing the 3′ His6 tag (carboxyl terminus tag) or no tag at all (not shown).
Fig. 1.
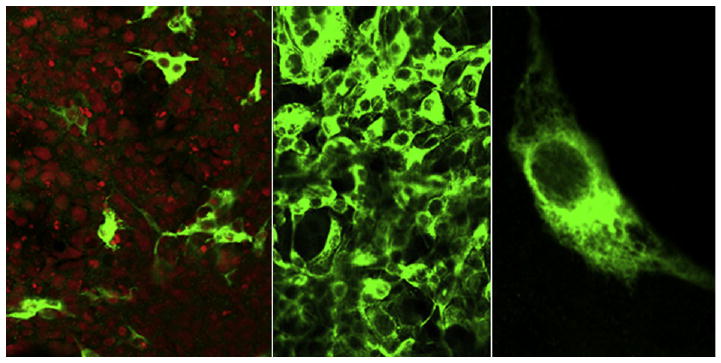
COS-1 cells transfected (left-hand panel) or infected (center panel) with adenovirus vector containing the 5′ His6-tagged SERCA1 cDNA under control of the CMV promoter. Fluorescent immunostaining shows that all cells in wide fields were effectively infected with MOI=10. The level of expression, however, depends on the viral titer (see Fig. 2). Right: Enlarged COS-1 cells showing targeting of the expressed SERCA1 to intracellular membranes.
In contrast with the low efficiency of transfection, infection of COS-1 cells with viral vectors introduces cDNA into all cells in culture. This is clearly demonstrated in the center panel in Fig. 1, showing wide fields of cells infected with a multiplicity of infection (MOI) of 10. These viral levels were selected on the basis of preliminary MOI curves, used to determine infection efficiency (i.e., percentage of cells infected) as a function of viral titer. It is important to realize that since the viral vector does not replicate in COS-1 cells, the expression level is still dependent on the viral titer (MOI) even when all cells are infected. The intracellular membrane targeting of the expressed SERCA is demonstrated in the right-hand panel in Fig. 1.
The high levels of expressed SERCA1 protein are demonstrated by electrophoretic analysis of microsomes derived from infected cells. Considering that the quantity of SR protein placed in lanes 2 and 6 in Fig. 2 is 10-fold lower than the microsomal protein placed in lanes 3 and 7, and in lanes 4 and 8, quantitative assessment of the Western blots chemiluminescence signal indicates that the recombinant ATPase content of microsomes of COS-1 cells infected with high (MOI=50) or low (MOI=10) titer of 5′ His6-tagged (amino terminus) viral constructs correspond to 14.1% and 5.7 %, respectively, as compared to the ATPase content of native SR vesicles. Since both these viral titers are sufficient to deliver cDNA to all cells in culture, it is clear that the level of expression depends on the number of viral vectors entering each cell. In fact, contrary to the transfected plasmids, viral vectors do not replicate in the infected COS-1 cells.
Fig. 2.
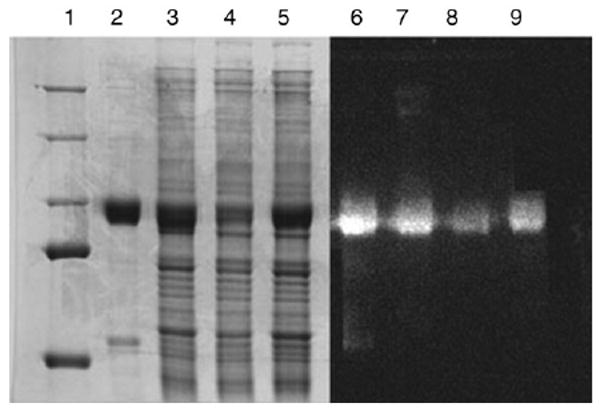
Heterologous expression of SERCA1 following infections of COS-1 cells. Lanes 2 and 6, protein staining of the electrophoretic gels and Western blots with 2.0 μg of LSR protein. Lanes 3 and 7, microsomal protein (20 μg) of COS-1 cells infected (MOI=50) with adenovirus vector containing 5′ His6-tagged (amino terminus) SERCA cDNA. Lanes 4 and 8, microsomal protein (20 μg) of COS-1 cells infected (MOI=10) with adenovirus vector containing 5′ His6-tagged (amino terminus) SERCA cDNA,. Lanes 5 and 9, microsomal protein (20 μg) of COS-1 cells infected (MOI=50) with adenovirus vector containing 3′ His6-tagged (carboxyl terminus) SERCA cDNA,. Lane 1, molecular mass standards.
Comparative assessment of chemiluminescence in the same gels (Fig. 2) indicated that the recombinant ATPase content of microsomes of COS-1 cells infected with high (MOI=50) titer of 3′ His6-tagged (carboxyl terminus) viral constructs corresponds to 8.85 %, as compared to the ATPase content of native SR vesicles. This is lower than the level obtained with the same MOI of 5′ His6-tagged constructs, and indicates again that the 5′ tag increases transcription and/or expression of the heterologous SERCA cDNA.
Evaluation of transcription levels
In order to evaluate whether the higher expression obtained with SERCA constructs containing the 5′ His6 tag (amino terminus tag) was due to transcriptional enhancement, we made real time RT-PCR measurements and obtained values (normalized to β-actin) of 1.63 for the 5′ tagged, and 0.90 for the 3′ tagged SERCA, relative to 1.0 for non-tagged SERCA (Fig. 3). Statistical significance (set at P<0.05) was evaluated by one-way ANOVA with Tukey's HSD post hoc test, demonstrating P<0.0001 for the difference between the 5′ tagged SERCA and the 3′ tagged SERCA or non-tagged SERCA. In addition, we obtained the Northern blots shown in Fig. 3, yielding chemiluminescence density levels of 1.9 for the 5′ tagged, and 0.90 for the 3′ tagged SERCA, relative to non-tagged SERCA and normalized with β-actin.
Fig. 3.
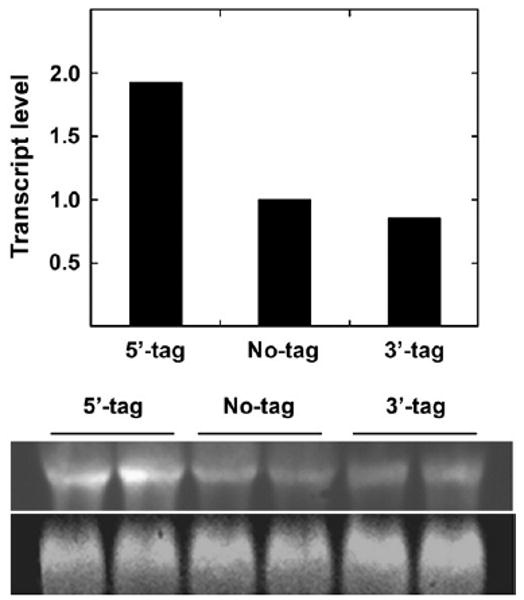
Northern blots. Total RNA was subjected to electrophoresis as described in Materials and Methods. The lower gel shows signals obtained with the β-actin probe, while the upper gel shows signals obtained with the SERCA probe. The columns show the normalized chemiluminescence for 5′ (N-tag), no-tag and 3′ (C-tag), corrected by the corresponding β-actin chemiluminescence.
ATPase and Ca2+ transport activities
Fig. 4a shows that addition of [γ-32P]ATP to LSR (native sarcoplasmic reticulum vesicles) in the presence of saturating Ca2+ yields a phosphorylated enzyme intermediate (EP) reaching steady-state levels of 4.4 nmol/mg protein, consistent with the levels obtained earlier in our own and several other laboratories. Most importantly, the C terminus tagged recombinant ATPase yields EP levels of 0.65 nmol/mg microsomal protein. A correction based on the recombinant ATPase content of these microsomes (8.5% as compared with LSR), yields a level of 7.3 nmol EP/mg protein, which is as good or higher than that obtained with LSR. The EP levels obtained with the microsomes of COS-1 cells infected with a low (MOI=10) or high (MOI=50) titer of 5′ (amino terminus) tagged viral constructs were 0.41 and 0.06 nmol EP/mg microsomal protein, respectively (Fig. 4a). A correction based on the recombinant ATPase content of these microsomes (5.7 % and 14.1 %, respectively, as compared with LSR), yields a level of 7.2 and 0.43 nmol EP/mg protein. The values indicate very good function for the protein obtained through infection with a low viral titer, but quite poor function for the protein obtained with the high titer of the 5′ tagged constructs. Similar results were obtained for steady-state ATPase activity (Fig. 4b), yielding 5.0 μmol min mg−1 LSR protein (at 37 °C), corrected values of 6.1 for carboxyl tagged protein (MOI=50), and 4.4 (MOI=10) and 0.18 for amino terminus tagged protein (MOI=50).
Fig. 4.
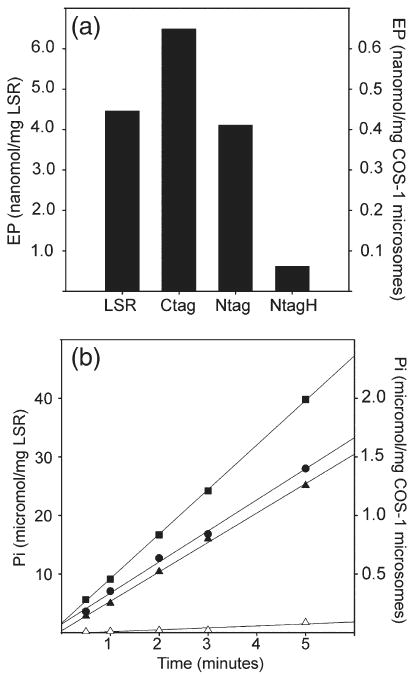
Phosphoenzyme intermediate (a) and ATPase activity (b) of microsomes obtained from infected COS-1 cells. Infection was performed with adenovirus vector containing 3′ His6-tagged (Ctag: MOI=50), or 5′ His6-tagged (Ntag: MOI=10; NtagH, MOI=50) SERCA-1 cDNA. Microsomes of infected cells (50 μg/ml) are compared with LSR protein (50 μg/ml). ATPase activity: (●) LSR; (■) Ctag; (▲) Ntag; and (Δ) NtagH.
Addition of ATP to LSR vesicles in the presence of saturating Ca2+ is followed by a high rate of Ca2+ transport. We found that Ca2+ transport by microsomes obtained from infected COS-1 sustain ATP-dependent calcium transport, but at lower velocity, consistent with the ATPase content of the total microsomal protein. In fact, correction of the observed transport velocities, based on the recombinant ATPase content of the microsomes as compared with LSR, yields 1.3 and 1.6 μmol min mg−1 for the C terminus and N terminus (low viral titer) tagged recombinant ATPase, which are quite comparable to the initial transport velocity sustained by LSR (1.25 μmol min mg−1 protein). On the other hand, N terminus tagged ATPase obtained through high titer infection exhibits a very low activity, which was negligible even when corrected by the level of expression. These results are consistent with the EP and ATPase measurements (Fig. 4), indicating that the carboxyl terminus tagged protein has functional properties identical with those of the LSR ATPase. The amino terminus tagged protein has functional properties identical with those of the LSR ATPase when obtained through low titer viral infections, but nearly complete absence of function when obtained through high titer viral infections (see Discussion). As opposed to the WT enzyme, no catalytic or transport activity was found in recombinant E771Q (Ca2+ binding site I), E309Q or A (Ca2+ binding site II), or D351N (phosphorylation site) mutants.
The overall evaluation of methods for heterologous SERCA expression and functional characterization of expressed protein indicates that, under optimally selected conditions, it is possible to obtain recombinant ATPase with a yield of 5–10% of the SERCA level in native LSR vesicles. The recombinant ATPase molecules are membrane bound (not exposed to detergents), sustaining catalytic turnover and transport activity comparable to those sustained by native ATPase molecules. Recombinant ATPase obtained under these conditions is suited to adsorption onto an SSM and characterization of Ca2+ binding by measurements of net charge movements (i.e., current transients).
Characterization of Ca2+ binding by measurements of current transients
Earlier, we reported the occurrence of current transients following Ca2+ concentration jumps on native SERCA protein adsorbed onto an SSM.13 The charge obtained by numerical integration of charge movements at neutral pH is attributed to electrogenic events corresponding to Ca2+ binding in the absence of ATP. In fact, the cooperative behavior of the charge obtained by varying the concentration of added Ca2+, as well as the high affinity for Ca2+, match direct measurements of calcium binding by isotopic tracer, demonstrating that the observed electrogenic events are related to Ca2+ binding to the two activation and transport sites of the Ca-ATPase.
The high yield of recombinant Ca-ATPase allowed studies on the effects of site directed mutations on signals produced by Ca2+ concentration jumps. In particular, when measurements of charge movements are done with recombinant SERCA protein, we find that a charge movement is generated following Ca2+ addition to the E309Q mutant, while no charge movement was observed following Ca2+ addition to the E771Q mutant (Fig. 5). This is in agreement with previous direct measurements with isotopic tracer, indicating total loss of binding following Glu771 mutation in site I, and residual binding of a single Ca2+ (to site I) following Glu309 mutation in site II.11 Most importantly, due to improved yield of expressed protein and the favorable signal-to-noise ratio of the current transients, we are now able to obtain full binding isotherms with much less experimental scatter.
Fig. 5.
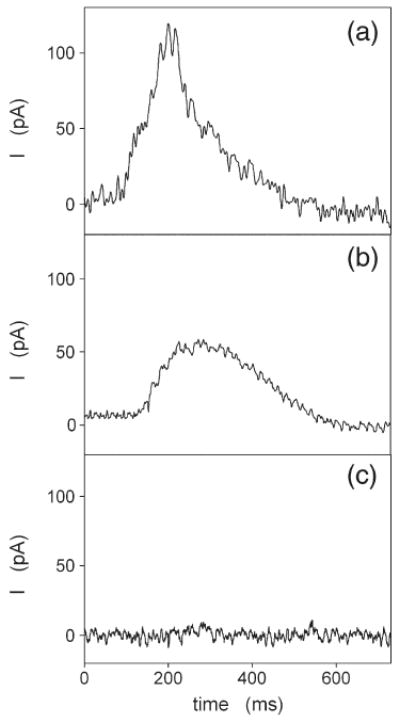
Current transients induced by a concentration jump of 10 μM free Ca2+ in the absence of ATP at pH 7.0. (a) WT Ca-ATPase; (b) E309Q mutant; and (c) E771Q mutant.
Figure 6 reports the moved charge following Ca2+ concentration jumps as a function of the concentration of free Ca2+ in the case of WT Ca-ATPase and the E309Q mutant. The desired concentration of free Ca2+ was obtained with a Ca2+/EGTA buffer. In particular, the charges at various concentrations of Ca2+ were normalized with respect to the maximum charge attained at saturating Ca2+. Figure 6 shows that the cooperative behavior of Ca2+ binding to WT protein is lost following the Glu309 mutation. This is again consistent with direct binding measurements obtained earlier,15 even though the accuracy of those measurements was limited by an unfavorable signal-to-noise ratio. In fact, we can now fit the charge produced by binding of Ca2+ to E309Q mutant reliably, using a single-site binding equation:4,16
Fig. 6.
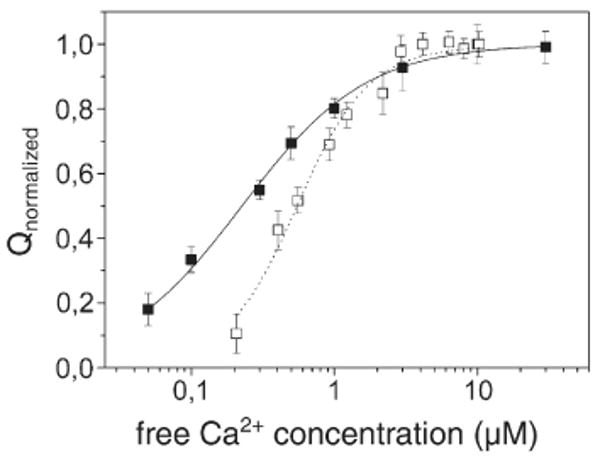
Dependence of the charge after concentration jumps of free Ca2+: filled squares, E309Q mutant; open squares, WT Ca-ATPase. The concentration of free Ca2+ was obtained with a Ca2+/EGTA buffer. The charges are normalized with respect to the maximum charge observed at saturating Ca2+. The continuous and dotted lines represent fitting curves of the experimental data by Eqs. (1) and (2), respectively: K=4.4±0.2×10⁶ M−1 (E309Q mutant); K1=5.9±0.5×10⁵ M−1, and K2=5.7±0.3×10⁶ M−1 (WT Ca-ATPase).
| (1) |
where K=4.4±0.2×10⁶ M−1. The charges generated by Ca2+ jumps on the E309Q mutant were also fit by the Hill equation, yielding a K0.5=0.23±0.01 μM and a cooperativity coefficient n=0.94±0.04, consistent with non-cooperative Ca2+ binding. On the other hand, fitting the charge obtained upon addition of Ca2+ to the WT protein requires a two interacting sites binding equation:4,16
| (2) |
It is worth mentioning that Eq. (2) requires the minimum number of binding sites for a good fitting of the experimental data. In fact, the best fitting (minimal scatter) of Eq. (2) to the measured charges yields two association constants:
which is lower than the K found for site I in the E309Q mutant; and
A statistical verification of the validity and significance of the two binding constants is provided in the Appendix. Furthermore, a high cooperativity coefficient, n=1.7±0.1, was obtained by fitting the charges produced upon Ca2+ binding to the WT enzyme with the Hill equation, which also provided a K0.5=0.55±0.03 μM. It should be pointed out that the Hill equation, which is widely used for biochemical characterization, is less informative than Eq. (2), since it does not provide any information about the number of binding sites. On the other hand, by fitting Eq. (2) to the measured charges, the intrinsic binding constants of the two sites, K1 and K2, were obtained, corresponding to the intrinsic association constants for each of the two sites demonstrated by biochemical determination of calcium and ATPase stoichiometry, as well as by structural analysis.
An additional observation of interest is related to the pH-dependence of charge movements, as shown in Fig. 7, where the charge induced by Ca2+ concentration jumps is plotted as a function of pH in the case of WT Ca-ATPase, and the D351N, E309A and E309Q mutants. In particular, charge measurements with WT protein show that the net charge decreases as the pH is lowered from 7.0 to 6.0, as a consequence of increased H+ occupancy of acidic residues and partial neutralization of net charge by H+ release upon Ca2+ binding. We find that following Glu309 mutation (either to Gln or Ala), the pH range for net charge reduction is displaced, exhibiting a maximal level at pH 8 and a minimal level at pH 7.0. This suggests a change in local environment and a pKa rise for residues involved in Ca2+ binding at site I, as a consequence of the Glu309 mutation in the neighboring site II. This effect is not observed following mutation of Asp351, the residue undergoing phosphorylation by ATP at the catalytic site.
Fig. 7.
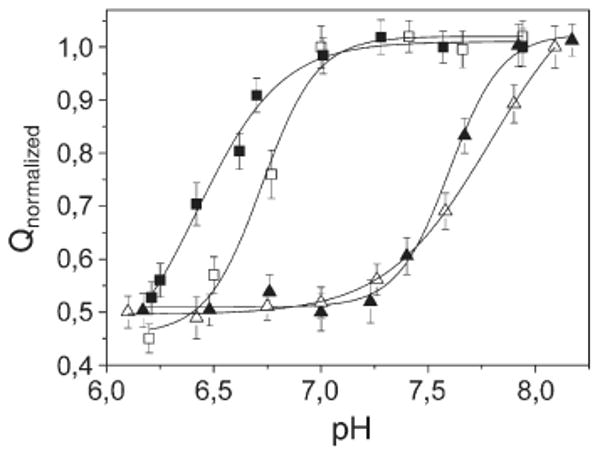
Dependence of the normalized charge after saturating Ca2+ concentration jumps on pH: WT Ca-ATPase (filled squares), D351N (open squares), E309A (filled triangles) and E309Q mutants (open triangles). In each curve, the charges are normalized with respect to the maximum charge attained at alkaline pH. The continuous lines represent fitting curve of the experimental data by a Hill function: pKa=6.4±0.1 (WT Ca-ATPase), 6.72±0.04 (D351N), 7.60±0.02 (E309A), 7.79±0.03 (E309Q).
The electrical measurements were then extended to study the effect of Mg2+, since Mg2+ competition with Ca2+ has been observed under certain conditions.17,18 Figure 8a shows the charge after saturating Ca2+ concentration jumps at different pH values as a function of the concentration of Mg2+ in the case of WT Ca-ATPase. We found that, as the concentration of Mg2+ was increased at pH ≥7, the amount of charge measured upon addition of saturating Ca2+ was reduced to approximately half, relative to the normalized value obtained at the same pH in the presence of lower concentrations of Mg2+. This suggests binding of one Mg2+ to either of the two calcium sites, whereby the net charge produced by binding of two Ca2+ would be partially neutralized by exchange with one bound Mg2+. Most importantly, we observed similar effects of Mg2+ in charge measurements with the E309Q and E309A mutants, as shown in Fig. 8b. In fact, we observed a progressive reduction of net charge movements by increasing the concentration of Mg2+ at pH ≥7. These results clearly indicate that Mg2+ can bind at site I. In this case, however, the pH-dependence was more gradual, consistent with a pKa rise of acidic residues at site I, as demonstrated also in Fig. 7.
Fig. 8.
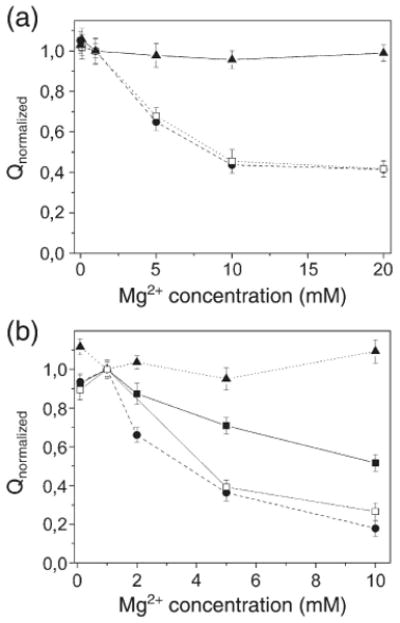
Dependence of the charge after saturating Ca2+ concentration jumps at different pH values on the concentration of Mg2+ in the case of WT Ca-ATPase (a) and E309Q/A mutants (b). (a) pH 6.1 (filled triangles), 7.0 (filled circles) and 7.9 (open squares). (b) The filled symbols refer to measurements of the E309Q mutant at pH 6.1 (filled triangles), 7.0 (filled squares) and 7.9 (filled circles), whereas the open squares refer to measurements of the E309A mutant at pH 7.0. (a and b) The charges are normalized to the charge recorded in the presence of 1 mM Mg2+, and used as the reference. The concentration of free Ca2+ was 30 μM at pH 6.1 and 10 μM at pH 7 and 7.9.
Discussion
Functional and structural characterization of specific effects of site directed mutations requires expression of recombinant protein at levels permitting specific and diverse measurements. Heterologous expression of SERCA1 by transfection of COS-1 cells was obtained originally by Maruyama and MacLennan,19 permitting measurements of Ca2+ transport and ATPase activity with the recombinant protein. The expression levels, however, were not high enough to allow measurements of Ca2+ binding in the absence of ATP, and indirect methods were required to monitor the mutational disruption of Ca2+ binding (Clarke et al. 7). Similar methods were described in great detail by Andersen and Vilsen.10 Furthermore, heterologous SERCA expression was obtained in insect cells for functional studies of membrane-bound enzyme,20,21 as well as in yeast.22 In our laboratory, we achieved significant progress in the level of expression when we introduced adenovirus vectors for delivery of SERCA cDNA to COS-1 cells.11 On the other hand, a recent and extensive study has revealed important effects of purification tags on the levels of expression, depending on their 5′ (amino terminus) or 3′ (carboxyl terminus) placement, and on the gene of interest.14 We have performed a quantitative study of the level of heterologous SERCA1 expression, comparing plasmid transfections and adenovirus vector infections, as well as the effects of tags that may influence the expression level and be helpful in subsequent purification work. We also performed a detailed functional characterization of the expressed protein, with the immediate aim of obtaining a membrane-bound enzyme that retains native functional properties, and is suitable for adsorption onto an SSM.
It is clear that infections with adenovirus vectors are much more efficient for cDNA delivery, as compared with transfections (Figs. 1 and 2). It is noteworthy that the few transfected cells can express a fairly high level of protein, due to amplification of the transfected plasmid under control of the SV40 origin of replication. However, the overall expression is low, due to the limited percentage of cell effectively transfected. On the other hand, the adenovirus vector does not replicate in COS-1 cells; therefore, careful MOI titration must be performed in order to establish the optimal viral titer yielding infection of all cells, as well as the desired level of expression. Furthermore, we found that given the same viral titer, the expression level is significantly higher when a 5′ (amino terminus) His6-tagged SERCA construct was used, as compared with a 3′ (carboxyl terminus) His6-tagged SERCA construct. This difference is apparently due to transcription enhancement (Fig. 3). Unfortunately, high levels of expression (14–15 % relative to the SERCA1 LSR content) obtained with high titers (MOI=50) of adenovirus vectors containing 5′ (amino terminus) tagged SERCA yield mostly inactive protein. This might be due to protein misfolding in the high expression process and/or a limit in intracellular membrane availability for SERCA targeting. Considering the mammalian origin of COS-1 cells, this limit is bound to be of greater concern for expression in non-mammalian cells.
It is of interest that the COS-1 cells are not obviously damaged by viral infection per se, since infections with the high titers of adenovirus vector containing 3′ (carboxyl terminus) tag yield lower, but satisfactory, levels (8–9 % relative to the SERCA1 LSR content) of functional protein. Most importantly, the protein obtained under these conditions is membrane-bound SERCA1 and, in its WT form, sustains catalytic and transport activities identical (mol/mol) with that of the native SERCA1 of LSR vesicles. The presence of the tag will be useful for purification. However, careful work will be needed to maintain native function following exposure to the required detergents. It is noteworthy that exposure to detergents would interfere with the measurements of charge movements described here.
Microsomes containing WT and mutant Ca-ATPase were adsorbed onto an SSM and subjected to Ca2+ concentration jumps through a rapid solution exchange procedure. This method is very sensitive to the small signal produced with our recombinant protein in its membrane-bound state. As reported earlier, the charge measured upon addition of Ca2+ in the absence of ATP to the WT protein is attributed to a charge movement, which corresponds to binding of two Ca2+ to the cytoplasmic transport sites of the ATPase.13 We have now studied the effects of site-directed mutations on charge movements generated by the addition of Ca2+ and, in particular, the dependence of the moved charge on pH and the concentration of Mg2+. For clarity of discussion, an atomic model of the calcium sites structure is presented in Fig. 9.12,23,24
Fig. 9.
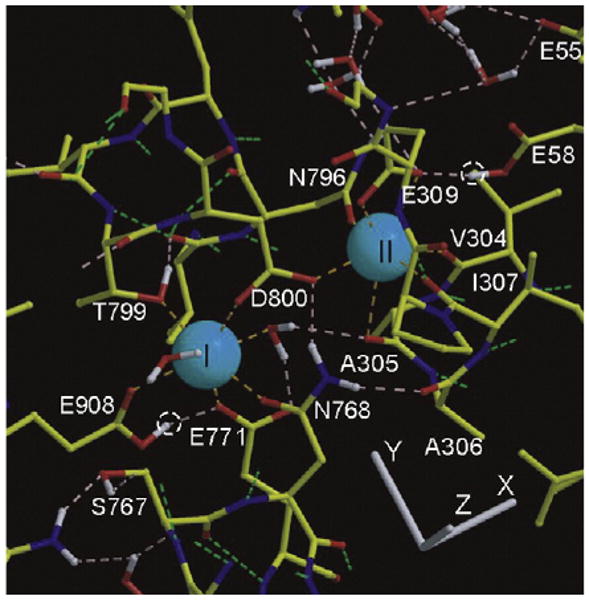
Structural view of the two neighboring Ca2+ sites in the transmembrane region of the Ca2+ ATPase (SERCA1). The two calcium ions are shown as blue spheres. Calcium complexation at site I is obtained with contributions from Asn768 (side chain oxygen), Glu771 (carboxyl oxygen), Thr799 (side chain oxygen), Asp800 (carboxyl and carbonyl oxygen atoms in calcium complexation at sites I and II), Glu908 (carbonyl oxygen, assuming that carboxyl oxygen retains its proton), and two water molecules (small red spheres). Calcium complexation at site II is obtained with contributions from Asn796 (side chain oxygen), Asp800 (carboxyl and carbonyl oxygen atoms at sites I and II), and Glu309 (both side oxygen atoms engaged in capping calcium II). In addition three main chain oxygen atoms (Val304, Ala305, and Ile307) are contributed by the M4 helix, which is partly unwound at the Ile307 and Gly310 level. The white dotted circles show predicted proton occupancy of Glu908 and Glu58 side chains in the calcium-bound state of the enzyme (the figure is derived from Refs. 23 and 24).
In the case of the E309Q mutant, which prevents Ca2+ binding to site II, a current signal was generated by the addition of Ca2+ (Fig. 5). On the other hand, no current signal was observed upon addition of Ca2+ to the E771Q mutant, which prevents binding of both Ca2+ (Fig. 5). These results are consistent with direct binding measurements obtained earlier,11,15 and clearly demonstrate a direct relationship of the charge movements with Ca2+ binding. The lack of binding at both sites following mutation of a single residue on site I demonstrates the requirement for calcium occupancy of site I to trigger the cooperative binding at site II.15 The cooperative linkage may be established, at least in part, through hydrogen bonding between the Glu771, whose carboxyl oxygen is engaged in Ca2+ complexation at site I, and Ala305, whose main chain oxygen interacts with Ca2+ at site II.23
A binding isotherm for the E309Q mutant was obtained with a single-site equation (Eq. (1); Fig. 6), yielding K=4.4±0.2×10⁶ M−1, which indicates the binding affinity of site I for Ca2+. Furthermore, the cooperativity coefficient n is ∼ 1, consistent with non-cooperative Ca2+ binding to a single site. In the case of WT Ca-ATPase, a binding isotherm for two interacting sites (Eq. (2)) is required to fit the charge measured upon addition of Ca2+ (Fig. 6). Fitting Eq. (2) to the measured charges yields two association constants:4,25
The difference of one order of magnitude between these two constants indicates a high degree of cooperativity between the two interacting binding sites, as confirmed by a value of n ∼ 2, resulting in a higher affinity of site II for calcium following occupation of site I. It is interesting that the value of K obtained for site I of the E309Q mutant is higher than the K1 derived for site I of the WT ATPase, suggesting that when binding to site II is prevented by a single mutation, one or two of the oxygen functions normally engaged (most likely that of Asp800) on site II may alternatively contribute to Ca2+ binding on site I. It is clear that occupancy of site I is the trigger for cooperativity, while occupancy of site II has the specific function of catalytic activation,15 followed by transport of two Ca2+ per ATP molecule undergoing hydrolysis. In this connection, it should be mentioned that the plasma membrane Ca-ATPase has only one binding site, corresponding to site II of SR Ca-ATPase, whose occupancy by Ca2+ yields non-cooperative catalytic activation and transport of a single Ca2+ per ATP molecule undergoing hydrolysis.26 We confirm unambiguously that occupancy of site II is required for catalytic activation.15
The pH dependence of charge movements (Fig. 7) for the WT Ca-ATPase shows doubling of the signal intensity as the pH is raised from 6 to 7. The signal intensity does not increase any further beyond pH 7. This variation of net charge movement is related to the H+ stoichiometry available for exchange upon Ca2+ binding. In fact, dissociation of H+ occurs with an apparent pKa value of 6.4, whereby they are unavailable for exchange/competition with Ca2+, as required for charge neutralization.13 For this reason, the affinity for Ca2+ is higher at pH 7 than at pH 6. Interestingly, the pH range for net charge increase is displaced following Glu309 mutation (either to Q or A), exhibiting a minimal level at pH 7.0 and a twofold level at pH 8. Thus, the corresponding pKa values for the E309A and E309Q mutants are 7.6 and 7.8, respectively. Therefore, the pH dependence of the charge measured upon addition of Ca2+ to the E309Q mutant (Fig. 7) suggests an electrostatic mechanism related to a change in local environment and a pKa rise of the acidic residues involved in Ca2+ binding at site I. We conclude that a profound change occurs as a consequence of the Glu309 mutation in the neighboring site II, including a pKa rise of carboxyl groups at site I, and participation of site II oxygen functions in Ca2+ binding at site I (see above).
Recent electrostatic calculations indicate that four acidic residues, Glu771, Asp800, Glu908 and Glu309, could be involved in Ca2+/H+ exchange and countertransport, with the possible exception of Glu908.24,27 As for the possible ratio of Ca2+/H+ exchange upon Ca2+ binding, analysis by statistical mechanics28 yields best fits of charge displacement, assuming a maximum of four H+ released per 2 Ca2+ bound at low pH. On the other hand, Glu908 may retain its proton, since its mutation to Gln does not interfere with Ca2+ binding as much as mutation of Glu771. It is possible also that H+ may dissociate from, or bind to neighboring residues (such as Glu58) involved in conformational stabilization, but not contributing directly to calcium binding. Considering the pH effects shown in Fig. 7, it is apparent that for the Glu309 mutants, binding of one Ca2+ at pH 8 yields maximal charge, suggesting no H+ exchange from site I. On the other hand, the half-maximal charge (relative to WT) observed at pH 6, suggests that at pH 6 there is an exchange of one H+ for one Ca2+ at site I. For binding of two Ca2+ to the WT protein, we observe doubling of the normalized net charge as the pH is raised from 6 to 8. Therefore, the exchange for WT protein is either 2 Ca2+/3 H+ or 2 Ca2+/2 H+ at pH 6, and either 2 Ca2+/2 H+ or 2 Ca2+/0 H+ at pH 8.
It is important to realize that the stoichiometric ratio of Ca2+/H+ exchange upon calcium binding in the absence of ATP is not likely to be identical with the stoichiometric ratio of exchange through a whole Ca2+ transport cycle in the presence of ATP. Earlier, we demonstrated that the pKa of Ca2+-binding residues is raised by ATP utilization and phosphoenzyme formation, whereby exchange of bound Ca2+ with H+ is favored, thereby contributing to Ca2+ dissociation for active transport.13 In fact, the stoichiometric ratio of Ca2+/H+ exchange in steady-state transport was measured experimentally in proteoliposomes reconstituted with SERCA1, where passive fluxes of Ca2+ or H+ were prevented by the liposomal membrane. The stoichiometry of exchange per ATPase cycle at neutral pH was demonstrated to be 2 Ca2+ moved inward and 2 H+ outward, and therefore transport was found to be electrogenic.29 This can be explained by the retention of H+ by the carboxylic chain of Glu908 even in the calcium-bound state, and by considering that Glu309 may bind and release its H+ on the same cytosolic side of the membrane (due to its gating position at the cytosolic opening of the Ca2+-binding cavity). That would leave Glu771 and Asp800 as the residues picking up 2 H+ from the luminal side of the membrane as 2 Ca2+ are released from the phosphoenzyme, and releasing them onto the cytosolic side following hydrolytic cleavage of the phosphoenzyme.
Finally, we studied charge movements produced by addition of Ca2+ to WT Ca-ATPase and E309Q mutant, in the presence of various concentrations of Mg2+. It is known that Mg2+, which is an absolute requirement at the catalytic site for utilization of ATP, can also bind competitively to the Ca2+ transport sites under certain conditions.17 Fluorescence measurements suggest that Mg2+, in the millimolar concentration range, is able to bind to the empty Ca2+ sites,30 and this binding is competitively inhibited by Ca2+ and H+.25 More recently it was shown that Mg2+, at high pH and in the absence of Ca2+, confers to the Ca-ATPase some conformational features similar to those produced by Ca2+ binding (E1 state), but without catalytic activation.18 We now find that, as the concentration of Mg2+ is increased to 10 mM at pH ≥7, the level of charge movement measured upon addition of saturating Ca2+ to WT Ca-ATPase is reduced to approximately 50% of the value obtained in the absence of Mg2+ (Fig. 8a). This result suggests binding of one Mg2+ to either of the two calcium sites, whereby the net charge produced by binding of two Ca2+ would be partially counterbalanced by exchange with one bound Mg2+. Most interestingly, similar effects of Mg2+ were observed in charge measurements with the E309Q and E309A mutants. In this case (Fig. 8b), however, reduction of charge movements, as the pH is raised in the presence of high Mg2+, attains a final value that is less than 20% of that recorded in the absence of Mg2+. This suggests that Mg2+ binds to site I, thereby neutralizing the charge movements otherwise produced by Ca2+ binding at this site. This is in agreement with theoretical analysis of binding isotherms obtained at different pH and at increasing concentrations of Mg2+.28 It is consistent also with the presence of flexible oxygen functions and water molecules permitting adaptive complexation of either divalent cation at site I, as opposed to the more specific conformation (reminiscent of the EF-hand motif) produced by Ca2+ binding on site II.31
Materials and Methods
DNA constructs and vectors
Recombinant SERCA1 was derived from heterologous expression following transfection or infection of COS-1 cells. Vectors for delivery of cDNA were constructed with by two-step process. The desired expression cassette, including the rabbit SERCA1 cDNA,1 with or without a 5′ or 3′ Strep-II and His6 tag, and including an SV40 polyadenylation signal at the 3′-terminus, was first assembled into a shuttle vector, under the control of either an SV40 or a CMV promoter. The pShuttle vector containing SERCA1 cDNA under the control of an SV40 promoter was used for transfection of COS-1 cells by the DEAE-dextran method.32 Alternatively, a recombinant adenoviral vector containing SERCA1 cDNA (rAd-SERCA1) was obtained by homologous recombination between pShuttle CMV vector (purchased from Qbiogene) and pAdeasy-1 plasmid (purchased from Stratagene) derived from the Ad5 viral genome.33 To this effect, the pShuttle vector containing the expression cassette (pShuttle-CMV-SERCA1: adapted from Fig. 14 of Ref. 34) was linearized with Pme I and subjected to homologous recombination with pAdeasy-1 DNA (Ad5 genome) in BJ5183 E. coli cells by co-electroporation. The transformants were selected for kanamycin resistance, and the recombinants were subsequently identified by restriction digestion with Pac I. The confirmed recombinant plasmid was then propagated using the E. coli strain DH10B. Purified recombinant (Qiagen plasmid purification kit) plasmid was then digested with Pac I to expose its inverted terminal repeats (ITR), and transfected into HEK 293 cells using Lipofectamine and PLUS reagent (Invitrogen) to package the recombinant adenovirus rAdSERCA1. The packaged viral particles were released from HEK 293 cells, by repeated freeze–thaw cycles. This crude cell lysate was plaque-purified by infection onto an HEK 293 monolayer followed by overlay with DMEM, 10% (v/v) fetal bovine serum (Gibco), 0.5% (w/v) agarose. Each plaque was amplified individually and screened for SERCA1 expression by infecting COS-1 cells. The best expressing rAdSERCA1 plaque was further amplified in bulk using HEK 293 cells and the cell lysate was used for CsCl density-gradient purification of adenovirus. A diagram describing the overall construction of plasmid for transfection, and viral vector for infection of COS-1 cells is given in Fig. 10.
Fig. 10.
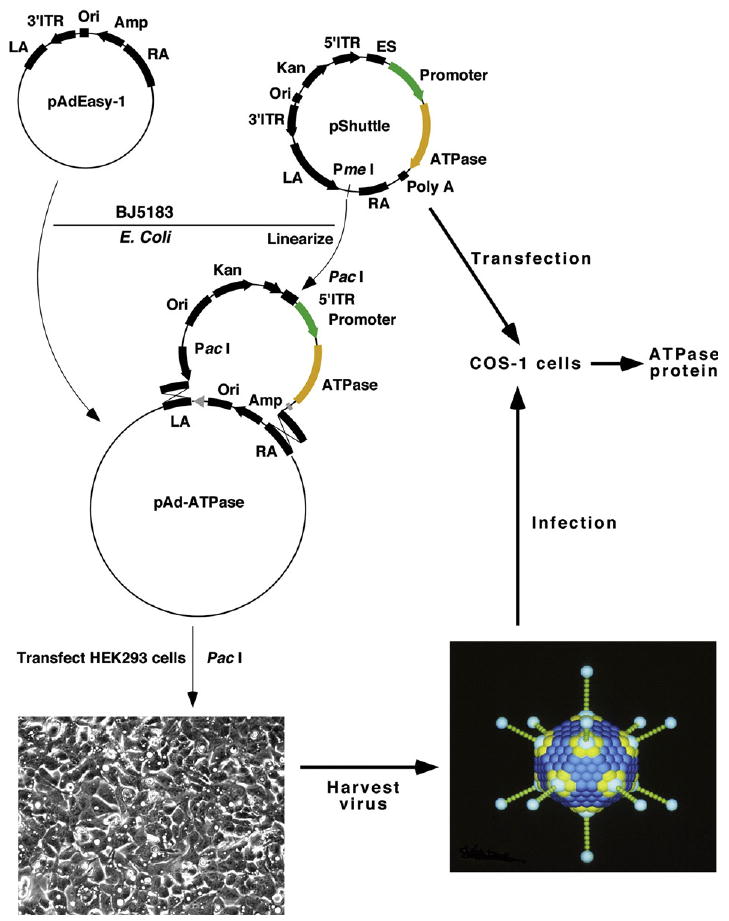
Diagram for construction of adenovirus vectors for delivery of SERCA1 cDNA to COS-1 cells. The diagram includes the shuttle vector containing SERCA1 cDNA under control of either an SV40 or a CMV promoter, which was used for transfection of COS-1 cells, or for homologous recombination with pAdeasy-1 DNA in BJ5183 Escherichia coli. The purified transformant plasmid, following digestion for exposure of its inverted terminal repeats (ITR), was transfected in HEK 293 cells to package recombinant adenovirus vectors (rAD-SERCA). The cell lysate was then subjected to plaque separation, individual plaque amplification, and CsCl gradient purification for infection of COS-1 cell. (The diagram is adapted from Ref. 34).
Site-directed mutations (E309Q/A, E771Q and D351N) were carried out using 20–30 bp long primers, which were utilized to anneal the DNA sequences internal to the flanking primers, and were used for PCR mutagenesis by overlap extension.35 The mutant DNA fragment was then exchanged with the corresponding fragment of WT cDNA in the pShuttle vector.
Cell cultures, transfections and infections
BJ5183 E. coli cells were grown in LB medium containing 30 μg/ml of streptomycin for the preparation of electrocompetent cells.36 Cultures of HEK 293 and COS-1 cells were cultured as described.37,38 The growth medium for COS-1 cells was DMEM, 10% fetal bovine serum, Penn-Strep (100 units/ml) and Fungizone (1 μg/ml). Modified Eagle's medium (MEM) was used for HEK 293 cells.
Transfections of COS-1 cells were performed with WT or mutant SERCA1 cDNA (with or without a 5′ or 3′ Strep-II (Nalgene) and His6 tag), including the SV40 polyadenylation signal at the 3′-terminus and assembled into a pShuttle vector under control of an SV40 promoter. Transfections were conducted by the DEAE/dextran method32 for the preparation of microsomes, whereas Lipofectamine (Invitrogen)-mediated transfection was used for immunostaining COS-1 cells.
Infections with recombinant adenovirus vector were conducted as follows: the growth medium on 15 cm diameter plates containing 75–80% confluent COS-1 cells was removed by aspiration. The cells were then layered with 5 ml of infection medium (DMEM supplemented with 10% BD-NuSerum (BD Bioscience), Penn-Strep (100 units/ml) and Fungizone (Invitrogen) (1 μg/ml)) containing plaque-purified rAdSERCA1 viral vectors corresponding to an MOI of 10∼50. At 1.5 h after the infection, 20 ml of growth medium was added, and on the third day (72 h post infection) the cells were harvested for microsome preparation.
Real-time quantitative RT-PCR
Total RNA was isolated using the RNeasy mini Kit with on-column DNase digestion by RNase-free DNase, according to the manufacturer's instructions. First-strand cDNA was synthesized from 1 μg of total RNA using the iScriptTM cDNA Synthesis kit (Bio-Rad) in a volume of 20 μl. The primers, designed using Beacon Designer 4.0 software (BD), were:
-
SERCA forward
5′-agaggcgctgaaggaatatgag-3′
-
SERCA reverse
5′-gtcccgagccttgatccttt-3′
-
β-actin forward
5′-ctggcgcccagcacgatg-3′
-
β-actin reverse
5′-gccgatccacacagagtact-3′
PCR amplification was performed in a total volume of 24 μl, containing 1 ng of the cDNA derived from reverse transcription, 30 pmol of each primer, and 12 μl of iQTM SYBR Green Supermix (Applied Biosystem). Each reaction was incubated for 2 min at 50 °C, 10 min at 95 °C, and then subjected to 40 cycles, each involving denaturation at 95 °C for 15 s and annealing/extension at 60 °C for 1 min. All samples were run in triplicate and gene expression levels were normalized to the β-actin gene.
Northern blot analysis
A 15 μg portion of total RNA of each sample was subjected to electrophoresis in 1% (w/v) agarose gel containing 6% formaldehyde, and transferred to positively charged nylon membranes. After UV crosslinking (UV Stratalinker, Stratagene), the membrane was hybridized at 50 °C for 30 min in DIG Easy Hyb (Roche). DNA probes were generated using PCR from cDNA corresponding to the encoding region of SERCA from 550 bp to 1100 bp and for β-actin from 200 bp to 606 bp, and then labeled using the DIG Probe synthesis kit (Roche). The membrane was hybridized with denatured probe at 50 ng ml−1 in DIG Easy Hyb at 50 °C overnight. Blots were then treated with alkaline phosphatase-labeled anti-DIG antibody and developed with CDP-star according to the manufacturer's instructions (DIG Northern Kit, Roche).
Immunostaining of recombinant SERCA1 expressed in COS-1 cells
COS-1 cells were grown in a four-chambered microscopic slide (Fisher) and transfection or infection of SERCA1 cDNA was carried out as described above. The COS-1 cells were incubated for 72 h (transfection) or 48 h (infection) at 37 °C in a CO2 incubator and were fixed with 3.7% (v/v) paraformaldehyde in PBS for 20 min, followed by permeabilization with PBS, 0.1% (v/v) Triton X-100 for 15 min at room temperature. To block non-specific binding sites, the permeabilized COS-1 cells were incubated with 10% (v/v) horse serum in PBS for 1 h at room temperature followed by incubation with diluted (1:2500) primary anti-SERCA1 monoclonal antibody (ABR) at 4 °C overnight in block solution. After washing three times in PBS, 1% horse serum, anti-mouse Alexa Fluor-labeled secondary antibodies (Alexa 488, Invitrogen), diluted (1:200) in the block solution (10% (v/v) horse serum in PBS) for 2 h at room temperature, were used for the detection of signals. The nuclei of the cells were stained with 10 μg/ml of propidium iodide in PBS for 10 min. Each step was followed by rinsing with PBS three times. Finally, the stained cells were visualized for SERCA1 expression using a confocal laser scanning microscope (Nikon, Eclipse TE2000-U).
Microsome preparation and immunodetection of expressed protein
The microsomal fraction of harvested cells was obtained as described,39 and the final suspension was stored in small aliquots at −70 °C. The total microsomal protein was determined using a BCA protein assay kit (Pierce). Electrophoretic separation of the microsomal proteins was obtained by the Laemmli method, followed by protein staining with Coomassie brilliant blue, or blotting and incubation with monoclonal antibodies for rabbit SERCA1 followed by incubation with goat anti-mouse IgG-horseradish peroxidase-conjugated secondary antibodies. Quantification of immunoreactivity was obtained by the measurement of chemiluminescence.
Native SERCA1 protein was obtained with the microsomal fraction of rabbit skeletal muscle.40
ATPase activity and Ca2+ transport
ATPase activity was determined by measuring Pi.41 The reaction mixture was 20 mM Mops, pH 7.0, 80 mM KCl, 2 mM MgCl2, 10 μM CaCl2, 20–50 μg/ml of microsomal protein, 2 μM A23187 calcium ionophore. The reaction was started by the addition of 1 mM (final concentration) ATP at 37 °C, and samples were taken at preset time-points. A negative control was run in the presence of 1 μM thapsigargin, a specific SERCA inhibitor.
Formation of the phosphoenzyme intermediate was obtained in the presence of 20 mM Mops, pH 7.0, 80 mM KCl, 3 mM MgCl2, 50 μg/ml of microsomal protein. The reaction was started by the addition of 30 μM (final concentration) [γ-32P]ATP and allowed to proceed for 90 s at 2∼3 °C. Quenching was obtained with 5% (w/v) trichloroacetic acid, and the quenched samples were passed through 0.45 μm pore size Millipore filters. The protein adsorbed on the filter was washed three times with cold 0.125 M trichloroacetic acid and once with cold water. The filters were then blotted and processed for determination of radioactivity by scintillation counting.
ATP-dependent Ca2+ transport was measured in the presence of 20 mM Mops, pH 7.0, 80 mM KCl, 2 mM MgCl2, 10 μM CaCl2 and 5 mM potassium oxalate. The reaction was started by the addition of 3 mM (final concentration) ATP at 30 °C, and samples were filtered at serial times through 0.45 μm pore size Millipore filters. The filters were rinsed three times with cold 2 mM LaCl3 and then processed for radioactivity determination by scintillation counting.
Measurement of charge movements
Charge movements were measured by adsorbing microsomes containing recombinant WT and mutant SR Ca-ATPase onto an SSM that consisted of an octadecanethiol monolayer covalently linked to the gold surface via the sulfur atom, with a diphytanoylphosphatidylcholine monolayer on top of it.42,43
The microsomes were adsorbed onto the SSM, and the protein was then activated by the rapid injection of a solution containing a suitable substrate, e.g. Ca2+. If at least one electrogenic step, i.e. a net charge movement across the vesicular membrane generated by the protein, is involved in the relaxation process following protein activation, a current transient can be recorded by the SSM method.13 In particular, the electrical response of the ion pump can be monitored under potentiostatic conditions. In this case, movement of a net charge across the activated protein is compensated by a flow of electrons along the external circuit to keep the applied voltage ΔV constant across the whole metal/solution interphase. The resulting current transient is recorded as a function of time. Normally, experiments are carried out under short-circuit-conditions, i.e. at zero applied voltage relative to the reference electrode. It should be pointed out that the SSM technique detects pre-steady state current transients within the first transport cycle, and is not sensitive to stationary currents following the first cycle. Useful information is gained from current transients.44,45 In fact, numerical integration of each transient is related to a net charge movement, which depends upon the particular electrogenic event. In addition, kinetic information can be obtained by fitting a sum of exponentially decaying terms to the current versus time curves. Recently, the traditional SSM method has been robotized and has become commercially available (SURFE2R, IonGate Biosciences, Frankfurt/Main, Germany).
Two buffered solutions were used in Ca2+ concentration jump experiments, the washing solution and the activating solution. The washing solution was 150 mM choline chloride, 25 mM Mops (pH 7.0), 0.25 mM EGTA, 0.2 mM DTT, and different concentrations of MgCl2. The activating solution was the same as the washing solution but contained, in addition, the required concentration of CaCl2.
The concentration jump experiments were done with the SURFE2ROne device. The SSM sensor, the experimental setup, as well as the solution exchange technique are described elsewhere.46
To verify the reproducibility of the current transients generated within the same set of measurements on the same SSM, each single measurement of the set was repeated four or five times and then averaged to improve the signal-to-noise ratio. Standard deviations were usually found to be within ±5%. Moreover, each set of measurements was usually reproduced using three different gold sensors; therefore, the data points reported in the figures represent the mean of three independent normalized values. Standard deviations are given by individual error bars in each figure.
Free Ca2+ concentration was calculated with the computer program WinMAXC.47
The temperature was maintained at 22–23 °C for all the experiments.
Appendix
The results of the statistical analysis of the binding constants K1 and K2 of Eq. (2) are summarized in Fig. A1. Best values of the binding constants were obtained by a minimization procedure relative to the parameter χ2 of the fitting curve. Fitting curves with the corresponding χ2 values were calculated by imposing a fixed value of K2 and determining K1 as the variable parameter. As an initial value for K2 we used that obtained by fitting Eq. (1) to the experimental data relative to the E309Q mutant, e.g. 4.4 × 10⁶ M−1. By varying K2, the minimum χ2 and the corresponding value for K1 were determined as indicated by the broken vertical lines in Fig. A1 in the main text. Optimal values for K1 and K2 were 5.7±0.4×10⁵ M−1 and 5.8±0.4×10⁶ M−1, respectively, in excellent agreement with those obtained by fitting Eq. (2) to the experimental data relative to the WT enzyme.
Fig. A1.
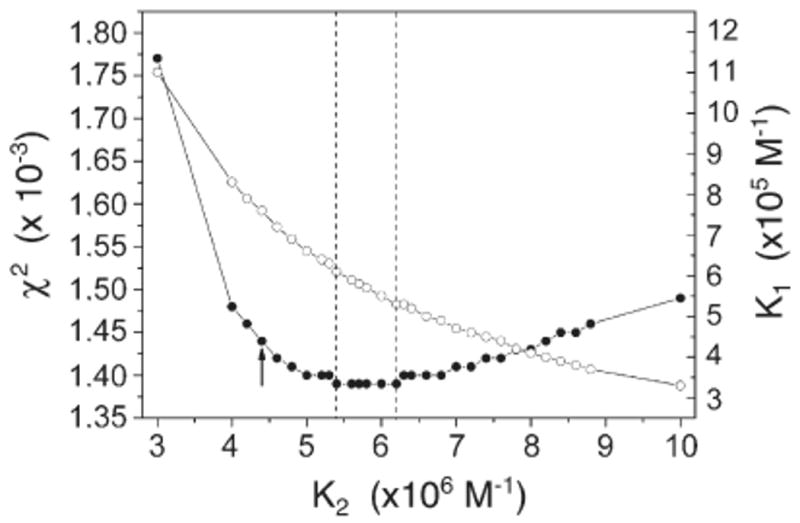
Statistical analysis of the binding constants K1 and K2 of Eq. (2). χ2 (filled circles) and K1 (open circles) are plotted as a function of K2. The broken vertical lines indicate the region of minimum χ2, in correspondence to which K1=5.7±0.4×10⁵ M−1 and K2=5.8±0.4×10⁶ M−1 are obtained. The arrow indicates the initial value attributed to K2.
Moreover, it is worth noting that the reciprocal geometric mean of K1 and K2 equals the K0.5 obtained from the Hill equation:16,43
| (3) |
From the K1 and K2 values, a K0.5 of 0.55 μM is obtained, which is identical with that determined by fitting the Hill equation to the experimental data in Fig. 6 of the main text.
Acknowledgments
This research was supported, in part, by the U.S. National Institutes of Health Grant NHLBI RO 301-69830 (to G.I.). Financial support from Ente Cassa di Risparmio di Firenze and Ministero dell'Istruzione, Università e Ricerca (PRIN project) is gratefully acknowledged.
Abbreviations used
- SR
sarcoplasmic reticulum
- SERCA
sarcoendoplasmic reticulum ATPase
- LSR
native sarcoplasmic reticulum vesicles
- EP
phosphorylated enzyme intermediate
- SSM
solid supported membrane
- MOI
multiplicity of infection
References
- 1.MacLennan DH, Brandl CJ, Korczak B, Green NM. Amino-acid sequence of a Ca2+ + Mg2+-dependent ATPase from rabbit muscle sarcoplasmic reticulum, deduced from its complementary DNA sequence. Nature. 1985;316:696–700. doi: 10.1038/316696a0. [DOI] [PubMed] [Google Scholar]
- 2.de Meis L, Vianna AL. Energy interconversion by the Ca2+-dependent ATPase of sarcoplasmic reticulum. Annu Rev Biochem. 1979;48:275–292. doi: 10.1146/annurev.bi.48.070179.001423. [DOI] [PubMed] [Google Scholar]
- 3.Kühlbrandt W. Biology, structure and mechanism of P-type ATPases. Nat Rev Mol Cell Biol. 2004;5:282–295. doi: 10.1038/nrm1354. [DOI] [PubMed] [Google Scholar]
- 4.Inesi G, Kurzmack M, Coan C, Lewis DE. Cooperative calcium binding and ATPase activation in sarcoplasmic reticulum vesicles. J Biol Chem. 1980;255:3025–3031. [PubMed] [Google Scholar]
- 5.Chiesi M, Inesi G. Adenosine 5′-triphosphate dependent fluxes of manganese and hydrogen ions in sarcoplasmic reticulum vesicles. Biochemistry. 1980;19:2912–2918. doi: 10.1021/bi00554a015. [DOI] [PubMed] [Google Scholar]
- 6.Olesen C, Sørensen TL, Nielsen RC, Møller JV, Nissen P. Dephosphorylation of the calcium pump coupled to counterion occlusion. Science. 2004;306:2251–2255. doi: 10.1126/science.1106289. [DOI] [PubMed] [Google Scholar]
- 7.Clarke DM, Loo TW, Inesi G, MacLennan DH. Location of high affinity Ca2+-binding sites within the predicted transmembrane domain of the sarcoplasmic reticulum Ca2+-ATPase. Nature. 1989;339:476–478. doi: 10.1038/339476a0. [DOI] [PubMed] [Google Scholar]
- 8.Masuda H, de Meis L. Phosphorylation of the sarcoplasmic reticulum membrane by orthophosphate. Inhibition by calcium ions Biochemistry. 1973;12:4581–4585. doi: 10.1021/bi00747a006. [DOI] [PubMed] [Google Scholar]
- 9.Clarke DM, Loo TW, Rice WJ, Andersen JP, Vilsen B, MacLennan DH. Functional consequences of alterations to hydrophobic amino acids located in the M4 transmembrane sector of the Ca(2+)-ATPase of sarcoplasmic reticulum. J Biol Chem. 1993;268:18359–18364. [PubMed] [Google Scholar]
- 10.Andersen JP, Vilsen B. Structure-function relationships of cation translocation by Ca(2+)- and Na+, K(+)-ATPases studied by site-directed mutagenesis. FEBS Lett. 1995;359:101–106. doi: 10.1016/0014-5793(95)00019-6. [DOI] [PubMed] [Google Scholar]
- 11.Strock C, Cavagna M, Peiffer WE, Sumbilla C, Lewis D, Inesi G. Direct demonstration of Ca2+ binding defects in sarco-endoplasmic reticulum Ca2+ ATPase mutants overexpressed in COS-1 cells transfected with adenovirus vectors. J Biol Chem. 1998;273:15104–15109. doi: 10.1074/jbc.273.24.15104. [DOI] [PubMed] [Google Scholar]
- 12.Toyoshima C, Nakasako M, Nomura H, Ogawa H. Crystal structure of the calcium pump of sarcoplasmic reticulum at 2.6 Å resolution. Nature. 2000;405:647–655. doi: 10.1038/35015017. [DOI] [PubMed] [Google Scholar]
- 13.Tadini-Buoninsegni F, Bartolommei G, Moncelli MR, Guidelli R, Inesi G. Pre-steady state electrogenic events of Ca2+/H+ exchange and transport by the Ca2+-ATPase. J Biol Chem. 2006;281:37720–37727. doi: 10.1074/jbc.M606040200. [DOI] [PubMed] [Google Scholar]
- 14.Lewison O, Leen AT, Rees DC. The funnel approach to the Precrystallization production of membrane protein. J Mol Biol. 2007;377:62–73. doi: 10.1016/j.jmb.2007.12.059. [DOI] [PMC free article] [PubMed] [Google Scholar]
- 15.Inesi G, Zhang Z, Lewis D. Cooperative setting for long-range linkage of Ca(2+) binding and ATP synthesis in the Ca(2+) ATPase. Biophys J. 2002;83:2327–2332. doi: 10.1016/S0006-3495(02)75247-8. [DOI] [PMC free article] [PubMed] [Google Scholar]
- 16.Deranleau DA. Theory of the measurements of weak molecular complexes. II. Consequences of multiple equilibria. J Am Chem Soc. 1969;91:4050–4054. doi: 10.1021/ja00838a042. [DOI] [PubMed] [Google Scholar]
- 17.Forge V, Mintz E, Guillain F. Ca2+ binding to sarcoplasmic reticulum ATPase revisited. I. Mechanism of affinity and cooperativity modulation by H+ and Mg2+ J Biol Chem. 1993;268:10953–10960. [PubMed] [Google Scholar]
- 18.Inesi G, Lewis D, Toyoshima C, Hirata A, de Meis L. Conformational fluctuations of the Ca2+-ATPase in the native membrane environment. Effects of pH, temperature, catalytic substrates, and thapsigargin. J Biol Chem. 2008;283:1189–1196. doi: 10.1074/jbc.M707189200. [DOI] [PubMed] [Google Scholar]
- 19.Maruyama K, MacLennan DH. Mutation of aspartic acid-351, lysine-352, and lysine-515 alters the Ca2+ transport activity of the Ca2+-ATPase expressed in COS-1 cells. Proc Natl Acad Sci USA. 1988;85:3314–3318. doi: 10.1073/pnas.85.10.3314. [DOI] [PMC free article] [PubMed] [Google Scholar]
- 20.Skerjanc IS, Toyofuku T, Richardson C, MacLennan DH. Mutation of glutamate 309 to glutamine alters one Ca(2+)-binding site in the Ca(2+)-ATPase of sarcoplasmic reticulum expressed in Sf9 cells. J Biol Chem. 1993;268:15944–15950. [PubMed] [Google Scholar]
- 21.Waggoner JR, Huffman J, Griffith BN, Jones LR, Mahaney JE. Improved expression a characterization of Ca2+-ATPase and phospholamban in High-Five Cells. Protein Expr Purif. 2004;34:56–67. doi: 10.1016/j.pep.2003.11.005. [DOI] [PubMed] [Google Scholar]
- 22.Falson P, Lenoir G, Menguy T, Corre F, Montigny C, Pedersen PA, et al. Overexpression of SERCA1a Ca2+-ATPase in yeast. Ann NY Acad Sci. 2003;986:312–314. doi: 10.1111/j.1749-6632.2003.tb07198.x. [DOI] [PubMed] [Google Scholar]
- 23.Toyoshima C, Inesi G. Structural basis of ion pumping by Ca2+-ATPase of the sarcoplasmic reticulum. Annu Rev Biochem. 2004;73:269–292. doi: 10.1146/annurev.biochem.73.011303.073700. [DOI] [PubMed] [Google Scholar]
- 24.Obara K, Miyashita N, Xu C, Toyoshima I, Sugita Y, Inesi G, Toyoshima C. Structural role of countertransport revealed in Ca2+ pump crystal structure in the absence of Ca2+ Proc Natl Acad Sci USA. 2005;102:14489–14496. doi: 10.1073/pnas.0506222102. [DOI] [PMC free article] [PubMed] [Google Scholar]
- 25.Peinelt C, Apell HJ. Kinetics of the Ca2+, H+, and Mg2+ interaction with the ion-binding sites of the SR Ca-ATPase. Biophys J. 2002;82:170–181. doi: 10.1016/S0006-3495(02)75384-8. [DOI] [PMC free article] [PubMed] [Google Scholar]
- 26.Di Leva F, Domi T, Fedrizzi L, Lim D, Carafoli E. The plasma membrane Ca2+ ATPase of animal cells: Structure, function and regulation. Arch Biochem Biophys. 2008;476:65–74. doi: 10.1016/j.abb.2008.02.026. [DOI] [PubMed] [Google Scholar]
- 27.Hauser K, Barth A. Side-chain protonation and mobility in the sarcoplasmic reticulum Ca2+-ATPase: Implications for proton countertransport and Ca2+ release. Biophys J. 2007;93:3259–3270. doi: 10.1529/biophysj.107.109363. [DOI] [PMC free article] [PubMed] [Google Scholar]
- 28.Zafar S, Hussain A, Liu Y, Lewis D, Inesi G. Specificity of ligand binding to transport sites: Ca2+ binding to the Ca2+ transport ATPase and its dependence on H+ and Mg2+ Arch Biochem Biophys. 2008;476:87–94. doi: 10.1016/j.abb.2008.04.035. [DOI] [PMC free article] [PubMed] [Google Scholar]
- 29.Yu X, Hao L, Inesi G. A pK change of acidic residues contributes to cation countertransport in the Ca-ATPase of sarcoplasmic reticulum. Role of H+ in Ca(2+)-ATPase countertransport. J Biol Chem. 1994;269:16656–16661. [PubMed] [Google Scholar]
- 30.Guillain F, Gingold MP, Champeil P. Direct fluorescence measurements of Mg2+ binding to sarcoplasmic reticulum ATPase. J Biol Chem. 1982;257:7366–7371. [PubMed] [Google Scholar]
- 31.Toyoshima C. Structural aspects of ion pumping by Ca2+-ATPase of sarcoplasmic reticulum. Arch Biochem Biophys. 2008;476:3–11. doi: 10.1016/j.abb.2008.04.017. [DOI] [PubMed] [Google Scholar]
- 32.Sumbilla C, Lu L, Lewis DE, Inesi G, Ishii T, Takeyasu K, et al. Ca(2+)-dependent and thapsigargin-inhibited phosphorylation of Na+, K(+)-ATPase catalytic domain following chimeric recombination with Ca(2+)-ATPase. J Biol Chem. 1993;268:21185–21192. [PubMed] [Google Scholar]
- 33.He TC, Zhou S, da Costa LT, Yu J, Kinzler KW, Vogelstein B. A simplified system for generating recombinant adenoviruses. Proc Natl Acad Sci USA. 1998;95:2509–2514. doi: 10.1073/pnas.95.5.2509. [DOI] [PMC free article] [PubMed] [Google Scholar]
- 34.Hoffman D, Wildner O. Efficient generation of double heterologous promoter controlled oncolytic adenovirus vectors by a single homologous recombination step in Escherichia coli. BMC Biotechnol. 2006;6:36–48. doi: 10.1186/1472-6750-6-36. [DOI] [PMC free article] [PubMed] [Google Scholar]
- 35.Ho SN, Hunt HD, Horton RM, Pullen JK, Pease LR. Site-directed mutagenesis by overlap extension using the polymerase chain reaction. Gene. 1989;77:51–59. doi: 10.1016/0378-1119(89)90358-2. [DOI] [PubMed] [Google Scholar]
- 36.Hanahan D. Studies on transformation of Escherichia coli with plasmids. J Mol Biol. 1983;166:557–580. doi: 10.1016/s0022-2836(83)80284-8. [DOI] [PubMed] [Google Scholar]
- 37.Graham FL, Smiley J, Russel WC, Nairn R. Characterization of a human cell line transformed by DNA from human adenovirus type 5. J Gen Virol. 1977;36:58–72. doi: 10.1099/0022-1317-36-1-59. [DOI] [PubMed] [Google Scholar]
- 38.Gluzman Y. SV40-transformed simian cells support the replication of early SV40 mutants. Cell. 1981;23:175–182. doi: 10.1016/0092-8674(81)90282-8. [DOI] [PubMed] [Google Scholar]
- 39.Autry JM, Jones LR. Functional Co-expression of the canine cardiac Ca2+ pump and phospholamban in Spodoptera frugiperda (Sf21) cells reveals new insights on ATPase regulation. J Biol Chem. 1997;272:15872–15880. doi: 10.1074/jbc.272.25.15872. [DOI] [PubMed] [Google Scholar]
- 40.Eletr S, Inesi G. Phospholipid orientation in sarcoplasmic membranes: spin-label ESR and proton MNR studies. Biochim Biophys Acta. 1972;282:174–179. doi: 10.1016/0005-2736(72)90321-5. [DOI] [PubMed] [Google Scholar]
- 41.Lanzetta PA, Alvarez LJ, Reinach PS, Candia OA. An improved assay for nanomole amounts of inorganic phosphate. Anal Biochem. 1979;100:95–97. doi: 10.1016/0003-2697(79)90115-5. [DOI] [PubMed] [Google Scholar]
- 42.Pintschovius J, Fendler K. Charge translocation by the Na+/K+-ATPase investigated on solid supported membranes: rapid solution exchange with a new technique. Biophys J. 1999;76:814–826. doi: 10.1016/S0006-3495(99)77245-0. [DOI] [PMC free article] [PubMed] [Google Scholar]
- 43.Tadini Buoninsegni F, Bartolommei G, Moncelli MR, Inesi G, Guidelli R. Time-resolved charge translocation by sarcoplasmic reticulum Ca-ATPase measured on a solid supported membrane. Biophys J. 2004;86:3671–3686. doi: 10.1529/biophysj.103.036608. [DOI] [PMC free article] [PubMed] [Google Scholar]
- 44.Schulz P, Garcia-Celma JJ, Fendler K. SSM-based electrophysiology. Methods. 2008;46:97–103. doi: 10.1016/j.ymeth.2008.07.002. [DOI] [PubMed] [Google Scholar]
- 45.Tadini-Buoninsegni F, Bartolommei G, Moncelli MR, Fendler K. Charge transfer in P-type ATPases investigated on planar membranes. Arch Biochem Biophys. 2008;476:75–86. doi: 10.1016/j.abb.2008.02.031. [DOI] [PubMed] [Google Scholar]
- 46.Kelety B, Diekert K, Tobien J, Watzke N, Dörner W, Obrdlik P, Fendler K. Transporter assays using solid supported membranes: a novel screening platform for drug discovery. Assay Drug Dev Technol. 2006;4:575–582. doi: 10.1089/adt.2006.4.575. [DOI] [PubMed] [Google Scholar]
- 47.Patton C, Thompson S, Epel D. Some precautions in using chelators to buffer metals in biological solutions. Cell Calcium. 2004;35:427–431. doi: 10.1016/j.ceca.2003.10.006. [DOI] [PubMed] [Google Scholar]