

Abstract
Purpose
To quantify the relationship between coronary heart disease (CHD) risk factor levels and changes over time and population-wide CHD morbidity and mortality.
Methods
We used a paired cohort and community surveillance of hospitalized myocardial infarction and CHD deaths of community members aged 53 to 64 in four geographic areas to compare observed community CHD to expected CHD rates and trends based on cohort risk factors.
Results
Observed CHD rates declined by 1 to 3% per year in all communities except one, while CHD death rates declined 3 to 6% per year in all communities. Risk factor trends predicted a 2 to 3% per year decline in both total events and death. In all communities except one, expected rates of total CHD events were lower than the observed rates while expected and observed CHD death rates were similar. Across all communities women had a higher CHD death rate than expected.
Conclusion
Overall, trends in CHD risk factors provide a useful indicator of changes in community event rates and of CHD death, but caution is warranted in prediction of absolute risk of CHD events.
MeSH Keywords: Adult, Coronary Disease, Humans, Mortality/trends, Myocardial Infarction/mortality/prevention & control, Myocardial Revascularization/statistics & numerical data, Risk Factors, United States/epidemiology
INTRODUCTION
Despite recent declines, coronary heart disease (CHD) remains the leading cause of death in the United States and associated costs have risen steadily to $156.4 billion in 2008.(1) Population risk factors are used as a leading indicator to drive national goals for reduction of CHD morbidity and mortality.(2) Clarifying the strength of the overall relationship between risk factor changes and population CHD morbidity and mortality is important for planning and evaluation, as is examining variability in those relationships to identify areas where more or different intervention might be helpful.
Ford and colleagues recently estimated that risk factor changes accounted for 50% of the decline in CHD mortality between 1990 and 2000 in the US,(3) while Kuulasmaa and colleagues, using international data, estimated that a 2% decline in predicted risk from risk factors corresponded to a 1% change in observed CHD morbidly and mortality combined.(4) To date, no study in the US has examined the effect of risk factor changes on a combined population endpoint of CHD morbidity and mortality using multiple surveillance communities.
This study presents a paired comparison of cohort risk with population CHD morbidity and mortality over a 12 year period in four US geographical areas. We estimated the contribution of measured risk factor levels to observed trends in both morbidity and mortality as well as examined the utility of cohort generated estimations for population outcomes.
METHODS
Study Population
The Atherosclerosis Risk in Communities (ARIC) Study began in 1986 in four US geographic areas and two primary race groups: blacks and whites in Forsyth County, North Carolina; whites in the northwestern suburbs of Minneapolis, Minnesota; whites in Washington County, Maryland and blacks in Jackson, Mississippi. These geographic areas were selected based on location, availability of census data, population size, population stability, and feasibility. Participants provided written informed consent and the study was approved by the institutional review board at each participating institution. The cohort component, which includes 15,792 participants, is made up of a probability sample from each defined community, ages 45 to 64 at baseline.(5, 6) Baseline visits were randomly distributed from 1987 through 1989, and each participant was invited for 3 follow-up visits. Visits were approximately 3 years apart with the last visit from 1996 through 1998. Major cardiovascular risk factors were measured at each visit, including blood pressure, smoking status, plasma cholesterol, and presence of diabetes. In order to look at corresponding risk factor and event trends over time in the cohort, only results for ages 53 to 64, which were represented throughout the time period, and events through 1998, the end of the last visit period, are presented.
The ARIC community surveillance component ascertained cardiovascular events occurring in the study communities after January 1, 1987, for residents aged 35 through 74 at the time of the event. All eligible CHD deaths were abstracted from death records and additional information sought, including hospital records and physician questionnaires and next-of-kin interviews for out-of-hospital deaths. Deaths were reviewed and those with no known lethal non-atherosclerotic or non-cardiac atherosclerotic process which met the additional criteria for definite fatal myocardial infarction (MI) (definite hospitalized MI within four weeks of death) or definite fatal CHD (history of chest pain within 72 hours of death and/or history of chronic ischemic heart disease) were classified as a CHD death for this study.(7, 8) Additionally, hospital records which met the surveillance inclusion criteria and contained ICD9 codes 402, 410–414, 427, 428 or 518.4 as primary or secondary diagnoses were identified from all hospitals serving the communities. A sample of the records was reviewed, ranging from up to 100% for code 410 to 10% for codes 402, 427, 428 and 518.4. Records which met the criteria for definite or probable MI (1;2) were classified as an MI for this study and used in combination with the sampling weights to represent all eligible incident events. Incident CHD events in the cohort were also ascertained through annual follow-up and validated as described for community surveillance.
The primary CHD event definition used for both the cohort and the community was incident MI or CHD death, with no exclusion for CHD prior to the study period. A total of 6978 events were identified in community residents age 53 to 64 from 1987–1998 after accounting for sampling fractions. CHD deaths were used as a secondary outcome and a total of 1607 deaths were identified in the community.
Census data were collected by the US Census Bureau in 1980, 1990 and 2000 and included race, sex and age information on the ARIC communities. By combining census data with the surveillance data, the following aggregate information was available on the four ARIC Study communities: race, sex, and age distributions, and CHD events, which are used to report CHD rates and trends.(9, 10)
Additional census data on migration collected in the 5 percent 1990 and 2000 census long form sub-samples were obtained from the Integrated Public Use Microdata Series database.(11) The geographic data available corresponded exactly to the ARIC community boundaries for Forsyth County and Washington County. For the Minneapolis community, Hennepin County excluding Minneapolis was used. For the Jackson community, the Jackson metropolitan area was used.
Data Analysis
The overall analysis plan is outlined in Figure 1. The goal was to compare the expected probability of CHD events, generated from the cohort data on risk factor levels in individuals and aggregated across individuals, with the observed community level CHD rates identified from the surveillance and census information.
Figure 1. Diagram of Analysis Method.

Expected coronary heart disease (CHD) rates in each community were generated through a two step process: 1) an exponential individual level prediction model was developed using the whole cohort with each person contributing information from each study visit; and 2) the individual predicted 1-year probabilities of a CHD event were averaged for all cohort members in a given age/sex/race/center/year group to get the expected CHD event rate for the group. Observed CHD rates were obtained using the surveillance event counts, weighted for the chart review sampling fractions, divided by the population from the census.
Expected CHD rates for each community were generated through a two step process. First, an exponential individual level prediction model was generated using the whole ARIC cohort with each person contributing information from each visit (e.g., a person who came in for all four visits would contribute 4 observations: visit 1 information with follow-up to visit 2, visit 2 information with follow-up to visit 3, visit 3 information with follow-up to visit 4, and visit 4 information with follow up through the end of 1998). This strategy corresponds to the population model of an open cohort with individual risk factor information gathered at intervals and the exponential model fit the data reasonably well. The primary model used age, race, sex, and risk factor levels to estimate the baseline probability of an event as well as the relative effect of each variable. Community was not included as a variable in the prediction equation so as to use the combined experience across the ARIC communities. These estimates were combined to construct individual probabilities of a CHD event. A secondary model was also generated with terms only for age, race, and sex and was intended to represent the best prediction using only demographic information.
Second, to get the expected community CHD event rate in each age/sex/race/center/year group, the individual expected 1-year probabilities of a CHD event were averaged for all cohort participants in the corresponding group and visit. This method of summarizing probabilities is preferable to substituting in the average risk factor level in a demographic group because it more fully represents the population distribution of risk factors. For example, to get the estimated rate for 56 year old white men in Washington County in 1990, the average predicted probability for all white men in Washington County who were 56 years old at Visit 2 was used. Overall, the median number of individuals contributing risk factor data to each group was 75 (25th – 75th percentile: 18 to 99). To get an expected CHD rate for a community, the individual group rates were summed using weights proportional to the community make-up from the census. Each age, sex, race and calendar-year composition was interpolated from census data. Conversion from five year age groups to individual ages was done using the Karup-King method.(12) Confidence intervals for the expected rates were generated by bootstrapping from the sampling distribution of the model coefficients and bias-correcting the resulting estimates.(13)
Observed community CHD rates were obtained using the surveillance counts of MI plus CHD death, weighted for the chart review sampling fractions, divided by the population from the census. Events in the population were assumed to follow a Poisson distribution and the variance for the observed rates was calculated by summing the squared sample weights within each group. For groups with no events, the predicted number of events was used as an estimate of the variance.
The initial unit of analysis was age/sex/race/center/visit group (480 groups) for the expected and the corresponding age/sex/race/center/year group (1436 groups) for the observed. Both the observed and expected rates were then further aggregated to center/year groups for subsequent analyses. Linear trends over time in each center/race group were assessed using linear regression; percent change trends were assessed using the log of the rates. The ratio of observed to expected rates across all age/sex/race/center/year groups were compared using a over-dispersed Poisson model of the observed events with the expected events as the offset term and no intercept.(14) Additional adjustment for the variance in the expected rates was considered but not incorporated since the ratio of the variance in the expected to the observed rate was small (0.08, 25th–75th percentile 0.05–0.10).
RESULTS
Levels of CHD risk factors for each center and visit are shown in Table 1. In all centers, total cholesterol and smoking decreased over time. During the corresponding period, the total population size increased in every community except Jackson, while the age and sex distributions remained relatively constant. Migration into the centers was fairly limited, with only 5 to11% in 1990 and 1 to 9% in 2000 of residents reporting having lived outside the center area five years previously.
Table 1.
Distribution of Coronary Heart Disease Risk Factors for ARIC Cohort Participants Aged 53–64 by Visit and Center/Race Group (Mean (SD) or %)
| Visit | n | Age | Total Cholesterol (mmol/L) | HDL Cholesterol (mmol/L) | Systolic Blood Pressure (mm Hg) | Current Smoker | Diabetic | Male |
|---|---|---|---|---|---|---|---|---|
| Minneapolis White | ||||||||
| 1 | 2205 | 58 (3) | 5.67 (1.06) | 1.35 (0.44) | 122 (17) | 22% | 9% | 52% |
| 2 | 2293 | 58 (3) | 5.52 (1.01) | 1.3 (0.44) | 122 (17) | 20% | 10% | 49% |
| 3 | 2224 | 58 (3) | 5.44 (0.96) | 1.4 (0.49) | 121 (16) | 16% | 9% | 46% |
| 4 | 1950 | 59 (3) | 5.26 (0.93) | 1.35 (0.44) | 123 (16) | 15% | 10% | 43% |
| Washington Co. White | ||||||||
| 1 | 2424 | 58 (3) | 5.78 (1.06) | 1.27 (0.41) | 122 (18) | 22% | 13% | 50% |
| 2 | 2218 | 58 (3) | 5.54 (1.01) | 1.22 (0.39) | 121 (18) | 20% | 14% | 47% |
| 3 | 2099 | 58 (3) | 5.39 (0.98) | 1.27 (0.41) | 122 (18) | 16% | 14% | 44% |
| 4 | 1697 | 59 (3) | 5.26 (0.98) | 1.24 (0.39) | 124 (17) | 14% | 14% | 42% |
| Forsyth Co. White | ||||||||
| 1 | 2068 | 59 (3) | 5.59 (1.04) | 1.32 (0.47) | 121 (18) | 27% | 10% | 47% |
| 2 | 1912 | 59 (3) | 5.41 (1.01) | 1.27 (0.44) | 119 (17) | 24% | 12% | 46% |
| 3 | 1696 | 59 (3) | 5.34 (0.96) | 1.32 (0.49) | 120 (18) | 21% | 11% | 46% |
| 4 | 1381 | 59 (3) | 5.15 (0.93) | 1.27 (0.44) | 120 (17) | 20% | 12% | 45% |
| Forsyth Co. Black | ||||||||
| 1 | 282 | 59 (3) | 5.62 (1.11) | 1.4 (0.49) | 127 (21) | 39% | 23% | 40% |
| 2 | 220 | 59 (3) | 5.36 (0.98) | 1.35 (0.49) | 128 (21) | 40% | 25% | 38% |
| 3 | 179 | 58 (3) | 5.21 (1.04) | 1.4 (0.49) | 131 (25) | 34% | 25% | 35% |
| 4 | 132 | 59 (3) | 5.1 (1.01) | 1.4 (0.41) | 127 (17) | 20% | 26% | 36% |
| Jackson Black | ||||||||
| 1 | 1767 | 58 (3) | 5.7 (1.19) | 1.42 (0.44) | 133 (22) | 27% | 24% | 39% |
| 2 | 1676 | 58 (3) | 5.54 (1.14) | 1.37 (0.44) | 129 (22) | 23% | 27% | 36% |
| 3 | 1636 | 58 (3) | 5.41 (1.06) | 1.45 (0.49) | 130 (20) | 21% | 24% | 34% |
| 4 | 1472 | 58 (3) | 5.18 (0.98) | 1.37 (0.44) | 132 (20) | 19% | 25% | 34% |
HDL = high density lipoprotein
Figure 2 shows the relationship between the observed and expected rates for all CHD events for each center and race group over time. The relationship between expected and observed risk varied across centers. Expected risk was close to observed risk in Minneapolis, with estimated risk lower than observed risk in all the other center and race groups. Both observed and expected CHD rates showed a decline over time in all groups except the Forsyth County black community. Figure 3 shows the relationship between the observed and expected rates for CHD death only for each center and race group over time. While the numbers of CHD deaths were smaller than the total number of CHD events, the relationships between observed and expected rates are more consistent. Both observed and expected rates declined in every center and race group. In contrast to the CHD events, the observed rates in the community were consistently lower than the expected rates based on cohort risk factors in Minneapolis and largely indistinguishable in Washington County and the Forsyth County white communities. In the Forsyth County black and Jackson communities, while the confidence intervals were large, the rate of decline was steeper in the observed than expected.
Figure 2. Observed and Expected CHD Event Rates per 100,000 Person Years by Calendar Year and ARIC Study Center Group.
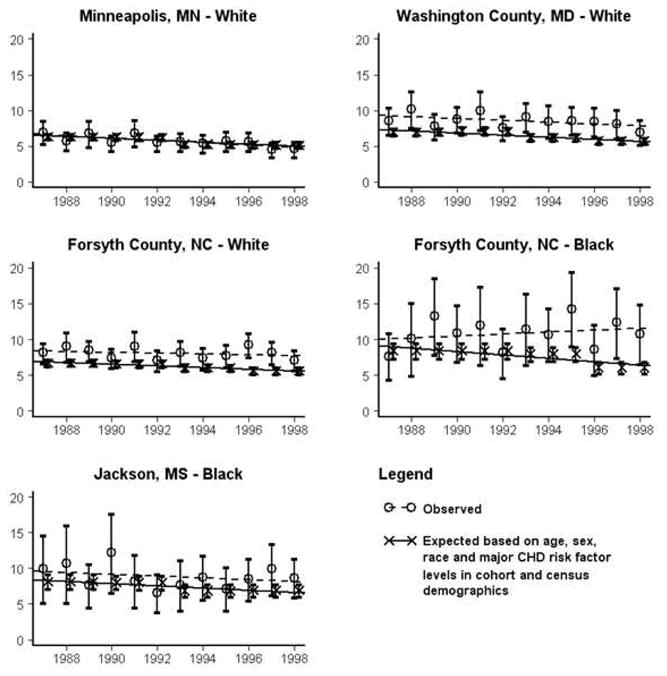
Confidence intervals are generated using ±1.96*SD for the observed and are the bootstrapped 2.5% and 97.5% quartiles for the modeled values.
Figure 3. Observed and Expected CHD Death Rates per 100,000 Person Years by Calendar Year and ARIC Study Center Group.
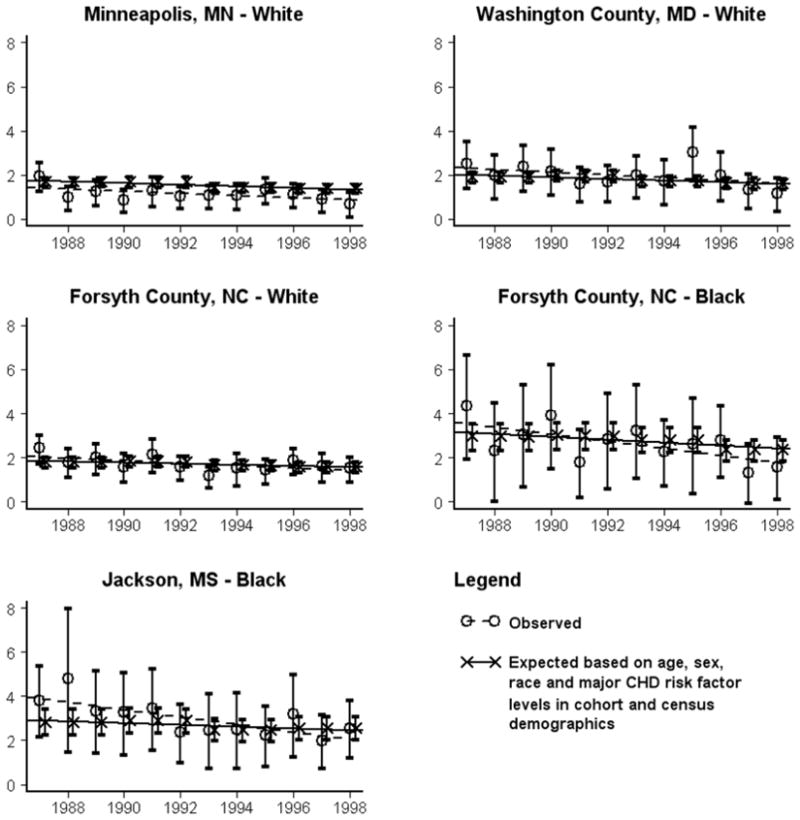
Confidence intervals are generated using ±1.96*SD for the observed and are the bootstrapped 2.5% and 97.5% quartiles for the modeled values.
The expected annual percent change (Table 2) for all CHD events and CHD deaths only was relatively small (0 to −0.3% per year) when based only on age, sex and race. However, when risk factor levels were included, expected declines rose to between 2 to 3.2% per year. A similar pattern of little expected change when based only on age, sex and race was observed in CHD deaths, with a corresponding increase in the expected change when risk factor levels were included. For CHD death, the expected change using the risk factor levels ranged from 59% to 27% of the observed change (i.e. an observed to expected ratio of 1.7 to 3.7). For all CHD events, the expected change was 83% to 333% of the observed change, or an observed to expected ratio of 1.2 to 0.3, not including the Forsyth County Black community due to opposite directions in the expected (−3.2%) and observed (1.4%) changes.
Table 2.
Annual Percent Change in Coronary Heart Disease Events per 100,000 Person Years
| Observed | Expected | Expected (demographic only) | |||
|---|---|---|---|---|---|
| Change (SE) | Change (SE) | Observed/ Expected | Change (SE) | Observed /Expected | |
| All CHD Events | |||||
| Minneapolis White | −2.9 (0.8) | −2.4 (0.4) | 1.2 | −0.30 (0.01) | 9.7 |
| Washington Co. White | −1.5 (0.8) | −2.3 (0.3) | 0.7 | −0.13 (0.01) | 11.5 |
| Forsyth Co. White | −0.7 (0.8) | −2.0 (0.2) | 0.3 | −0.18 (0.01) | 3.8 |
| Forsyth Co. Black | +1.4 (1.6) | −3.2 (0.7) | N/A | 0.00 (0.01) | N/A |
| Jackson Black | −1.3 (1.5) | −2.0. (0.3) | 0.7 | −0.04 (<0.01) | 29.2 |
| CHD Death Only | |||||
| Minneapolis White | −3.9 (1.9) | −2.4 (0.4) | 1.7 | −0.43 (0.02) | 9.2 |
| Washington Co. White | −3.9 (2.0) | −2.0 (0.4) | 2.0 | −0.24 (0.02) | 15.9 |
| Forsyth Co. White | −3.0 (1.4) | −1.6 (0.2) | 1.9 | −0.28 (0.03) | 10.3 |
| Forsyth Co. Black | −6.3 (2.4) | −2.4 (0.5) | 2.6 | −0.11 (0.01) | 59.4 |
| Jackson Black | −5.4 (1.4) | −1.5 (0.4) | 3.7 | −0.17 (0.01) | 32.0 |
A more finely detailed comparison of the ratio of the observed to expected number of CHD events and CHD deaths over all groups is presented in Table 3. For total CHD events, there was strong evidence for the observed rate being larger than the expected rate for each community (Washington County, 26%; Forsyth whites, 25%; Forsyth blacks, 36%; and Jackson, 13%) except Minneapolis. The ratio of observed to expected rates was slightly greater with increasing age and there was no evidence of a difference in the ratio of observed to expected by gender, nor by calendar year, except in the Forsyth County black population. This suggests that in four of the five groups, the slopes of the expected and observed values are similar over time. When CHD deaths were used as the outcome, the only community with a disparity in the ratio of observed and expected rates was Minneapolis, where observed rates were 31% lower than expected. Additionally, women had 18% higher observed rates than expected, while observed annual rates of change of CHD death were similar to expected in all groups.
Table 3.
Estimated Ratio of Observed to Expected Coronary Heart Disease (CHD) Events for 53–64 Year Olds
| All CHD Events | CHD Deaths Only | |||
|---|---|---|---|---|
| Ratio | 95% CI | Ratio | 95% CI | |
| Minneapolis White | 0.96 | (0.88 – 1.05) | 0.69 | (0.59 – 0.80) |
| Washington Co. White | 1.26 | (1.15 – 1.39) | 1.01 | (0.86 – 1.17) |
| Forsyth Co. White | 1.25 | (1.16 – 1.35) | 0.94 | (0.83 – 1.07) |
| Forsyth Co. Black | 1.36 | (1.20 – 1.54) | 0.89 | (0.72 – 1.07) |
| Jackson Black | 1.13 | (1.00 – 1.28) | 1.02 | (0.93 – 1.20) |
| Calendar Year for Minneapolis White | 0.98 | (0.86 – 1.11) | 0.91 | (0.73 – 1.13) |
| Calendar Year for Washington Co. White | 1.04 | (0.92 – 1.18) | 0.93 | (0.76 – 1.15) |
| Calendar Year for Forsyth Co. White | 1.07 | (0.97 – 1.18) | 0.92 | (0.78 – 1.09) |
| Calendar Year for Forsyth Co. Black | 1.26 | (1.06 – 1.51) | 0.83 | (0.63 – 1.09) |
| Calendar Year for Jackson Black | 1.04 | (0.88 – 1.23) | 0.82 | (0.66 – 1.03) |
| Age (per 5 year increase) | 1.01 | (1.00 – 1.02) | 1.02 | (0.93 – 1.12) |
| Female | 1.07 | (0.98 – 1.16) | 1.18 | (1.03 – 1.35) |
DISCUSSION
We found that rates of CHD events calculated from cohort risk factor information were lower than the observed rates in most of the source communities. However, the slopes of the observed and expected CHD rates were similar over time. Further, CHD death was well predicted in most of the communities. These results suggest that traditional individual level risk factor information from a cohort can provide predicted CHD event and CHD death rates that are useful indicators of trends expected from community surveillance but that prediction of absolute rates is less reliable.
These results confirm previous studies showing that aggregate risk factor changes track with expected CHD mortality and mortality changes.(4) Since a single model of event rates was used in our study across visits and communities, differences in the expected rates over time and across communities are driven by differences in the risk factor distributions. Our findings also support Ford and colleagues suggestion that approximately half the decline in CHD death was due to changing risk factors.(3) However, for all CHD events, the estimated decline in events was greater than the observed decline, suggesting that risk factor changes may be overly optimistic in predicting CHD morbidity change.
Our results add to the previous literature in examining variability across populations as well. While previous studies have found weak associations of individual baseline risk factors with CHD mortality (15, 16) we found no evidence that the expected CHD mortality based on combined risk factor levels was different from the observed mortality in four out of our five groups. However, we did see substantial evidence that the expected combined CHD events were different from the observed in four of five groups.
The findings build on the combination of strengths in the data, including the ability to compare across four different geographic areas as well as two racial groups. The availability of multiple sources of prospective data collection, including adjudicated surveillance of fatal and non-fatal CHD events for the entire community, allowed us to examine all CHD events rather than focusing primarily on mortality, while the collection of risk factor data at multiple time points allowed for flexibility in the modeling strategies used. Using the combined cohort and surveillance offers additional information over an ecological analysis in which the relationship between the risk factors and outcomes is unknown on an individual level, as well as additional information over only a cohort design in which the relationship of the cohort to the larger source population is unknown.
This study makes two main assumptions. First, it assumes that the risk factor distribution in the community is the same as the distribution in the cohort, conditioned on age, gender and ethnic distribution. This assumption, while strong, is not unreasonable. The cohort was chosen and recruited to represent the community at the time of enrollment and response rate for the clinic visit varied from 67% of identified eligible participants in Minnesota to 46% in Jackson.(17) While this response rate is within the range reported in similar multi-center studies (4), participants were more likely to have completed high school, have a higher income, not currently smoke, report excellent health (white men and women and black men), have hypertension (black men) and have high cholesterol.(17) However, the mean total cholesterol levels in the black cohort members somewhat higher than would be expected relative to the white cohort members based on patterns seen in national cross-sectional surveys (1). This relatively healthy cohort may explain why observed rates of MI were higher than expected at the beginning of the study period. However the persistence of the difference between expected and observed is perhaps less expected, as the healthy cohort effect might have been expected to diminish over time. Retention rates in the cohort for each of the four visits ranged from 93 to 81% and overall five year migration rates were low (5 to11% in 1990 and 1 to 9% in 2000). Aside from the Forsyth County black community, the consistency of the change over time for expected and observed rates suggests that the migration patterns were not a strong influence on these results.
The second assumption is that the relationships between the risk factors and the likelihood of a CHD event observed in the cohort are the same in the reference community cohort. While it is highly plausible that the total relationships are not identical, the assumption of some biologically consistent component seems reasonable. This assumption of biological consistency is used in the wide application of the Framingham risk score (18) and other risk scores in clinical practice and has been confirmed in studies which compare the relative hazard for each risk factor across populations.(16, 19) Participation in the study itself might also dilute the effect of risk factors, as participants might be more likely to get treatment for elevated risk factors than non-participants.
In conclusion, total CHD incidence declined by 1 to 3% per year and CHD mortality declined by 3 to 6% per year over the study period among 53–64 year old men and women in all ARIC communities except the Forsythe County black community, where the CHD incidence increased. CHD risk factor trends within each community predicted a decline of 2 to 3% per year in both CHD incidence and mortality. Overall, CHD rates parallel the trends in expected rates based on cohort risk factors but declines in mortality were steeper than expected, particularly among blacks.
Acknowledgments
Funding: The Atherosclerosis Risk in Communities Study was supported by the National Heart Lung and Blood Institute [contract numbers N01-HC-55015, N01-HC-55016, N01-HC-55018, N01-HC-55019, N01-HC-55020, N01-HC-55021, and N01-HC-55022]. Dr. Paynter was supported by the National Heart Lung and Blood Institute [training grant number T32HL07024].
Footnotes
Publisher's Disclaimer: This is a PDF file of an unedited manuscript that has been accepted for publication. As a service to our customers we are providing this early version of the manuscript. The manuscript will undergo copyediting, typesetting, and review of the resulting proof before it is published in its final citable form. Please note that during the production process errors may be discovered which could affect the content, and all legal disclaimers that apply to the journal pertain.
References
- 1.Rosamond W, Flegal K, Furie K, et al. Heart Disease and Stroke Statistics--2008 Update: A Report From the American Heart Association Statistics Committee and Stroke Statistics Subcommittee. Circulation. 2008;117(4):e25–146. doi: 10.1161/CIRCULATIONAHA.107.187998. [DOI] [PubMed] [Google Scholar]
- 2.U.S. Department of Health and Human Services. Healthy People 2010: Understanding and Improving Health. Washington, D.C: U.S. Government Printing Office; 2000. [Google Scholar]
- 3.Ford ES, Ajani UA, Croft JB, et al. Explaining the decrease in U.S. deaths from coronary disease, 1980–2000. The New England Journal of Medicine. 2007;356(23):2388–2398. doi: 10.1056/NEJMsa053935. [DOI] [PubMed] [Google Scholar]
- 4.Kuulasmaa K, Tunstall-Pedoe H, Dobson A, et al. Estimation of contribution of changes in classic risk factors to trends in coronary-event rates across the WHO MONICA Project populations. Lancet. 2000;355(9205):675–687. doi: 10.1016/s0140-6736(99)11180-2. [DOI] [PubMed] [Google Scholar]
- 5.The Atherosclerosis Risk in Communities (ARIC) Study: design and objectives. The ARIC investigators. American Journal of Epidemiology. 1989;129(4):687–702. [PubMed] [Google Scholar]
- 6.National Heart Lung and Blood Institute. Atherosclerosis Risk in Communities (ARIC) Study. Operations Manual no. 2: Cohort Component Procedures. Version 1.0. Chapel Hill, NC: ARIC Coordinating Center, School of Public Health, Unversity of North Carolina; 1987. [Google Scholar]
- 7.National Heart Lung and Blood Institute. Atherosclerosis Risk in Communities (ARIC) Study. Operations Manual no. 3: Surveillance Component Procedures. Version 1.0. Chapel Hill, NC: ARIC Coordinating Center, School of Public Health, Unversity of North Carolina; 1987. [Google Scholar]
- 8.White AD, Folsom AR, Chambless LE, et al. Community surveillance of coronary heart disease in the Atherosclerosis Risk in Communities (ARIC) Study: methods and initial two years' experience. J Clin Epidemiol. 1996;49(2):223–233. doi: 10.1016/0895-4356(95)00041-0. [DOI] [PubMed] [Google Scholar]
- 9.Rosamond WD, Chambless LE, Folsom AR, et al. Trends in the incidence of myocardial infarction and in mortality due to coronary heart disease, 1987 to 1994. N Engl J Med. 1998;339(13):861–7. doi: 10.1056/NEJM199809243391301. [DOI] [PubMed] [Google Scholar]
- 10.Rosamond WD, Folsom AR, Chambless LE, Wang CH. Coronary heart disease trends in four United States communities. The Atherosclerosis Risk in Communities (ARIC) study 1987–1996. International Journal of Epidemiology. 2001;30 (Suppl 1):S17–S22. doi: 10.1093/ije/30.suppl_1.s17. [DOI] [PubMed] [Google Scholar]
- 11.Integrated Public Use Microdata Series: Version 3.0 [Machine-readable database] program] Minnesota Population Center [producer and distributor]; 2004. IN FILE. [Google Scholar]
- 12.Siegel JS, Swanson DA, Shryock HS. The methods and materials of demography. Amsterdam: Elsevier/Academic Press; 2004. [Google Scholar]
- 13.Efron B, Tibshirani R. An introduction to the bootstrap. New York: Chapman & Hall; 1993. Monographs on statistics and applied probability) [Google Scholar]
- 14.Breslow NE, Day NE. Statistical Methods in Cancer Research: Volume II: The Design and Analysis of Cohort Studies. USA: Oxford University Press; 1994. [PubMed] [Google Scholar]
- 15.Ecological analysis of the association between mortality and major risk factors of cardiovascular disease. The World Health Organization MONICA Project. International Journal of Epidemiology. 1994;23(3):505–516. doi: 10.1093/ije/23.3.505. [DOI] [PubMed] [Google Scholar]
- 16.Keys A, Menotti A, Aravanis C, et al. The seven countries study: 2,289 deaths in 15 years. Prev Med. 1984;13(2):141–154. doi: 10.1016/0091-7435(84)90047-1. [DOI] [PubMed] [Google Scholar]
- 17.Jackson R, Chambless LE, Yang K, et al. Differences between respondents and nonrespondents in a multicenter community-based study vary by gender ethnicity. The Atherosclerosis Risk in Communities (ARIC) Study Investigators. J Clin Epidemiol. 1996;49(12):1441–1446. doi: 10.1016/0895-4356(95)00047-x. [DOI] [PubMed] [Google Scholar]
- 18.Wilson PWF, D'Agostino RB, Levy D, Belanger AM, Silbershatz H, Kannel WB. Prediction of Coronary Heart Disease Using Risk Factor Categories. Circulation. 1998;97(18):1837–1847. doi: 10.1161/01.cir.97.18.1837. [DOI] [PubMed] [Google Scholar]
- 19.D'Agostino RB, Sr, Grundy S, Sullivan LM, Wilson P. Validation of the Framingham coronary heart disease prediction scores: results of a multiple ethnic groups investigation. JAMA: The Journal of the American Medical Association. 2001;286(2):180–187. doi: 10.1001/jama.286.2.180. [DOI] [PubMed] [Google Scholar]