

Abstract
This study aims to examine the impact of socio-ecologic factors on the transmission of Ross River virus (RRV) infection and to identify areas prone to social and ecologic-driven epidemics in Queensland, Australia. We used a Bayesian spatiotemporal conditional autoregressive model to quantify the relationship between monthly variation of RRV incidence and socio-ecologic factors and to determine spatiotemporal patterns. Our results show that the average increase in monthly RRV incidence was 2.4% (95% credible interval (CrI): 0.1–4.5%) and 2.0% (95% CrI: 1.6–2.3%) for a 1°C increase in monthly average maximum temperature and a 10 mm increase in monthly average rainfall, respectively. A significant spatiotemporal variation and interactive effect between temperature and rainfall on RRV incidence were found. No association between Socio-economic Index for Areas (SEIFA) and RRV was observed. The transmission of RRV in Queensland, Australia appeared to be primarily driven by ecologic variables rather than social factors.
Introduction
Ross River virus (RRV) infection is the most common and widerspread mosquito-borne disease in Australia and some Pacific island nations.1,2 Nearly 40 species of mosquitoes belonging to six genera have been confirmed as vectors of RRV in Australia.2 Ochlerotatus vigilax and Culex annulirostris are probably the major vectors of RRV in Queensland.3 Over the last 16 years (1993–2008), 68,538 laboratory-confirmed RRV cases have been reported to the Australian Department of Health and Ageing.4 Ross River virus causes a nonfatal but debilitating disease characterized by arthritis, rash, fever, fatigue, and myalgia.2,5 Geographically scattered RRV cases are usually recorded throughout the year, with the majority of cases in the period from January to May. As the distribution of RRV varies with time and place, it is important to examine the impact of socio-ecologic factors on the transmission of RRV infection for the purposes of targeted surveillance and risk management.
Methods for displaying, analyzing, and predicting spatial and temporal distributions of diseases have been considerably advanced over the last two decades. Bayesian spatiotemporal models provide a flexible and robust approach for spatiotemporal analysis and disease mapping.6 Bayesian conditional autoregressive (CAR) models are increasingly being used to estimate spatial variation in disease risk between spatially aggregated units, such as the administrative divisions of a country.7,8 These models offer convenient platforms for incorporating and estimating spatial correlation while simultaneously estimating covariate effects. Recently, Bayesian spatiotemporal models have been used to study the geographical distribution of tropical diseases including malaria, schistosomiasis, and filariasis.7,9,10
A number of studies showed the relationship between the incidence of RRV disease and weather variables (temperature, rainfall, humidity, southern oscillation index, and sea level) but not in an explicitly spatiotemporal context.11–17 In this study, we used Bayesian spatiotemporal analysis to describe associations between monthly RRV incidence and socio-ecologic factors and to examine their potential impact on the transmission of RRV in Queensland, Australia.
Materials and Methods
Study area.
Queensland, located in the northeast of Australia, covers ~1,727,000 km2, with 7,400 km of mainland coastline (9,800 km including islands). It has a typically sub-tropical climate with average temperatures of 25°C in summer and 15°C in winter. Rainfall varies regionally and seasonally, ranging from < 150 mm per annum in the southwest region to > 4,000 mm per annum on the far northern coast. Queensland consists of 125 statistical local government areas (LGA), with populations ranging from 312 to 888,449 people.
Data collection.
We obtained the data from the Queensland Department of Health on numbers of notified RRV cases by LGA for the period January 1, 1999–December 31, 2001. Because RRV is a notifiable disease, it is a legal requirement that positive test results are reported by laboratories to the Queensland Department of Health, where data are archived by the Communicable Diseases Unit. The requirement for notification of RRV disease is based on a demonstration of a 4-fold or greater change in serum antibody titers between acute and convalescent phase serum, isolation of RRV or demonstration of arboviral antigen or genome in the blood.18 However, in practice; most notifications are based on single tests showing immunoglobulin M (IgM) using an enzyme-linked immunosorbent assay (ELISA) technique. These case notification data were linked to a digital base-map of LGAs in a geographical information system (GIS). Weather and Socio-economic Index for Areas (SEIFA) data were obtained for the same period from the Australian Bureau of Meteorology and the Australian Bureau of Statistics, respectively. The SEIFA is a continuum of socio-economic advantage (high values) to disadvantage (low values) and takes into account variables relating to education, occupation, wealth, and living conditions. The SEIFA allows ranking of regions/areas, providing a method of determining the level of social and economic well being in each region. Weather data contained interpolated monthly mean maximum temperature (°C) and monthly precipitation (mm), which were available at a 0.25 × 0.25 degree grid resolution (about 30 × 30 km at the equator). Average temperature and rainfall values for each LGA and month were extracted using the GIS software package Vertical Map.19 Relevant population data and electronic boundaries of LGAs were retrieved from the national census database managed by the Australia Bureau of Statistics.
Data analysis.
An initial descriptive analysis of RRV was performed. Crude standardized morbidity ratios (SMRs) for each LGA for the entire study period were calculated using standard methods,20 where SMR = (the observed number of RRV cases)/(the expected number of RRV cases). Five Poisson regression models were developed in a Bayesian framework, using the WinBUGS software version 1.4.21 Model I, including only rainfall, temperature, and SEIFA as explanatory variables; Model II, adding an interaction term for temperature and rainfall; Model III, incorporating a random effect for LGA; Model IV adding a LGA spatial random effect and LGA-specific temporal trends; and Model V, adding a seasonally oscillating temporal random effect. The mathematical notation for Model V is presented below, and contains all of the components of the preceding four models. This model assumed that the observed counts of cases (Okt) for the kth LGA (k = 1…125) in the tth month (1999–2001) follow a Poisson distribution with mean (μkt), that is,
 |
and
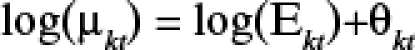 |
where Ekt (the expected number of cases in LGA k, month t) is an offset to control for population size. The logarithm of the mean rate of RRV per LGA per month was modeled as
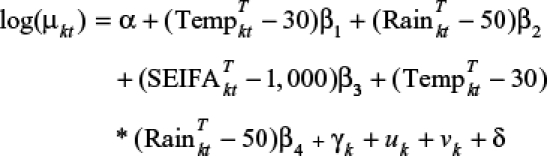 |
where α is the intercept, β1 is the coefficient for temperature, β2 is the coefficient for rainfall, β3 is the coefficient for SEIFA, β4 is the interaction coefficient of temperature and rainfall, γ is the LGA-level temporal trend coefficient, u is LGA-level variation that is spatially structured (i.e., spatially-structured factors not explained by the model covariates), and v is spatially unstructured LGA-level variation; δ is the amplitude of seasonal oscillation in the month-specific random effects, which was modeled by a sinusoidal term cosine(2π·t/12). Spatial structuring in u was modeled using CAR prior structure, with spatial relationships between LGAs modeled using an adjacency weights matrix.20 This approach allows for formal assessment of spatial clustering in the number of reported cases of RRV by LGA. The centering method was used to cope with the multicollinearity between the interaction term and predictors. Centering involves subtracting a constant (the constant is often a mean, but it can be any value) from every observation's value of a predictor variable and then running the model on the centered data.22 In this study, we used the near mean-centering method, which can provide a more meaningful interpretation.
Parameter estimation was obtained by Markov Chain Monte Carlo simulation (MCMC) employing a single chain algorithm. We undertook an initial burn-in of 5,000 iterations, which were subsequently discarded. Convergence was assessed by examining posterior density plots, history plots, and autocorrelation of selected parameters. A subsequent set of 20,000 iterations was used for estimation. Model selection was conducted using the deviance information criterion (DIC), where a lower DIC suggests a better trade-off between model fit and parsimony.
Results
Table 1 shows the summary statistics for each variable. The monthly mean of number of RRV cases, maximum temperature, rainfall, and SEIFA was 12.59, 28.26°C, 689.01 mm, and 935.61, respectively, from January 1999 to December 2001.
Table 1.
Descriptive statistics of Ross river virus (RRV) and socio-ecologic factors by local government areas (LGA) in Queensland, January 1999–December 2001
| Mean | Minimum | Maximum | Percentile | |||
|---|---|---|---|---|---|---|
| 25% | 50% | 75% | ||||
| Number of RRV cases* | 12.59 | 0 | 324 | 1 | 3 | 10.5 |
| Spring | 0.71 | 0 | 10 | 0 | 0 | 1 |
| Summer | 4.08 | 0 | 72 | 0 | 1 | 3 |
| Autumn | 6.62 | 0 | 213 | 0 | 1 | 4 |
| Winter | 1.18 | 0 | 29 | 0 | 0 | 1 |
| Temperature (°C) | 28.26 | 23.51 | 34.06 | 26.37 | 28.12 | 29.67 |
| Rainfall (mm) | 689.01 | 169.81 | 2602.3 | 457.14 | 620.58 | 786.47 |
| SEIFA | 935.61 | 831.36 | 1059.84 | 909.92 | 930.64 | 962.88 |
| Population | 29226 | 312 | 888449 | 2486.5 | 5421 | 17994 |
Numbers refer to the distribution of values across all LGAs for the entire study period.
Figure 1 depicts the variation over time in RRV numbers in relation to rainfall and temperature. The curves indicate a consistent inter-relation between climate variability and RRV cases.
Figure 1.
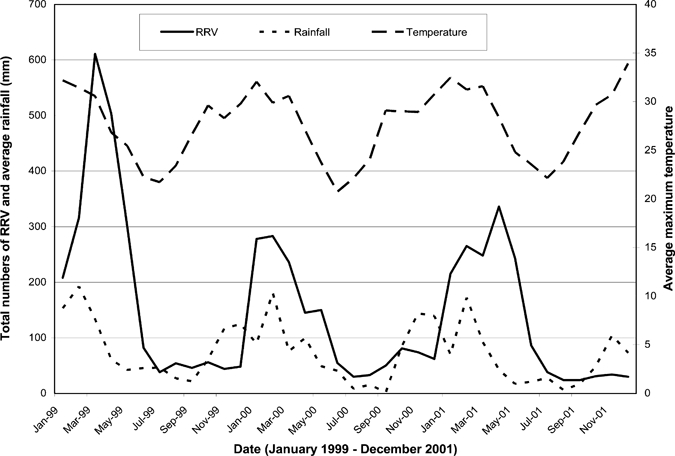
Maximum temperature, rainfall, and incidence of Ross River virus (RRV) by local government areas (LGA) in Queensland, Australia between January 1999 and December 2001.
A pairwise scatter-plot reveals relationships between all the variables (Figure 2). Incidence of RRV was positively associated with rainfall and temperature.
Figure 2.
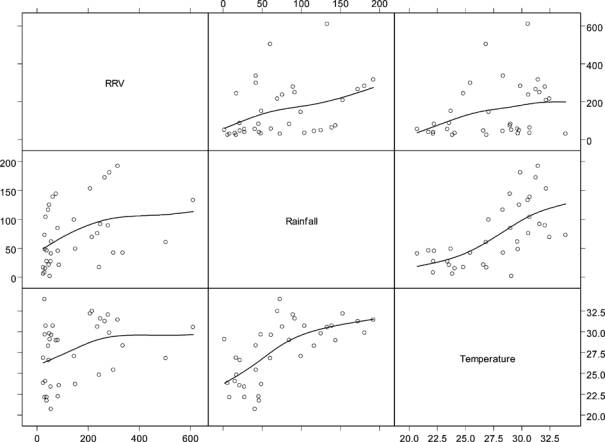
Pairwise scatter plot of smoothed Ross River virus (RRV) incidence rates and explanatory variables.
Figure 3A shows the SMRs of RRV incidence in Queensland by LGA. Although the maps show a high degree of spatial variability, there are also some clear patterns: RRV incidence rates appear to be high in western regions of the state and generally lower toward the coast. Figure 3B–D shows the spatial patterns of rainfall, temperature, and SEIFA in Queensland by LGA. These maps confirm that all these variables varied with geographical location.
Figure 3.
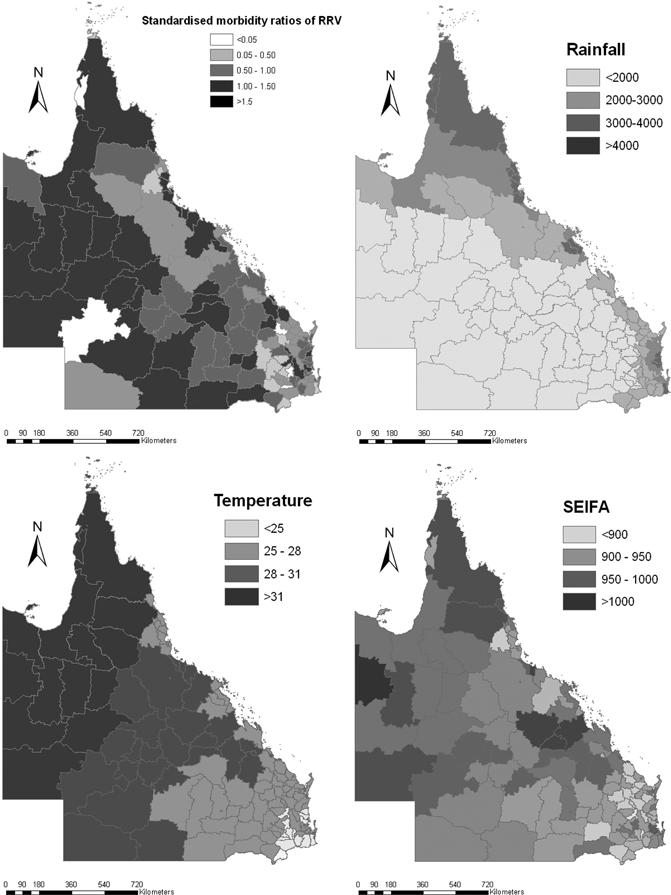
Raw standardized morbidity ratios for Ross River virus (RRV), maximum temperature, rainfall, and Socio-economic Index for Areas (SEIFA) by local government areas (LGA) in Queensland.
Bayesian analyses show that the spatiotemporal model (model V) had the smallest DIC value (9,869) and therefore appeared to be the best among all the models examined (Table 2).
Table 2.
Model comparisons using the deviance information criterion (DIC)
| Models | Types | DIC |
|---|---|---|
| Model I | Rainfall, temperature, and SEIFA | 12752 |
| Model II | Model I plus a climatic interaction term | 12690 |
| Model III | Model II plus a non-spatial random effect | 11949 |
| Model IV | Model III plus a spatial random effect | 11941 |
| Model V | Model IV plus a seasonal oscillation | 9869 |
Table 3 shows that the average increase in monthly RRV incidence rates was 2.4% (95% credible interval (CrI): 0.1–4.5%) and 2.0% (95% CrI: 1.6–2.3%) for a 1°C increase in monthly average maximum temperature, whereas average rainfall equals 50 mm and a 10 mm increase in monthly average rainfall while maximum temperature equals 30°C, respectively. An interactive effect between temperature and rainfall on RRV incidence was found (changes: 0.4%; 95% CrI: 0.3–0.5%). The Bayesian spatiotemporal model shows that spatial variation (u) (changes: 27.2%; 95% CrI: 13–42%) and spatially smoothed LGA-level temporal trend (γ) (changes: 5.4%; 95% CrI: 2.4–8.5%) were significantly associated with RRV transmission (Table 3). However, there was no association between SEIFA and RRV incidence (changes: −0.8%; 95% CrI: −0.3–0.2%).
Table 3.
Changes (%) in relative risks with 95% credible intervals from Bayesian spatiotemporal models of Ross River virus (RRV) in Queensland, Australia*
| Variables | Changes (%) | 95% Credible intervals |
|---|---|---|
| SEIFA | −0.8 | −0.3–0.2 |
| Rainfall (10 mm increase) | 2.0 | 1.6–2.3 |
| Temperature (°C increase) | 2.4 | 0.1–4.5 |
| Rainfall: temperature | 0.4 | 0.3–0.5 |
| Spatial variation (u) | 27.2 | 13–42 |
| Spatially-smoothed LGA-level temporal trend (γ) | 5.4 | 2.4–8.5 |
SEIFA = Socio-Economic Index for Areas; LGA = local government areas.
Figure 4A shows residual variation after taking into account the socio-ecologic variables. Clusters of high-incidence LGAs were located in inland, western Queensland, whereas clusters of low-incidence LGAs were located in southeast coastal Queensland. Figure 4B shows that clusters of LGAs with higher than average temporal trend were also located in inland areas. Clusters of LGAs in western and north-eastern Queensland show an increasing trend in RRV incidence. The clusters of LGAs with lower than average temporal trend were interspersed throughout the state.
Figure 4.
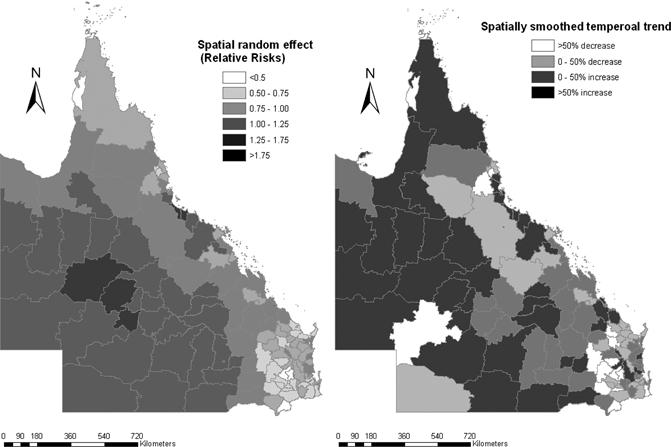
Spatial random effects and spatial smoothed trend for Ross River virus (RRV) incidence rates.
Figure 5 indicates that relative risks of RRV were clearly associated with the interaction between maximum temperature and rainfall.
Figure 5.
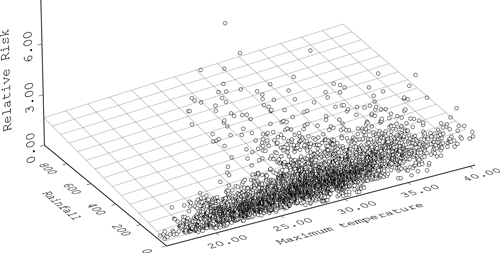
The interactive effect between rainfall and maximum temperature on Ross River virus (RRV).
Discussion
Our results show that temperature and rainfall were consistently and positively associated with RRV incidence at LGA level. These ecological factors seemed to have played an important role in RRV transmission cycles. Our models provide some novel information about RRV epidemiology in Queensland.
Rainfall is a key driver in the transmission of mosquito-borne diseases including RRV infection.12,23 All mosquitoes have aquatic larval and pupal stages and therefore require water for breeding.24 Considerable evidence has accrued to show that rainfall and flooding can lead to increased mosquito breeding and outbreaks of arboviral disease,23,24 including RRV in various parts of Australia.11,23 The finding of this detailed spatiotemporal analysis corroborates previous observations that rainfall is one of the key predictors of RRV transmission.11
Temperature changes affect RRV transmission and epidemic potential by altering the vector's reproduction or biting rate; by shifting a vector's geographic range or distribution; by altering the extrinsic incubation periods (EIPs) of the pathogen; and by increasing or decreasing vector-pathogen-host interaction and thereby affecting host susceptibility.25 Warmer temperatures may allow mosquitoes such as Cx. annulirostris and Ochlerotatus (formerly Aedes) vigilax to reach maturity much faster than at lower temperatures.26 Our previous study has clearly shown that Ochlerotatus vigilax and Culex annulirostris are two major mosquito species associated with RRV transmission.27
People with lower levels of education and/or income often have poor health knowledge about disease transmission and personal protection from a mosquito biting.28 However, in this study, we found that the average SEIFA in LGA had no substantive association with RRV disease in Queensland, suggesting that SEIFA levels may be more heterogenous and/or may not be an important factor at the LGA level. The SEIFA scores can be used to rank geographic areas across Australia in terms of their socio-economic characteristics. Some research shows that SEIFA scores correlate with the proportion of people living in an area who report poor health and other health risk factors.29,30 However, SEIFA scores are area-level indices that should not be presumed to apply to individuals living within the area. The SEIFA scores are calculated at the census district level and great care is required when interpreting scores that have been aggregated to larger geographical areas.30 People living in low-SEIFA areas have similar medical services by general practitioners with a high level of SEIFA.31
This study has three major strengths. First, a sophisticated Bayesian spatiotemporal model was used to examine the potential impact of socio-ecologic factors on the transmission of RRV infection in Queensland, Australia. This model assessed both spatial and temporal trends, and some previous research suggests that failure to account for spatiotemporal correlation in the data can lead to biased estimates.32 Second, comprehensive and detailed information on socio-ecologic factors by LGA was linked across the entire state, and incorporated into the statistical models. This may provide a novel approach to assessing disease risk factors.33,34 Finally, research outcomes from this study and other researches may have important implications for public health decision making in the control and prevention of RRV infection.12,14,15,27,35–38
The limitations of this study must also be acknowledged. First, under the Notifiable Diseases Surveillance System, the LGA of onset is assumed as the place where acquisition of infection occurred. Although the reported place of onset (mostly home address) for each case is often used for determining the geographic origin of RRV infection,39 this assumption may not hold for all cases, particularly during holiday periods. Second, this is a spatiotemporal assessment of the relationship between socio-ecologic variability and the transmission of RRV at the LGA level and the findings cannot be related to an individual's risk of infection. More detailed information at the community and individual level (e.g., mosquito population densities, human behaviors, population immunity, and housing characteristics) could eventually be included to further improve the models. However, such data were unavailable for most LGAs at the current time.
In conclusion, because RRV has already had marked impacts on population health, industry, and tourism, it is important to develop an epidemic forecast system for this disease. The results of this study reveal significant and positive effects of temperature and rainfall and their synergistic impact on the spatiotemporal patterns of RRV transmission. The disease surveillance data can be integrated with social, biological, and environmental databases to explain and potentially predict disease risks. These data can provide additional input into the development of epidemic forecasting models.40,41 These attempts may have significant implications in environmental health decision making and practices, and may help health authorities to use limited resources more effectively and efficiently.
Acknowledgments
We thank the Queensland Department of Health, Australian Bureau of Meteorology, and Australian Bureau of Statistics for providing the data on notified RRV cases, climate, and population growth, respectively. The authors thank Dr. Adrian Barnett for his valuable statistical advice.
Footnotes
Financial support: National Health and Medical Research Council, Australia (no. 519788)
Authors' addresses: Wenbiao Hu and Gail Williams, School of Population Health, The University of Queensland, Queensland, Australia, E-mails: w.hu@sph.uq.edu.au and g.willims@sph.uq.edu.au. Archie Clements, School of Population Health, The University of Queensland, Queensland, Australia and Australian Centre for International and Tropical Health, Queensland Institute of Medical Research, Queensland, Australia, E-mail: a.clements@sph.uq.edu.au. Shilu Tong, School of Public Health, Queensland University of Technology, Queensland, Australia, E-mail: s.tong@qut.edu.au. Kerrie Mengersen, School of Mathematical Sciences, Queensland University of Technology, Queensland, Australia, E-mail: k.mengersen@qut.edu.au.
References
- 1.Russell R. Vectors versus humans in Australia–who is on top down under? An update on vector-borne disease and research on vectors in Australia. J Vector Ecol. 1998;23:1–46. [PubMed] [Google Scholar]
- 2.Mackenzie J, Lindsay M, Coelen R, Broom A, Hall R, Smith D. Arboviruses causing human disease in the Australasian zoogeographic region. Arch Virol. 1994;136:447–467. doi: 10.1007/BF01321074. [DOI] [PubMed] [Google Scholar]
- 3.Russell R. Arboviruses and their vectors in Australia: an update on the ecology and epidemiology of some mosquito-borne arboviruses. Med Vet Entomol. 1995;83:141–158. [Google Scholar]
- 4.Australian Department of Health and Aged Care National Notifiable Diseases Surveillance System. 2008. http://www9.health.gov.au/cda/Source/CDA-index.cfm Available at. Accessed July 31, 2009.
- 5.Curran M, Harvey B, Crerar S, Oliver G, D'souza R, Myint H, Rann C, Andrews R. Australia's notifiable disease status, 1996. Annual report of the national notifiable disease surveillance system. Commun Dis Intell. 1997;21:281–307. [PubMed] [Google Scholar]
- 6.Best N, Richardson S, Thomson A. A comparison of Bayesian spatial models for disease mapping. Stat Methods Med Res. 2005;14:35–39. doi: 10.1191/0962280205sm388oa. [DOI] [PubMed] [Google Scholar]
- 7.Mabaso M, Vounatsou P, Midzi S, Silva J, Smith T. Spatio-temporal analysis of the role of climate in inter-annual variation of malaria incidence in Zimbabwe. Int J Health Geogr. 2006;5:20. doi: 10.1186/1476-072X-5-20. [DOI] [PMC free article] [PubMed] [Google Scholar]
- 8.Escaramis G, Carrasco J, Ascaso C. Detection of significant disease risks using a spatial conditional autoregressive model. Biometrics. 2007;64:1043–1053. doi: 10.1111/j.1541-0420.2007.00981.x. [DOI] [PubMed] [Google Scholar]
- 9.Yang G, Vounatsou P, Zhou X, Tanner M, Utzinger J. A Bayesian-based approach for spatio-temporal modeling of county level prevalence of Schistosoma japonicum infection in Jiangsu province, China. Int J Parasitol. 2005;35:155–162. doi: 10.1016/j.ijpara.2004.11.002. [DOI] [PubMed] [Google Scholar]
- 10.Clements A, Lwambo N, Blair L, Nyandindi U, Kaatano G, Kinung'hi S, Webster J, Fenwick A, Brooker S. Bayesian spatial analysis and disease mapping: tools to enhance planning and implementation of a schistosomiasis control programme in Tanzania. Trop Med Int Health. 2006;11:490–503. doi: 10.1111/j.1365-3156.2006.01594.x. [DOI] [PMC free article] [PubMed] [Google Scholar]
- 11.Hu W, Nicholls N, Lindsay M, Dale P, McMichael A, Mackenzie J, Tong S. Development of a predictive model for Ross River virus disease in Brisbane, Australia. Am J Trop Med Hyg. 2004;71:129–137. [PubMed] [Google Scholar]
- 12.Hu W, Tong S, Mengersen K, Oldenburg B. Rainfall, mosquito density and transmission of Ross River virus: a time-series forecasting model. Ecol Modell. 2006;196:505–514. [Google Scholar]
- 13.Tong S, Bi P, Donald K, McMichael A. Climate variability and Ross River virus transmission. J Epidemiol Community Health. 2002;56:617–621. doi: 10.1136/jech.56.8.617. [DOI] [PMC free article] [PubMed] [Google Scholar]
- 14.Tong S, Hu W, McMichael A. Climate variability and Ross River virus transmission in Townsville region, Australia, 1985–1996. Trop Med Int Health. 2004;9:298–304. doi: 10.1046/j.1365-3156.2003.01175.x. [DOI] [PubMed] [Google Scholar]
- 15.Tong S, Hu W, Nicholls N, Dale P, Mackenzie J, Patz J, McMichael A. Climatic, high tide and vector variables and the transmission of Ross River virus. Intern Med J. 2005;35:677–680. doi: 10.1111/j.1445-5994.2005.00935.x. [DOI] [PubMed] [Google Scholar]
- 16.Tong S, Hu W. Climate variation and incidence of Ross River virus in Cairns, Australia: a time series analysis. Environ Health Perspect. 2001;109:1271–1273. doi: 10.1289/ehp.011091271. [DOI] [PMC free article] [PubMed] [Google Scholar]
- 17.Tong S, Bi P, Parton K, Hobbs J, McMichael A. Climate variability and transmission of epidemic polyarthritis. Lancet. 1998;351:1100. doi: 10.1016/S0140-6736(05)79379-X. [DOI] [PubMed] [Google Scholar]
- 18.Rich G, McKechnie J, McPhan I, Richards B. Laboratory diagnosis of Ross River virus infection. Commun Dis Intell. 1993;17:103–107. [Google Scholar]
- 19.MapInfo Corporation . MapInfo professional software 7.0. New York: 2003. [Google Scholar]
- 20.Lawson A, Browne W, Vidal Rodeiro C. Disease Mapping with WinBUGS and MLwiN. England: John Wiley & Sons, Ltd.; 2003. [Google Scholar]
- 21.WinBUGs . MRC Biostatistics Unit, Cambridge, UK. London, UK: Imperial College; 2008. [Google Scholar]
- 22.Chatterjee S, Hadi A. Regression Analysis by Example. Hoboken, NJ: John Wiley & Sons, Inc; 2006. [Google Scholar]
- 23.Liehne P. Climatic Influences on Mosquito-borne Diseases in Australia. Australia: CSIRO.; 1998. [Google Scholar]
- 24.McMichael A, Haines A, Kovats R, Slooff R. Climate Changes and Human Health. Geneva: WHO.; 1996. [Google Scholar]
- 25.McManus T, Russell R, Wells P, Clancy J, Fennell M, Cloonan M. Further studies on the epidemiology and effects of Ross River virus in Tasmania. Arbovirus Res Aust. 1992;6:68–72. [Google Scholar]
- 26.Lindsay M, Mackenzie J, Condon R. In: Health in the Greenhouse: The Medical and Environmental Health Effects of Global Climate Change. Ewan C, editor. Canberra: AGPS; 1993. pp. 85–100. (Ross River virus outbreaks in western Australia: epidemiological aspects and the role of environmental factors). [Google Scholar]
- 27.Hu W, Tong S, Mengersen K, Oldenburg B, Dale P. Mosquito species (Diptera: Culicidae) and the transmission of Ross River virus in Brisbane, Australia. J Med Entomol. 2006;43:375–381. doi: 10.1603/0022-2585(2006)043[0375:msdcat]2.0.co;2. [DOI] [PubMed] [Google Scholar]
- 28.Hu W, Tong S, Mengersen K, Oldenburg B. Exploratory spatial analysis of social and environmental factors associated with the incidence of Ross River virus in Brisbane, Australia. Am J Trop Med Hyg. 2007;76:814–819. [PubMed] [Google Scholar]
- 29.McCracken K. Into a SEIFA SES cul-de-sac? Aust N Z J Public Health. 2001;25:305–306. doi: 10.1111/j.1467-842x.2001.tb00584.x. [DOI] [PubMed] [Google Scholar]
- 30.Adhikari P. Socio-Economic Indexes for Areas: Introduction, Use and Future Directions. Canberra: Australian Bureau of Statistics; 2006. pp. 1–37. [Google Scholar]
- 31.Wilkinson D, McElroy H, Beilby J, Mott K, Price K, Morey S, Best J. Are socio-economically disadvantaged Australians making more or less use of the Enhanced Primary Care Medicare Benefit Schedule item numbers? Aust Health Rev. 2003;26:43–49. doi: 10.1071/ah030043b. [DOI] [PubMed] [Google Scholar]
- 32.Anselin L. Exploring Spatial Data with GeoDa: A Workbook. Urbana, IL: University of Illinois; 2005. [Google Scholar]
- 33.Cohen JM, Wilson ML, Aiello AE. Analysis of social epidemiology research on infectious diseases: historical patterns and future opportunities. J Epidemiol Community Health. 2007;61:1021–1027. doi: 10.1136/jech.2006.057216. [DOI] [PMC free article] [PubMed] [Google Scholar]
- 34.Chaves LF, Cohen JM, Pascual M, Wilson ML. Social exclusion modifies climate and deforestation impacts on a vector-borne disease. PLoS Negl Trop Dis. 2008;2:e176. doi: 10.1371/journal.pntd.0000176. [DOI] [PMC free article] [PubMed] [Google Scholar]
- 35.Tong S, Dale P, Nicholls N, Mackenzie J, Wolff R, McMichael A. Climate variability, social and environmental factors, and ross river virus transmission: research development and future research needs. Environ Health Perspect. 2008;116:1591–1597. doi: 10.1289/ehp.11680. [DOI] [PMC free article] [PubMed] [Google Scholar]
- 36.Tong S, Hu W. Different responses of Ross River virus to climate variability between coastline and inland cities in Queensland, Australia. Occup Environ Med. 2002;59:739–744. doi: 10.1136/oem.59.11.739. [DOI] [PMC free article] [PubMed] [Google Scholar]
- 37.Hu W, Tong S, Mengersen K, Oldenburg B, Dale P. Spatial and temporal patterns of Ross River virus in Brisbane, Australia. Arbovirus Res Aust. 2005;9:128–136. [Google Scholar]
- 38.Woodruff R, Guest C, Garner M, Becker N, Lindesay J, Carvan T, Ebi K. Predicting Ross River virus epidemics from regional weather data. Epidemiology. 2002;13:384–393. doi: 10.1097/00001648-200207000-00005. [DOI] [PubMed] [Google Scholar]
- 39.Selden S, Cameron A. Changing epidemiology of Ross River virus disease in south Australia. Med J Aust. 1996;165:313–317. doi: 10.5694/j.1326-5377.1996.tb124989.x. [DOI] [PubMed] [Google Scholar]
- 40.Connor SJ, Thomson MC, Molyneux DH. Forecasting and prevention of epidemic malaria: new perspectives on an old problem. Parassitologia. 1999;41:439–448. [PubMed] [Google Scholar]
- 41.Chaves LF, Pascual M. Comparing models for early warning systems of neglected tropical diseases. PLoS Negl Trop Dis. 2007;1:e33. doi: 10.1371/journal.pntd.0000033. [DOI] [PMC free article] [PubMed] [Google Scholar]