Abstract
Four pigeons were exposed to a concurrent procedure similar to that used by Davison, Baum, and colleagues (e.g., Davison & Baum, 2000, 2006) in which seven components were arranged in a mixed schedule, and each programmed a different left∶right reinforcer ratio (1∶27, 1∶9, 1∶3, 1∶1, 3∶1, 9∶1, 27∶1). Components within each session were presented randomly, lasted for 10 reinforcers each, and were separated by 10-s blackouts. These conditions were in effect for 100 sessions. When data were aggregated over Sessions 16–50, the present results were similar to those reported by Davison, Baum, and colleagues: (a) preference adjusted rapidly (i.e., sensitivity to reinforcement increased) within components; (b) preference for a given alternative increased with successive reinforcers delivered via that alternative (continuations), but was substantially attenuated following a reinforcer on the other alternative (a discontinuation); and (c) food deliveries produced preference pulses (immediate, local, increases in preference for the just-reinforced alternative). The same analyses were conducted across 10-session blocks for Sessions 1–100. In general, the basic structure of choice revealed by analyses of data from Sessions 16–50 was preserved at a smaller level of aggregation (10 sessions), and it developed rapidly (within the first 10 sessions). Some characteristics of choice, however, changed systematically across sessions. For example, effects of successive reinforcers within a component tended to increase across sessions, as did the magnitude and length of the preference pulses. Thus, models of choice under these conditions may need to take into account variations in behavior allocation that are not captured completely when data are aggregated over large numbers of sessions.
Keywords: choice, concurrent schedules, behavioral dynamics, acquisition, reinforcement, key peck, pigeons
A majority of research in behavior analysis on choice has been conducted using traditional steady-state methodologies (see de Villiers, 1977; Davison & McCarthy, 1988). This approach has been extremely fruitful. Herrnstein (1961), for example, described a relation in which the responding on a given alternative in concurrent variable-interval (VI) schedules was proportional to the reinforcers obtained for responding on that alternative (i.e., strict matching). Noting frequent demonstrations of systematic deviations from strict matching Baum (1974) proposed a more general formulation,
where B and R denote responses emitted and reinforcers obtained, respectively, on an alternative (1 or 2); a indicates the degree to which the response ratio is controlled by the reinforcer ratio (i.e., sensitivity) and log c indicates the degree of preference for one or the other alternative, independent of the reinforcer ratio (i.e., bias). It could be argued that this formulation serves as the foundation of most behavior-analytic conceptualizations of choice.
There has been a recent emergence of research investigating choice in more dynamic environments. One method used to investigate choice dynamics is to examine response allocation following a single, unsignaled change in concurrent contingencies within a selected session (e.g., Bailey & Mazur, 1990; Banna & Newland, 2009; Mazur, 1992; Mazur & Ratti, 1991). Another method has been to examine choice under contingencies that change unpredictably across sessions (e.g., Grace, Bragason, & McLean, 2003; Hunter & Davison, 1985; Kyonka & Grace, 2008; Maguire, Hughes, & Pitts, 2007; Schofield & Davison, 1997).
In a potentially important series of studies, Davison, Baum, and colleagues (Baum & Davison, 2004; Davison & Baum 2000; 2002; 2003; 2006; 2007; Krageloh & Davison, 2003; Landon & Davison, 2001; Landon, Davison & Elliffe, 2003) employed yet another method for investigating choice dynamics. Using a variant of a procedure originally described by Belke and Heyman (1994), pigeons are exposed to concurrent schedules in which a given dimension of reinforcement (e.g., rate, amount, or delay) changes repeatedly within sessions. In the basic procedure, seven different concurrent-schedule components occur within each session. Components typically are unsignaled (i.e., a mixed schedule), and each component arranges a different reinforcer ratio (usually ranging from 1∶27 to 27∶1) for pecking the left and right keys. Each component occurs once per session, and the order is randomly determined. A given experimental condition usually is in effect for 50 sessions, and data are aggregated over the last 35 sessions.
In this series of experiments, Davison, Baum, and colleagues reported several interesting, and potentially important, characteristics of performance. For example, under these conditions response allocation adjusts rapidly within each component to the reinforcement conditions in effect for that component (e.g., Davison & Baum, 2000; 2002; 2003). Early in a component, responding appears to be controlled to some extent by the reinforcer conditions arranged in the preceding component. However, across successive reinforcers within a component, sensitivity to the reinforcer conditions currently in effect increases. This increase in sensitivity appears to occur, at least in part, because responding on a given alternative increases as consecutive reinforcers are delivered via that alternative (i.e., continuations). Interestingly, a single reinforcer delivery via a given alternative after consecutive reinforcers have been delivered via the other alternative (i.e., a discontinuation) essentially “resets” preference; that is, a discontinuation shifts responding to near indifference. Finally, reinforcer deliveries generate preference pulses. That is, the first few responses following reinforcer delivery overwhelmingly favor the alternative that produced that delivery (the just-productive alternative), regardless of the programmed reinforcer ratio currently in effect. These pulses subside across consecutive postreinforcer responses (or across postreinforcer time) until, by about the 10th response, allocation tends to stabilize at a level that slightly favors the richer alternative. Thus, estimates of sensitivity to reinforcement (both within a component and between reinforcer deliveries), appear to be driven primarily by the first few responses after reinforcement delivery.
Partly on the basis of data from this series of studies, the concept of reinforcement has been challenged (e.g., Davison & Baum, 2006). It has been argued that reinforcers may not reinforce at all. Rather, stimulus events traditionally considered “reinforcers” are labeled phylogenetically important events; these events are said to function as signals that “guide” activities, rather than as reinforcers that “strengthen” the responses upon which they are contingent.
One goal of the present study was to replicate the basic procedure employed by Davison, Baum, and colleagues. At this point, there have been a few published replications of the basic findings outside their laboratory (see Aparicio & Baum, 2006, 2009; Lie, Harper, & Hunt, 2009). Specifically, we conducted a direct replication of the initial conditions arranged by Davison and Baum (2000). Pigeons initially were exposed to these conditions for 50 sessions, and the data were aggregated over the last 35 sessions. At this level of aggregation, however, data points often are composed of thousands of responses, particularly when the analysis involves collapsing across components. Thus, the second goal of the present study was to determine the degree to which the structure of choice revealed when data are aggregated over 35 sessions is preserved when data are aggregated over fewer sessions. A third goal was to characterize the development and maintenance of preference under this procedure. In particular, we were interested in how rapidly the characteristic structure develops, and the degree to which it is stable over time. To address the second and third goals, the pigeons were exposed to an additional 50 sessions (for a total of 100), and the data were aggregated in 10-session blocks across the entire study.
METHOD
Subjects
Four experimentally naïve Racing Homer pigeons (Columba livia) from Double-T Farms (Glenwood, Iowa) served as subjects. They were maintained at 85% of their free-feeding weights via postsession feeding of pigeon feed (Purina® Pigeon Checkers) and were housed individually in a colony room with free access to health grit and water. The colony room was on a 12∶12 hr light∶dark cycle (lights on at 0700).
Apparatus
Four identical operant-conditioning chambers (BRS/LVE, Inc. model SEC-002), with internal measurements of 30.5 cm wide × 36 cm high × 35 cm deep, were used. The front aluminum panel of each chamber contained three 2.5-cm diameter response keys, which were arranged horizontally 26.0 cm above the chamber floor and 8.5 cm apart (center to center). Only the two side keys were used; each key could be transilluminated yellow, red or green and required approximately 0.25 N of force to activate its corresponding switch. A 5.0 cm by 6.0 cm opening, with a light mounted directly above and behind the wall, was located 11.0 cm directly below the center key and provided access to a food hopper containing milo. Three houselights (white, red, and green) were located 6.5 cm above the center key, but only the white houselight (1.2 W, #1820 bulb) was used. Each chamber was equipped with an exhaust fan for ventilation, and white noise was broadcast in the room during sessions. Experimental events were programmed and data recorded by a computer using Med Associates® (Georgia, VT) software (version 4.0) and interface equipment located in an adjacent room; programming and recording occurred at a 0.01-s resolution.
Procedure
The procedure used here emulated as closely as possible Condition 1 described by Davison and Baum (2000). Once a pigeon's weight stabilized at its criterion for 1 week, magazine training began. Following this, pecking the two side keys was trained via an autoshaping procedure, as described by Davison and Baum. Pigeon 8418 did not peck either side key during the autoshaping procedure, so pecking the center key was shaped manually by differentially reinforcing successive approximations; after which, this pigeon was exposed to one session of fixed-ratio (FR) 1 of food reinforcement on the center key. During training and experimental sessions: (1) the houselight was illuminated; (2) whenever available, keys were transilluminated with yellow lights; (3) reinforcement consisted of raising the food hopper for 2.5 s; and (4) when the hopper was raised, the opening was illuminated and all other lights in the chamber were extinguished.
After key pecking was established, pigeons were exposed to two sessions of an FR 1 schedule, one with the left key and one with the right key. Over the next 2 weeks, the pigeons were exposed to a series of VI schedules across sessions; the VI value gradually was increased from 5 to 30 s across sessions. Each VI was in effect for an even number of sessions (minimum of two), with half on the left and half on the right. When key pecking on each key occurred reliably under the VI 30-s schedule, concurrent (conc) scheduling was arranged.
A procedure nearly identical to the one described by Davison and Baum (2000) was used for the remainder of the experiment (also see Belke & Heyman, 1994). Sessions were divided into seven components; components were unsignaled (i.e., a mixed schedule was arranged). During each component, food delivery was programmed via a dependent conc VI 27-s schedule (i.e., on average, food was available 2.22 times per min); interval values were determined using a Fleshler and Hoffman (1962) exponential progression with 10 values. Each component remained in effect until 10 reinforcers were obtained. Each of the 10 intervals comprising the VI was used once per component and, thus, variation in the rate of reinforcement across the components within each session was minimal. Components were separated by 10-s blackouts, during which key pecks were measured, but had no programmed consequences. A 2-s changeover delay (COD) was arranged such that a reinforcer could not be obtained for a peck on a given key until 2 s had elapsed since a changeover (a peck on one key that followed a peck on the other key). Sessions lasted until all seven components were completed (i.e., there was no time limit). During initial training on this schedule, the programmed reinforcer ratios (L∶R) were 1∶1 in all components; five (Pigeon 8418) to seven (Pigeons 280, 17560, and 49889) sessions were conducted under these parameters. Then the probability with which reinforcement was available for pecking the side keys was changed such that, across components, the programmed reinforcer ratios (L∶R) were 1∶27, 1∶9, 1∶3, 1∶1, 3∶1, 9∶1, and 27∶1. Each component occurred once per session, and the order of components was randomly determined. A total of 100 sessions were conducted under these latter parameters.
Data Analysis
Within each session, pecks on the left and right keys and reinforcer deliveries via each option were time-stamped (at a 0.01-s resolution). From these raw numbers, several dependent measures were derived: (a) Response ratios within each interval within each component (i.e., response ratios prior to the first reinforcer of a component, between the first and second reinforcers, between the second and third reinforcers, and so on). These data were used to characterize sensitivity as a function of successive reinforcers within components. These data also were used to characterize carryover effects in a given component from the contingencies arranged in the immediately preceding component. This was done via a regression analysis in which the log ratios for consecutive reinforcers within a component were regressed against the log reinforcer ratio in effect during that component (Lag 0) and against the log reinforcer ratio of the immediately preceding component (Lag 1). (b) An analysis of the effects of successive reinforcers delivered for responses via the same option (continuations) followed by a reinforcer delivered via the other option (a discontinuation). This analysis was used to generate response trees similar to those reported by Davison and Baum (e.g., 2000; 2002). (c) An analysis of preference pulses was generated by creating a ratio of “P” responses (responses on the option that just produced a reinforcer; the just-productive alternative) to “N” responses (responses on the option that did not just produce the reinforcer; the not just-productive alternative). These ratios were plotted as a function of the ordinal position of the response, up to the 40th response following reinforcer deliveries. These data were collapsed across components. Preference pulses were characterized by calculating magnitude and a length. Pulse magnitude was determined by taking the largest log (P/N) value (which for all pigeons occurred at the first response following reinforcer delivery). Pulse length was determined by taking the ordinal position of the first postreinforcer response falling within the standard deviation around the mean of the log (P/N) values for postreinforcer responses 20–30. This range was selected because the log ratio values typically had reached asymptote by the 20th postreinforcer response, and because sample sizes beyond the 30th postreinforcer response were small.
To determine the degree to which our results replicated those of Davison, Baum, and colleagues, the analyses described above were conducted on the data aggregated over the last 35 of the first 50 sessions. To determine the degree to which the structure of choice revealed at that level of aggregation was preserved at smaller levels, the above analyses were conducted separately for blocks of 10 sessions starting with Session 1. Of particular interest was the development of within-component control by the current conditions in effect, the development of control by individual reinforcer deliveries, and the dissipation of carryover effects from component to component. Data from an additional 50 sessions also were analyzed to examine the stability of these characteristics of performance across time. Finally, to characterize behavior within individual sessions, response proportions following each reinforcer for Sessions 1, 15, 50, and 100 were analyzed.
RESULTS
Data Aggregated Over Sessions 16–50
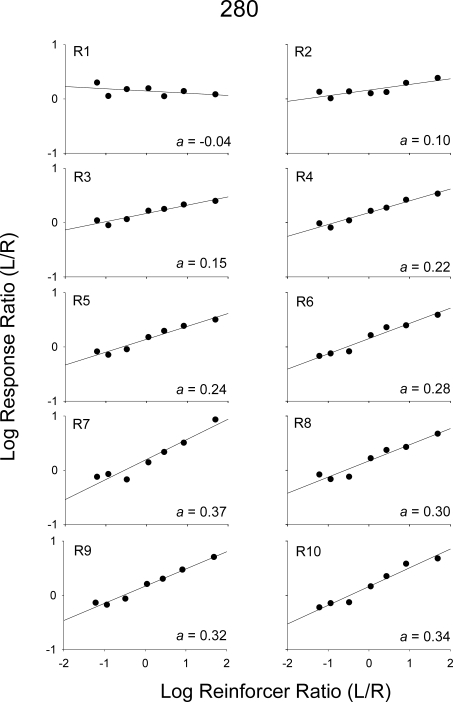
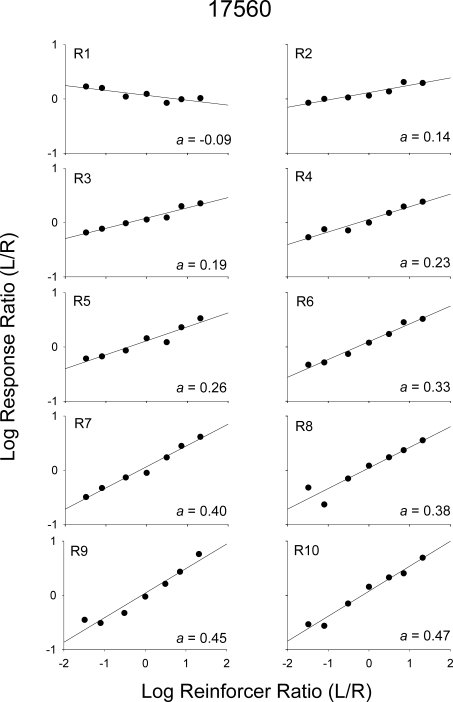
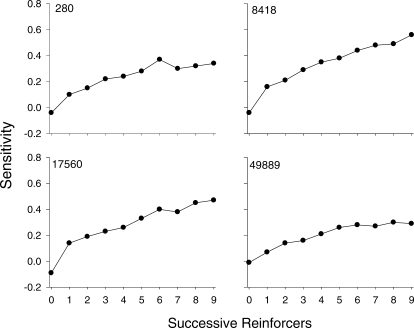
Two patterns of data were noted in several of the analyses and are described in the Results. To conserve space, for certain analyses, one pigeon, which showed each type of pattern, was selected (the other pigeons' data are available upon request). Figures 1 and 2 show log response ratios (left/right) plotted against log obtained reinforcer ratios from the 2 pigeons, 280 and 17560, respectively. Each graph shows data from a 10th of a component; that is, each graph shows response ratios prior to each reinforcer within a component. For example, plotted in the first graph (R1) are response ratios from the beginning of a component until the first reinforcer was delivered; plotted in the second graph (R2) are response ratios after the first reinforcer was delivered, but before the second was delivered; and so on. A linear regression was conducted with data in each graph, and estimates of sensitivity are indicated. For both pigeons, sensitivity was near zero at the beginning of a component (R1) and increased as more reinforcers were delivered within a component. Figure 3 shows sensitivity as a function of number of reinforcers within the component for all pigeons. For Pigeon 49889, and to some degree Pigeon 280, sensitivity increased across the first five or six reinforcers and then appeared to reach a plateau; whereas, for Pigeons 17560 and 8418, sensitivity continued to increase throughout the components. Across pigeons, the range of sensitivity estimates after nine reinforcers were delivered was 0.29 (Pigeon 49889) to 0.54 (Pigeon 8418).
Fig 1.
Log response ratios (left/right) as a function of log obtained reinforcer ratios (left/right) aggregated across Sessions 16–50 for Pigeon 280. Each graph shows data from response ratios obtained prior to each reinforcer delivery denoted by R. Sensitivity estimates (a) for each data set are displayed in the bottom corner of each graph.
Fig 2.
Log response ratios (left/right) as a function of log obtained reinforcer ratios (left/right) aggregated across Sessions 16–50 for Pigeon 17560. Plotting conventions are the same as in Figure 1.
Fig 3.
Sensitivity estimates (a) as a function of successive reinforcers within a component from Sessions 16–50 for individual pigeons.
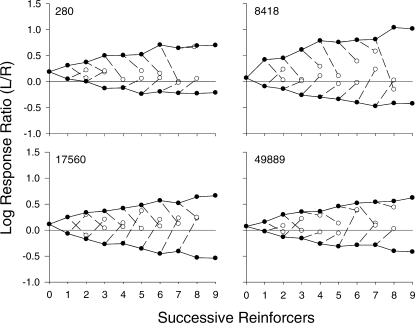
In Figure 4, individual-subject response trees are shown. For all pigeons, as more reinforcers were delivered consecutively via one alternative, that is, as more continuations occurred (i.e., closed circles at x-axis values 2–9), response allocation tended to shift toward that alternative. Data for Pigeons 280 and 49889 show a slight bias for the left alternative, indicated by a slight preference for this alternative prior to the first reinforcer and an overall upward displacement of the trees. For Pigeon 8418, responding prior to the first reinforcer was relatively evenly distributed across the two keys; however, for this pigeon, the function relating left responding to successive continuations was much steeper than the function relating right responding to successive continuations and, thus, the tree was displaced upward. In several instances, the functions for successive continuations did not appear to have reached an asymptote; indeed, in some cases, for example Pigeon 17560, the functions were roughly linear. In general, a single discontinuation (shown by the open circles at the end of dashed lines) tended to shift responding toward that alternative. For Pigeon 17560, this effect was relatively consistent in that each discontinuation for the most part shifted responding to near indifference. For the other 3 pigeons, however, the size of the shifts was quite variable both within and across pigeons. In some cases, the shift was dramatic in that preference was nearly completely reversed; whereas, in other cases, the shift was negligible.
Fig 4.
Response trees for individual pigeons. Log response ratios (left/right) are plotted as a function of successive reinforcers delivered within a component aggregated across Sessions 16–50 for individual pigeons. Closed circles above 0 on the x-axis show log response ratios prior to the delivery of the first reinforcer and above 1 show log response ratios following the first reinforcer in a component (collapsed across all components). Subsequent closed circles show log response ratios as a function of consecutive continuations; open circles (dashed lines) show log response ratios following a single discontinuation, which followed a given number (x value) of continuations. Discontinuations following the eighth reinforcer (Pigeons 8418, 17560, and 49889) and ninth reinforcer (all pigeons) are not shown because they rarely occurred. Note that the discontinuation data point following the eighth reinforcer from the left alternative for Pigeon 280 is partially occluded by the continuation data point.
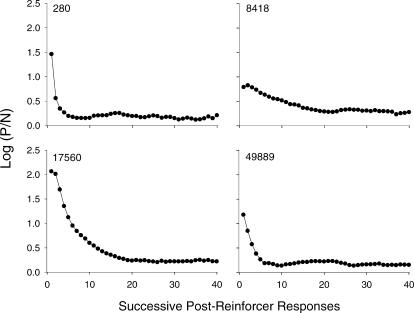
For all pigeons, reinforcer deliveries generated preference pulses (Figure 5). That is, immediately following reinforcement, the pigeons were highly likely to return to the alternative that just produced the reinforcer, after which, response allocation to that alternative decreased and reached an asymptote of approximately 0.25. Although preference pulses occurred for all pigeons, the magnitude and length of these pulses varied considerably. Pulse magnitude across pigeons ranged from 0.79 (Pigeon 8418) to 2.06 (Pigeon 17560). That is, across pigeons, the first response following reinforcement was between 6 to 100 times more likely to occur on the just-productive, than on the not-just-productive, alternative. For Pigeons 280 and 49889, respectively, the pulses lasted for 5 and 7 responses following reinforcement; whereas, for Pigeons 8418 and 17560, the pulses lasted longer (19 and 20, responses, respectively). For Pigeons 280, 17560, and 49889, the functions were curved; that is, the aftereffects of reinforcement dissipated more rapidly at first. For Pigeon 8418, however, the function was somewhat more linear. Interestingly, the size and length of the pulses did not appear to be related across pigeons. For example, Pigeons 8418 and 17560 had the smallest and largest pulses, respectively, yet both had longer pulses than the other 2 pigeons.
Fig 5.
Preference pulses for individual pigeons. Log (P/N) ratios are plotted as a function of ordinal position of the response up to the 40th response following a reinforcer. For each pigeon, data were aggregated across Sessions 16–50. “P responses” denote pecks on the option that just produced a reinforcer; the just-productive alternative; “N responses” denote pecks on the option that did not just deliver the reinforcer; the not just-productive alternative). These data were collapsed across components.
Data Aggregated in 10-Session Blocks (Sessions 1–100)
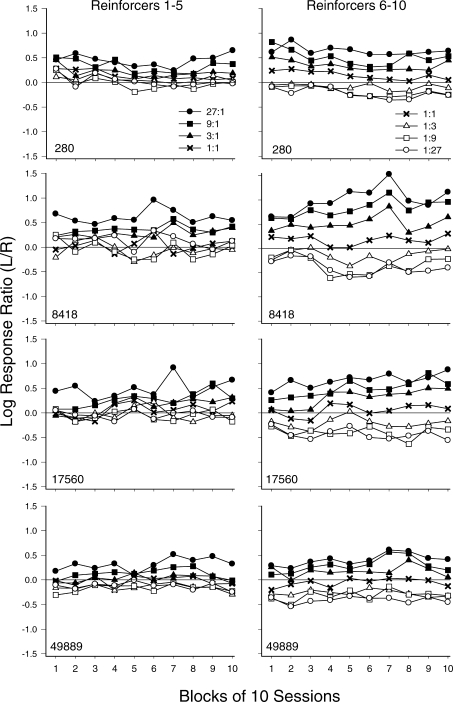
Figure 6 shows log response ratios for each component across 10-session blocks. Overall, for each pigeon, response ratios were more differentiated as a function of reinforcer ratio in the last half (Reinforcers 6–10) than in the first half (Reinforcers 1–5) of components. In addition, for each pigeon, response ratios were controlled to some extent by the reinforcer ratios in effect starting from the first block. In general, the control grew throughout the blocks; this was particularly the case for Pigeons 8418 and 17560 for the last half of components. For Pigeons 280 and 49889, control by the reinforcer ratio during the first half of the component was fairly consistent across blocks. Interestingly, across blocks and within components, response ratios were more differentiated when reinforcement favored the left alternative (closed symbols) than the right alternative (open symbols).
Fig 6.
Log response ratios (L/R) obtained before Reinforcers 1–5 (left column) and 6–10 (right column) across 10-session blocks for individual pigeons (rows) within components arranging 27∶1 (closed circles), 9∶1 (closed squares), 3∶1 (closed triangles), 1∶1 (x), 1∶3 (open triangles), 1∶9 (open squares) and 1∶27 (open circles).
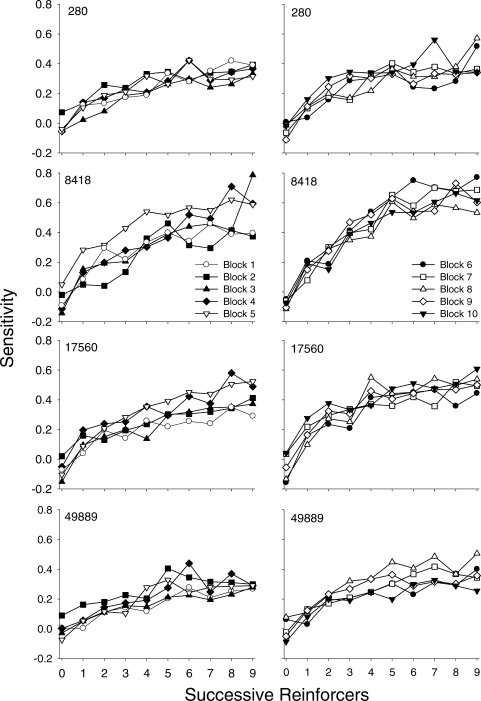
Figure 7 shows sensitivity as a function of successive reinforcers within a component for individual pigeons (rows) for 10-session blocks from Sessions 1–50 (left column) and for Sessions 51–100 (right column). For all pigeons, sensitivity increased across successive reinforcers within a component; this pattern is evident even in the first 10 sessions (open circles, left panels). For Pigeons 280 and 49889, sensitivity functions are very similar across all blocks. For Pigeons 8418 and 17560, sensitivity increased not only within a component, but also across successive blocks of sessions. For example, sensitivity for Pigeon 17560 after the ninth successive reinforcer was 0.35 for Sessions 1–10 and 0.54 for Sessions 41–50.
Fig 7.
Sensitivity estimates across successive reinforcers within a component for individual pigeons (rows) during Sessions 1–50 (left column) and Sessions 51–100 (right column) aggregated in 10-session blocks; data from each block are represented by a unique symbol/fill combination (see legend).
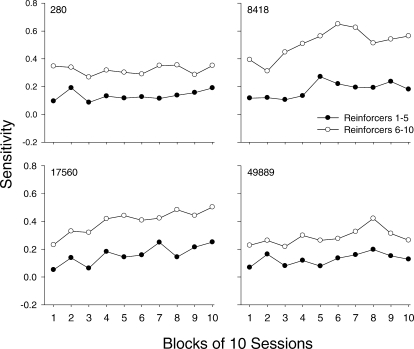
The trends indicated in Figure 7 can be seen more clearly in Figure 8, which shows average sensitivity across 10-session blocks from the first half (closed circles, Reinforcers 1–5) and second half (open circles, Reinforcers 6–10) of components within a session. For all pigeons, sensitivity from the second half of components was approximately 2 to 3 times higher than sensitivity from the first half. Again, for Pigeons 280 and 49889, sensitivity from both halves of the components remained fairly constant across the session blocks. In contrast, for Pigeons 8418 and 17560, sensitivity from both the first half and second half of the components increased across successive blocks. For Pigeon 8418, sensitivity increased and reached a maximum by Block 5 (first half) and Block 6 (second half), after which it decreased slightly and then stabilized; however, the function for the second half of the component was steeper than for the first half of the component. For Pigeon 17560, sensitivity tended to increase at the same rate in both halves of the component across blocks.
Fig 8.
Sensitivity estimates for the first (closed circles) and second half (open circles) of components aggregated across 10-session blocks from Sessions 1–100 for individual pigeons.
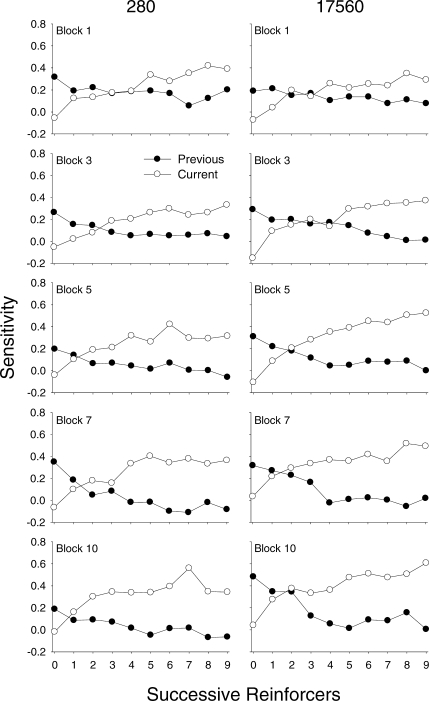
Figure 9 shows sensitivity across successive reinforcers for Blocks 1 (Sessions 1–10), 3 (Sessions 21–30), 5 (Sessions 41–50), 7 (Sessions 61–70), and 10 (Sessions 91–100) for the 2 representative pigeons (280, left column; 17560, right column). Sensitivity was calculated based on the reinforcer ratio in effect in the current component (Lag 0; open symbols) and for the reinforcer ratio that occurred in the immediately preceding component (Lag 1; closed circles). Sensitivity for all pigeons was calculated (though not presented) up to Lag 3, but reinforcer ratios from two or three components earlier were shown to have relatively little effect on current responding. Overall, throughout the 100 sessions, responding prior to the first reinforcer tended to be controlled by the reinforcer ratio from the immediately preceding component. During the first few 10-session blocks, control by the previous reinforcer ratio continued for up to five reinforcers (see Pigeon 280 S 1–10 and Pigeon 17560 S 21–30), after which control by the current reinforcer ratio predominated. Across further blocks of sessions, control by the current reinforcer ratio took effect earlier within the component, typically by the second (Pigeon 280) or third (Pigeon 17560) reinforcer.
Fig 9.
Sensitivity of responding in a given component to the current (open circles; Lag = 0) and to the immediately preceding (closed circles; Lag = 1) component's reinforcer ratios as a function of successive reinforcers delivered within that component for Pigeons 280 (left column) and 17560 (right column). Panels show data from selected 10-session blocks across the experiment.
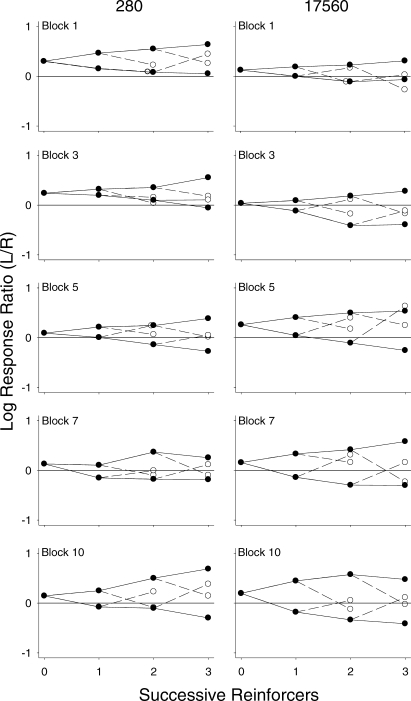
Figure 10 shows tree plots constructed from data aggregated across the selected 10-session blocks (1, 3, 5, 7, and 10) for the 2 representative pigeons (280 and 17560). Due to these smaller aggregates, there were not enough data to perform these analyses through nine successive reinforcers; therefore the analyses were conducted through three successive reinforcers only. Overall for both pigeons, similar to that shown in Figure 4, successive continuations (closed circles) shifted response allocation toward that alternative. A discontinuation (open circles) shifted response allocation toward that seen at the beginning of the component, prior to any reinforcers, although this effect was somewhat variable. For Pigeon 280 (and 49889, data not shown), the overall pattern remained relatively consistent across blocks of sessions; although the tree for Pigeon 280 in Block 10 was slightly wider than those for the other blocks, the distance between the two functions did not change systematically across blocks (e.g., compare Blocks 1 and 7). In contrast, for Pigeon 17560 (and 8418, data not shown), as more sessions elapsed, continuations tended to result in more extreme response ratios for that reinforced alternative; that is, the trees increased in width. For both pigeons whose data are shown in Figure 10, a left-key bias occurred throughout most of the blocks, indicated by an upward displacement of the trees.
Fig 10.
Response trees for Pigeons 280 and 17560 across selected 10-session blocks across the experiment. In each graph, log response ratios (left/right) are plotted as a function of the first three reinforcers delivered within a component. Plotting conventions are the same as in Figure 4; this figure is laid out in the same fashion as Figure 9.
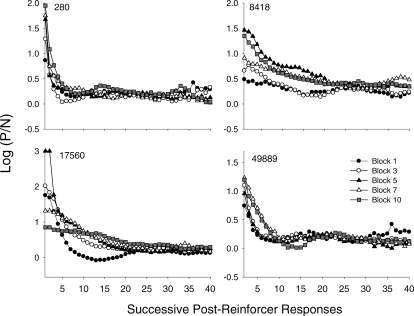
Figure 11 shows preference pulses for individual pigeons from the same blocks (1, 3, 5, 7, and 10) shown in Figures 9 and 10; data from each of the selected blocks are shown with a separate symbol. Consistent with the data shown in Figure 5, preference pulses occurred following reinforcement for each pigeon, and the pulses dissipated across responses since the last reinforcement. Two patterns of preference-pulse development across the experiment are evident in Figure 11. For Pigeons 280 and 49889, the overall shape of the function emerged fairly early (filled and unfilled circles), and was relatively stable across sessions. Even so, there were systematic changes across blocks for both of these pigeons (see Figure 12; described below). For Pigeons 8418 and 17560, the pulses changed considerably across the experiment. For both of these pigeons, pulses dissipated more slowly across blocks. For Pigeon 8418, pulse magnitude increased systematically across blocks, whereas for Pigeon 17560, pulse magnitude increased then decreased across blocks. The function in Block 10 for this pigeon was relatively shallow.
Fig 11.
Preference pulses for each pigeon for selected 10-session blocks across the experiment. Data for the separate blocks are denoted by different symbols. On two occasions (for Pigeon 17560 at the first two responses in Block 5), an exclusive preference occurred. In both cases, this involved between 600 and 700 “P” responses and 0 “N” responses; thus, a log ratio of 3.0 was assigned. Other features are as described in Figure 5.
Fig 12.
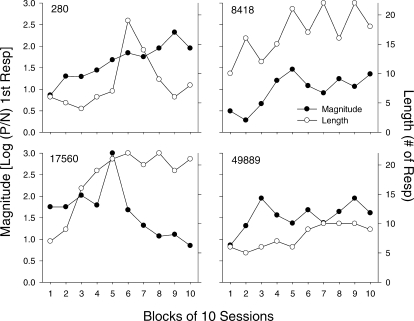
The magnitude (closed circles) and length (open circles) of preference pulses for each pigeon as a function of session block. For each graph, the data for pulse magnitude are plotted on the left y-axis and the data for pulse length are plotted on the right y-axis. See Data Analysis for a description of the methods used to determine pulse magnitude and length.
Changes in the magnitude and length of the pulses across sessions are characterized further in Figure 12, which shows magnitude (closed circles; left y-axes) and length (open circles; right y-axes) across blocks of sessions. This figure clearly shows systematic changes in these two measures across sessions. An increasing trend in pulse length occurred for all pigeons, but was particularly evident for Pigeons 8418 and 17560; length increased from about 10 (8418) and 7 (17560), to approximately 20 responses. Pulse magnitude increased systematically across blocks for Pigeons 280, 8418, and 49889. For Pigeon 17560, following an extremely high value in Block 5 (which was an exclusive preference), magnitude decreased substantially across the last five blocks, to values below those obtained in Blocks 1–4.
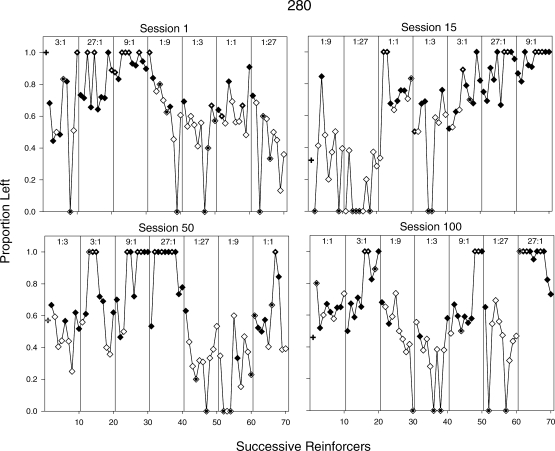
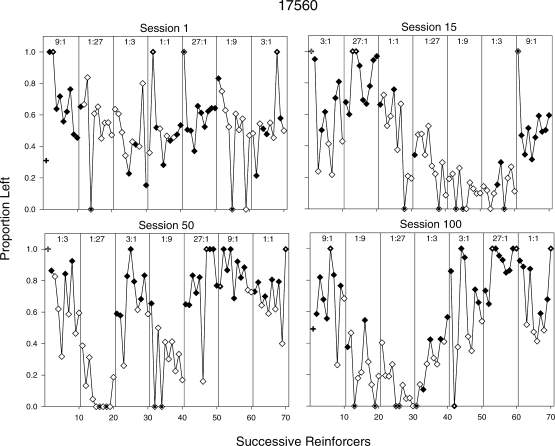
Figures 13 and 14 show how response allocation was controlled by individual reinforcers within and across sessions for Pigeons 280 and 17560; these sessions (1, 15, 50, 100) were selected to illustrate change across the experiment. In each graph, the proportion of left responses is plotted for successive reinforcers within the session (proportion is plotted in these graphs because exclusive preference for one alternative occurred often). Separate panels within a graph show successive reinforcers within a component. Thus, the first data point within a panel shows the proportion of left responses prior to the first reinforcer delivery in that component, the second data point shows the proportion of left responses between the first and second reinforcer deliveries within that component, and so on. Closed diamonds indicate proportions following reinforcer deliveries for a left response and open diamonds indicate proportions following reinforcer deliveries for a right response. For example, in Session 1 for Pigeon 280 (Figure 13), the first filled data point in the component providing a 1∶3 reinforcer ratio (fifth panel) indicates that the last reinforcer delivery in the previous component was for a left response. The second unfilled data point in the 1∶3 component indicates that the first reinforcer in that component was delivered for a right response. Overall, Figures 13 and 14 show that reinforcer rates tended to control response allocation, even to some degree within the first session (more so for Pigeon 280 than for 17560); this control increased across sessions, especially in the extreme conditions (27∶1, 1∶27). Response allocation within components tended to shift to the alternative that arranged the higher reinforcer rate as a function of repeated reinforcers from that alternative. It also can be seen that even after repeated reinforcers from a given alternative, a reinforcer from the other alternative often shifted responding in that direction (e.g., Figure 14, Pigeon 17560: Session 50, 27∶1; Session 100, 1∶9), although this shift was weaker and less consistent in the earlier sessions than in the later sessions. It should be noted that when exclusive preference is shown, it often occurred in an interval with 10 or fewer responses (dotted symbols). Thus, these proportions may reflect the preference pulses obtained after reinforcement. For Pigeon 280, if these data points are excluded, then overall response allocation appears to approach indifference within components, even in the later sessions. This effect was more pronounced when reinforcers were obtained via the right alternative than via the left alternative (e.g., Figure 13, Pigeon 280: Session 100).
Fig 13.
Proportion of responses on the left alternative following a reinforcer delivered via the left alternative (closed diamonds) and the right alternative (open diamonds) within individual sessions for Pigeon 280. Panels in each graph (separated by vertical lines) show data from components within the session and are labeled with the reinforcer ratio in effect. The first data point within a panel represents responding following a timeout and before the first reinforcer, the second data point represents responding following the first and before the second reinforcer, etc. Plus signs above the first reinforcer represent response proportions obtained before the first reinforcer in the session. Data points with dots inside them (and unfilled + symbols) indicate proportions derived from 10 or fewer responses.
Fig 14.
Proportion of responses on the left alternative across reinforcers within individual sessions for Pigeon 17560. Plotting conventions are the same as in Figure 13.
DISCUSSION
The present study addressed three questions. The first was whether or not we could replicate the basic effects reported by Davison, Baum, and colleagues (Baum & Davison, 2004; Davison & Baum 2000; 2002; 2003; 2007; Krageloh & Davison, 2003; Landon & Davison, 2001; Landon et al., 2003). At comparable levels of aggregation, our results were quite similar to theirs. Across reinforcers within components, response allocation adjusted to the reinforcer ratio in effect (sensitivity increased), while carryover from the previous component diminished. Consecutive reinforcers delivered via a given alternative (continuations) increased preference for that alternative; whereas, a discontinuation following several consecutive continuations often produced a dramatic change in response allocation toward that alternative. Finally, preference pulses emerged; that is, responses immediately following reinforcer delivery strongly favored the alternative that just produced reinforcement. This was followed by a shift toward indifference across successive postreinforcer responses. The present findings suggest that the structure of choice reported by Davison, Baum, and colleagues under these conditions represents a reliable effect and likely is not the result of something peculiar to their laboratory. Further, recent experiments with rats (Aparicio & Baum, 2006, 2009) and humans (Lie et al., 2009) suggest that these effects may be reasonably general. Of course, further experimentation will help establish the extent of this generality.
Although the basic structure of choice reported by Davison, Baum, and colleagues was replicated here, it is worth noting that there were some subtle differences, even when the data were similarly aggregated. For example, although successive continuations tended to produce diminishing increases in the present study (see Figure 4), these effects appeared to be less dramatic than typically reported in their studies (e.g., Davison & Baum, 2002). In the present study, a discontinuation generally produced a substantial shift in preference, but this effect was somewhat variable, both within and across pigeons. Consequently, as shown in Figure 3, by the end of the component, when data were pooled over Sessions 16–50, sensitivity appeared to have reached asymptote in only 1 pigeon (49889), and clearly was still increasing in 2 pigeons (8418 and 17560).
The second question addressed here was whether or not the structure of choice revealed in relatively large aggregates of data (i.e., 35 sessions) would be preserved with smaller aggregates. The basic characteristics of choice revealed when the data were pooled across Sessions 36–50 were clearly evident when the data were pooled in 10-session blocks. Within each block, sensitivity increased across successive reinforcers in a component; successive continuations increased preference and a single discontinuation produced a substantial shift toward that alternative; reinforcer deliveries produced preference pulses. These findings indicate that the local structure of choice revealed by Davison, Baum, and colleagues does not depend upon pooling data over large numbers of sessions. Indeed, some of the characteristics also were evident within individual sessions (Figures 13 and 14).
The data presented in Figures 6–12, however, do show variation across blocks that is not apparent in the data aggregated over 35 sessions. For example, in some cases, discontinuations completely reversed preference; in other cases, they produced negligible effects; and in still others, they produced intermediate effects (Figure 10). Thus, under this procedure, a given degree of order revealed with a large pool of data may not always exist with a smaller pool.
The issue of order across larger and smaller aggregates of data in the present procedure may not be simply one of sample size, which brings us to the third, and perhaps most important, purpose of the present study: to characterize the development and maintenance of choice in this procedure. The speed with which the basic structure of choice emerged is noteworthy. For all of the pigeons, the local characteristics of performance clearly were evident within the first 10 sessions, and some of these characteristics emerged within the first session (Figures 13 and 14). Although noteworthy, the rapid development of the basic structure of choice in the present study perhaps should not be too surprising. Rapid shifts in preference have been shown to occur following a single, unpredictable, within-session shift in concurrent reinforcement contingencies (e.g., Bailey & Mazur, 1990; Banna & Newland, 2009; Mazur, 1992; Mazur & Ratti, 1991). Furthermore, under conditions in which concurrent reinforcement contingencies change unpredictably across sessions, in some cases, subjects begin to track the session-to-session changes within just a few sessions (e.g., Grace et al., 2003; Hunter & Davison, 1985; Schofield & Davison, 1997). Together, these data suggest every reinforcer does indeed count, particularly in dynamic environments.
Although the basic structure of choice emerged very early for all of the pigeons in the present study, the data presented in Figures 6–14 show orderly changes across sessions for all pigeons, but particularly for Pigeons 8418 and 17560. For these 2 pigeons especially, but for all pigeons to some extent, effects of reinforcers tended to increase across blocks of sessions, particularly during the first 50 sessions; this was evident to some degree at each level of analysis. That is, (a) the maximum sensitivity reached within a component and the rate at which it approached that maximum increased across blocks (particularly for Pigeons 8418 and 17560; see Figures 7 and 8); (b) effects of successive continuations increased across blocks (e.g., see Figure 10, Pigeon 17560); and (c) the magnitude (Pigeons 280, 8418, and 49889) and the length (Pigeons 8418, 17560, and 49889) of the preference pulses increased across blocks (Figure 12). The one exception to these general findings was with Pigeon 17560. Interestingly, although both sensitivity and the effect of continuations increased across the experiment with this pigeon, these effects were not accompanied by an increase in the magnitude of the preference pulses. Following the extremely high value in Block 5, pulse magnitude decreased substantially across Sessions 51–100. Indeed, the data in Block 10 for this pigeon shown in Figure 11 hardly could be characterized as a “pulse.”
The systematic changes across sessions of this experiment indicate that the pooled data from Sessions 36–50 were not from a homogeneous performance; that is, the pooled data contained behavior in transition across sessions. For example, as mentioned above, the sensitivity plots in Figure 3, particularly those for Pigeons 8418 and 17560, appeared to be increasing at the end of the component. Those over the last 50 sessions, however, reached their maximum more quickly and, hence, tended to level out more by the end of the component. Interestingly, in Figure 9 of Davison and Baum's (2000) study, data from the first two exposures to the same conditions arranged here (Conditions 1 and 3 combined, indicated by the unfilled circles) show a similar pattern; group sensitivity appears to have reached a maximum of just under 0.5, but appeared to be still increasing at the end of the component. Indeed, as Davison and Baum point out, although behavior adjusts rapidly under these conditions, the adjustment is incomplete; sensitivities in these procedures typically are lower than those reported under steady-state conditions. The present data suggest that, in these procedures, important adjustments take place across sessions, as well as within components, and these adjustments can take several sessions.
Davison and Baum (2002) suggested that both shorter-term and longer-term processes operate in this procedure. The shorter-term processes are illustrated by effects of individual reinforcers (preference pulses) and the longer-term processes are illustrated by effects of reinforcer sequences (continuations and discontinuations; see Krageloh, Davison, & Elliffe, 2005). The present data suggest that the effects of both the short- and long-term processes themselves can be modulated by other processes that may change systematically across repeated exposure. The nature of control over the systematic changes across sessions is unclear. The data in Figure 9, however, may provide a hint. Carryover from the previous component's contingencies to the response ratio prior to the first reinforcer in the current component either did not change systematically (Pigeon 280) or actually increased (Pigeon 17560) across blocks. For both pigeons, the degree to which carryover persisted across successive reinforcers, however, tended to decrease. Thus, the contribution of the previous component's reinforcer ratio to the response allocation in the later part of the current component appeared to decrease across sessions. Interpretation of the changes in preference pulses across sessions is a bit more difficult. Nevertheless, the systematic changes across sessions obtained in the present study, both at the level of successive reinforcers and at the level of responses between reinforcers, suggest that the effects of reinforcers change not only as a function of their place within a sequence of reinforcers, but also as a function of continued exposure to the contingencies.
The present data do not speak directly to the notion that reinforcers (phylogenetically important events) “guide” activities, rather than “strengthen” responses upon which they are contingent (e.g., Davison & Baum, 2006). Perhaps, however, rather than indicating that reinforcers do not strengthen behavior, the procedure used here (and other procedures used to investigate choice dynamics) emphasizes the discriminative effects of reinforcer deliveries over their strengthening effects. Indeed, for each pigeon, over the course of the 100 sessions of this study, an average of over two components per session (nearly a third of all components) delivered all 10 reinforcers via one alternative. Of course, this occurred most often during the 27∶1 and 1∶27 components, but also occurred frequently in the 9∶1 and 1∶9 components. In the absence of explicit discriminative stimuli correlated with each component, and in the context of several components in which all of the reinforcers are delivered via one alternative, discriminative control by individual reinforcer deliveries ultimately may come to predominate. Perhaps it is the acquisition of stimulus control by both individual reinforcers and by sequences of reinforcers that is reflected in the systematic changes across sessions found in the present study. Data reported by Landon and Davison (2001) appear to be consistent with this interpretation. They found that restricting the range of reinforcer ratios in this procedure (and, thus, lowering the proportion of components in which all of the reinforcers were delivered via one alternative) lowered measures of sensitivity. It should be noted, however, that although measures of sensitivity were lowered by restricting the range of reinforcer ratios, some of the basic characteristics of performance (e.g., effects of continuations and discontinuations) were still evident. It also should be noted that some of these basic features of performance also were preserved when components were signaled (Krageloh & Davison, 2003). Thus, discriminative effects of individual reinforcer deliveries are evident in this procedure even when extreme reinforcer ratios are absent and when components are signaled.
In summary, we replicated the basic findings reported by Davison, Baum, and colleagues, and found that the structure of choice revealed when data were aggregated across large numbers of sessions was preserved when data were aggregated across smaller numbers of sessions. We also found that, although characteristics of choice under these procedures emerged quite rapidly (i.e., within the first few sessions), they also changed systematically across sessions. As such, the data pooled across large numbers of sessions contained behavior that was changing across sessions. Thus, models of choice under these sorts of dynamic arrangements (e.g., Baum & Davison, 2009) may need to accommodate the types of systematic changes across sessions obtained here.
Acknowledgments
Portions of these data were presented in October, 2008 at the 25th annual meeting of the Southeastern Association for Behavior Analysis in Atlanta, GA and in May, 2009 at the 35th annual meeting of the Association for Behavior Analysis International in Phoenix, AZ; they also were presented in a thesis which served in partial fulfillment of the first author's Master's degree at the University of North Carolina Wilmington (UNCW). The pigeons were cared for in accordance with the regulations set forth by the Office of Laboratory Animal Welfare and the UNCW Institutional Animal Care and Use Committee.
The authors would like to thank Rachel Graves, Brittany Kersey, Sophia Key, and Alicia Skorupinski for their assistance in conducting this experiment and Rhiannon Thomas for providing animal care. The authors also wish to thank Drs. Carol Pilgrim and D. Kim Sawrey for the comments on an earlier version of the manuscript. The first author is currently at Utah State University.
REFERENCES
- Aparicio C.F, Baum W.M. Fix and sample with rats in the dynamics of choice. Journal of the Experimental Analysis of Behavior. 2006;86:43–63. doi: 10.1901/jeab.2006.57-05. [DOI] [PMC free article] [PubMed] [Google Scholar]
- Aparicio C.F, Baum W.M. Dynamics of choice: relative rate and amount affect local preference at three different time scales. Journal of the Experimental Analysis of Behavior. 2009;91:293–317. doi: 10.1901/jeab.2009.91-293. [DOI] [PMC free article] [PubMed] [Google Scholar]
- Bailey J.T, Mazur J.E. Choice behavior in transition: Development of preference for the higher probability of reinforcement. Journal of the Experimental Analysis of Behavior. 1990;53:409–422. doi: 10.1901/jeab.1990.53-409. [DOI] [PMC free article] [PubMed] [Google Scholar]
- Banna K.M, Newland M.C. Within-session transitions in choice: A structural and quantitative analysis. Journal of the Experimental Analysis of Behavior. 2009;91:319–335. doi: 10.1901/jeab.2009.91-319. [DOI] [PMC free article] [PubMed] [Google Scholar]
- Baum W.M. On two types of deviation from the matching law: Bias and undermatching. Journal of the Experimental Analysis of Behavior. 1974;22:231–242. doi: 10.1901/jeab.1974.22-231. [DOI] [PMC free article] [PubMed] [Google Scholar]
- Baum W.M, Davison M. Choice in a variable environment: Visit patterns in the dynamics of choice. Journal of the Experimental Analysis of Behavior. 2004;81:85–127. doi: 10.1901/jeab.2004.81-85. [DOI] [PMC free article] [PubMed] [Google Scholar]
- Baum W.M, Davison M. Modeling the dynamics of choice. Behavioural Processes. 2009;81:189–194. doi: 10.1016/j.beproc.2009.01.005. [DOI] [PubMed] [Google Scholar]
- Belke T.W, Heyman G.M. Increasing and signaling background reinforcement: Effect on the foreground response–reinforcer relation. Journal of the Experimental Analysis of Behavior. 1994;61:65–81. doi: 10.1901/jeab.1994.61-65. [DOI] [PMC free article] [PubMed] [Google Scholar]
- Davison M, Baum W.M. Choice in a variable environment: Every reinforcer counts. Journal of the Experimental Analysis of Behavior. 2000;74:1–24. doi: 10.1901/jeab.2000.74-1. [DOI] [PMC free article] [PubMed] [Google Scholar]
- Davison M, Baum W.M. Choice in a variable environment: Effects of blackout duration and extinction between components. Journal of the Experimental Analysis of Behavior. 2002;77:65–89. doi: 10.1901/jeab.2002.77-65. [DOI] [PMC free article] [PubMed] [Google Scholar]
- Davison M, Baum W.M. Every reinforcer counts: Reinforcer magnitude and local preference. Journal of the Experimental Analysis of Behavior. 2003;80:95–129. doi: 10.1901/jeab.2003.80-95. [DOI] [PMC free article] [PubMed] [Google Scholar]
- Davison M, Baum W.M. Do conditional reinforcers count. Journal of the Experimental Analysis of Behavior. 2006;86:269–283. doi: 10.1901/jeab.2006.56-05. [DOI] [PMC free article] [PubMed] [Google Scholar]
- Davison M, Baum W.M. Local effects of delayed food. Journal of the Experimental Analysis of Behavior. 2007;87:241–260. doi: 10.1901/jeab.2007.13-06. [DOI] [PMC free article] [PubMed] [Google Scholar]
- Davison M, McCarthy D. The matching law: A research review. Hillsdale, NJ: Lawrence Erlbaum Associates; 1988. [Google Scholar]
- de Villiers P. Choice in concurrent schedules and a quantitative formulation of the law of effect. In: Honig W.K, Staddon J.E.R, editors. Handbook of operant behavior. Englewood Cliffs, NJ: Prentice Hall; 1977. (Eds.) [Google Scholar]
- Fleshler M, Hoffman H.S. A progression for generating variable-interval schedules. Journal of the Experimental Analysis of Behavior. 1962;5:529–530. doi: 10.1901/jeab.1962.5-529. [DOI] [PMC free article] [PubMed] [Google Scholar]
- Grace R.C, Bragason O, McLean A.P. Rapid acquisition of preference in concurrent chains. Journal of the Experimental Analysis of Behavior. 2003;80:235–252. doi: 10.1901/jeab.2003.80-235. [DOI] [PMC free article] [PubMed] [Google Scholar]
- Herrnstein R.J. Relative and absolute strength of response as a function of frequency of reinforcement. Journal of the Experimental Analysis of Behavior. 1961;4:267–272. doi: 10.1901/jeab.1961.4-267. [DOI] [PMC free article] [PubMed] [Google Scholar]
- Hunter I, Davison M. Determination of a behavioral transfer function: White-noise analysis of session-to-session response-ratio dynamics on concurrent VI VI schedules. Journal of the Experimental Analysis of Behavior. 1985;43:43–59. doi: 10.1901/jeab.1985.43-43. [DOI] [PMC free article] [PubMed] [Google Scholar]
- Krägeloh C.U, Davison M. Concurrent-schedule performance in transition: Changeover delays and signaled reinforcer ratios. Journal of the Experimental Analysis of Behavior. 2003;79:87–109. doi: 10.1901/jeab.2003.79-87. [DOI] [PMC free article] [PubMed] [Google Scholar]
- Krägeloh C.U, Davison M, Elliffe D.M. Local preference in concurrent schedules: The effects of reinforcer sequences. Journal of the Experimental Analysis of Behavior. 2005;84:37–64. doi: 10.1901/jeab.2005.114-04. [DOI] [PMC free article] [PubMed] [Google Scholar]
- Kyonka E.G.E, Grace R.C. Rapid acquisition of preference in concurrent chains when alternatives differ on multiple dimensions of reinforcement. Journal of the Experimental Analysis of Behavior. 2008;89:49–69. doi: 10.1901/jeab.2008.89-49. [DOI] [PMC free article] [PubMed] [Google Scholar]
- Landon J, Davison M. Reinforcer-ratio variation and its effects on rate of adaptation. Journal of the Experimental Analysis of Behavior. 2001;75:207–234. doi: 10.1901/jeab.2001.75-207. [DOI] [PMC free article] [PubMed] [Google Scholar]
- Landon J, Davison M, Elliffe D. Choice in a variable environment: Effects of unequal reinforcer distributions. Journal of the Experimental Analysis of Behavior. 2003;80:187–204. doi: 10.1901/jeab.2003.80-187. [DOI] [PMC free article] [PubMed] [Google Scholar]
- Lie C, Harper D.N, Hunt M. Human performance on a two-alternative rapid-acquisition choice task. Behavioural Processes. 2009;81:244–249. doi: 10.1016/j.beproc.2008.10.008. [DOI] [PubMed] [Google Scholar]
- Maguire D.R, Hughes C.E, Pitts R.C. Rapid acquisition of preference in concurrent schedule: Effects of reinforcement amount. Behavioural Processes. 2007;75:213–219. doi: 10.1016/j.beproc.2007.02.019. [DOI] [PubMed] [Google Scholar]
- Mazur J.E. Choice behavior in transition: Development of preference with ratio and interval schedules. Journal of Experimental Psychology: Animal Behavior Processes. 1992;18:364–378. doi: 10.1037//0097-7403.18.4.364. [DOI] [PubMed] [Google Scholar]
- Mazur J.E, Ratti T.A. Choice behavior in transition: Development of preference in a free-operant procedure. Animal Learning & Behavior. 1991;19:241–248. [Google Scholar]
- Schofield G, Davison M. Nonstable concurrent choice in pigeons. Journal of the Experimental Analysis of Behavior. 1997;68:219–232. doi: 10.1901/jeab.1997.68-219. [DOI] [PMC free article] [PubMed] [Google Scholar]


