Abstract
Four pigeons were trained on two-key concurrent variable-interval schedules with no changeover delay. In Phase 1, relative reinforcers on the two alternatives were varied over five conditions from .1 to .9. In Phases 2 and 3, we instituted a molar feedback function between relative choice in an interreinforcer interval and the probability of reinforcers on the two keys ending the next interreinforcer interval. The feedback function was linear, and was negatively sloped so that more extreme choice in an interreinforcer interval made it more likely that a reinforcer would be available on the other key at the end of the next interval. The slope of the feedback function was −1 in Phase 2 and −3 in Phase 3. We varied relative reinforcers in each of these phases by changing the intercept of the feedback function. Little effect of the feedback functions was discernible at the local (interreinforcer interval) level, but choice measured at an extended level across sessions was strongly and significantly decreased by increasing the negative slope of the feedback function.
Keywords: dynamics, feedback function, choice, relative reinforcer rate, keypeck, pigeon
A principal goal of behavior analysis is to understand how reinforcers act to maintain and change behavior. To inform this analysis, analogies have been drawn between behavioral and physical dynamics (e.g., Killeen, 1992; Marr, 1992). As typically arranged in behavior-analytic research and practice, a response-dependent contingency specifies a relation between behavior and its consequences, and such contingencies entail molar feedback functions (whether we can specify them easily or not; e.g., Baum, 1981, 1989; Marr, 2006; Soto, McDowell & Dallery, 2006). A feedback arrangement like this is inherently a dynamical system.
Given a feedback function relating response rate and reinforcement rate, we can ask how changes in reinforcement rate feedback cause changes in response rate. For ratio schedules, response rate and reinforcement rate are simply proportional: Increases in response rate under ratio schedules directly increase reinforcement frequency and vice versa—positive feedback that yields high rates of responding at low-to-moderate ratios, and zero responding at very high ratios. When interresponse times (IRTs) > t lead to reinforcers, increases in response rate lead to reductions in reinforcer frequency and vice versa—negative feedback functions that ultimately result in a relatively stable patterns of behavior determined by the value of t. In dynamical systems theory, such dynamic equilibria are called attractors.
For some schedules, large changes in response rates may occur without changing reinforcer frequency. This is obviously the case for fixed- and variable-interval (VI) schedules. Nevin and Baum (1980), for example, described how the feedback function for interval schedules flattens at moderate to high response rates. However, even under interval schedules, stable patterns of responding emerge, though the dynamics controlling these patterns may be quite complex (Anger, 1956; Morse, 1966). In general, contingencies (following some transient effects) ultimately engender attractors as revealed by consistent patterns of responding.
We may extend the concept of the feedback function describing how reinforcer rate changes with response rate under single schedules to choice under concurrent schedules; that is, we may explore conditions under which variations in choice control variations in relative and/or overall reinforcer rate. For instance, on concurrent VI VI schedules, choice does not affect obtained overall relative or reinforcer rates unless choice is very extreme or the overall reinforcer rate is high (Davison & McCarthy, 1988; Staddon & Motheral; 1978). However, on other concurrent schedules, such as independently arranged ratio schedules, relative frequencies of reinforcers are a direct function of relative choice (a positive feedback function), so choice tends to become extreme to one alternative or the other (Herrnstein & Loveland, 1975; Mazur, 1992).
A particularly interesting case of dynamics occurs when current choice shifts the reinforcement conditions so as to make other, alternative, behaviors more likely. A classic example is the depleting food patch. As food is extracted from a patch with a low repletion rate, search time for additional food in the patch will increase and, at some point, the organism will move to an alternative patch. Given appropriate experience within such a patchy environment, how long a patch is explored depends on, among other variables, the level of depletion in the patch relative to the overall availability of food from all the patches (e.g., Shettleworth, 1998). If patches only contain a single prey item, animals may learn to exit from the patch after a single prey capture (e.g., Krägeloh, Davison, & Elliffe, 2005). Alternation is but one example of the general situation in which what the animal just did, and/or what the animal has just received, control the subsequent contingencies of reinforcement following the prey item.
In the present experiment, we explore a situation in which choice in an interreinforcer interval (IRI) on concurrent VI VI schedules changes the likely location of the next reinforcer via a specified feedback function,. This kind of situation has been investigated before. Vaughan (1981) arranged a complex feedback function in which choice, measured by time allocation in an unsignaled 4-min period, changed both the relative and overall rates of reinforcers in the following 4 min. Two different feedback functions were used in two successive conditions (Conditions a and b). In both, the pigeons were able to equalize time and reinforcer proportions (that is, to match) in two different areas of choice (between 12.5% and 25%, or between 75% and 87.5%, of responses to one key)—that is, in terms of matching, there were two attractors. The pigeons could also maximize their overall reinforcer rates by responding in just one of these two areas of choice. Choice location changed between the two conditions, and choice matched relative reinforcer frequencies; but choice did not maximize overall reinforcer rate (see also Davison & Kerr, 1989). Vaughan explained the change in choice between the two matching attractors between conditions by melioration—that animals attempt to equalize local reinforcer rates (reinforcers per time spent responding on an alternative), which would have progressively driven choice in Condition b towards the region observed in that condition if choice strayed outside the observed matching attractor in Condition a.
Silberberg and Ziriax (1985) arranged a simplification of Vaughan's (1981) feedback-function procedure in which relative choice in an interval affected both the relative and overall reinforcer rate in the next interval. Specifically, in their Conditions 1 and 6, a relative right-key time allocation less than .25 in an interval produced a relative right-key reinforcer rate of .89 in the next interval; and a time allocation of greater than .75 produced a relative reinforcer rate of .11. These choices also produced overall reinforcer rates of 1 and 4.5 reinforcers/min respectively. The application of these contingencies affected choice when the interval in which they operated was 6 s, but not when it was 4 min, thus questioning the generality of Vaughan's findings.
Davison and Alsop (1991) replicated and extended Silberberg and Ziriax's (1985) Conditions 3 and 8, each of which used only a single criterion of choice: Within a time interval, if the relative left-key response rate was greater than .75, the relative left-key reinforcer rate was .018 in the next time interval, and the overall reinforcer rate increased from 0.36 to 10.2/min. Consistent with Silberberg and Ziriax, the results showed that control by these contingencies increased as the interval duration was decreased from 240 s to 5 s.
The feedback function used by Vaughan (1981) determined a continuous change in both relative and absolute reinforcer rates according to the value of choice in an interval. However, both Silberberg and Ziriax (1985) and Davison and Alsop (1991) used a discrete criterion of choice, and a discrete change in only absolute reinforcer rate. For instance, in Davison and Alsop's experiment, if relative responding to the left key in an interval was > .75, one reinforcer rate was in effect; if it was < .75, a different reinforcer rate was in effect. As far as we are able to ascertain, the effects on choice of a continuous feedback relation between relative choice and relative reinforcer rate have not been investigated since Vaughan (1981). This was the focus of the present experiment.
We investigated the effects of a relation between choice in an IRI and relative reinforcer rate (or expected times to reinforcers) in the subsequent IRI when the overall rate of reinforcers was kept constant. Can choice in an IRI act as a discriminative stimulus to control choice in the next interval via a continuous quantitative change in contingencies? We ask this in the context of a continuous, linear, negative feedback function: As choice (measured by response ratio) in an IRI moved toward one alternative, so the reinforcer ratio in the next interval moved proportionately towards the other alternative. We chose the IRI as our time interval for measuring choice and applying the consequences of that choice simply because this seemed a more natural, demarcated interval than a fixed time, and we anticipated this would enhance control. In all conditions, we arranged concurrent exponential VI VI schedules; and, unlike previous research, we kept the scheduled overall reinforcer rate constant across all conditions. We conducted three phases of conditions: In Phase 1, a control phase, we arranged standard concurrent VI VI schedules in which, over five conditions, the overall reinforcer rate was kept constant, and the relative reinforcer rate was varied. In Phase 2, we arranged a negative feedback function of slope −1 between log response ratios in an IRI and the log response ratio in the next interval. Across conditions, we varied the intercept of this linear feedback function to vary the overall obtained reinforcer ratios across five values which, we planned, would be a similar range to that in Phase I. Phase 3 was the same as Phase 2, except that the slope of the negative feedback function was increased to −3. Thus, in Phase 2, in the 0 intercept condition, a response ratio of 4∶1 in an IRI would be followed by a reinforcer ratio of 1∶4 in the next interval. In Phase 3, the same choice would be followed by a reinforcer ratio of 1∶12 in the next interval.
METHOD
Subjects
Six homing pigeons numbered 41 to 46 served in the experiment. They were maintained at 85% ± 15 g of their ad lib body weights by feeding mixed grain after experimental sessions. They had previously worked on conditional-discrimination procedures, so required no initial training. Pigeons 41 and 43 died during the experiment, and no data are reported for them.
Apparatus
The subjects lived in individual 375-mm high by 370-mm deep by 370-mm wide cages, and these cages also served as the experimental chambers. Water and grit were available at all times. On the right wall of the cage were four 20-mm diameter plastic pecking keys set 70 mm apart, center-to-center, and 220 mm above a wooden perch situated 100 mm from the wall and 20 mm from the grid floor. Only the leftmost two keys were used in the present experiment, and these will be termed the left and right keys. Both keys could be transilluminated by red LEDs, and responses to illuminated keys exceeding about 0.1 N were counted as effective responses. In the center of the wall, 60 mm from the perch, was a 40- by 40-mm magazine aperture. During food delivery, the key lights were extinguished, the aperture was illuminated, and the hopper, containing wheat, was raised for 3 s. The subjects could see and hear pigeons in other experiments, but no personnel entered the experimental room while the experiments were running. A further wooden perch, at right angles to the above perch and 100 mm from the front wall of the cage, allowed the pigeons access to grit and water in containers outside the cage.
Procedure
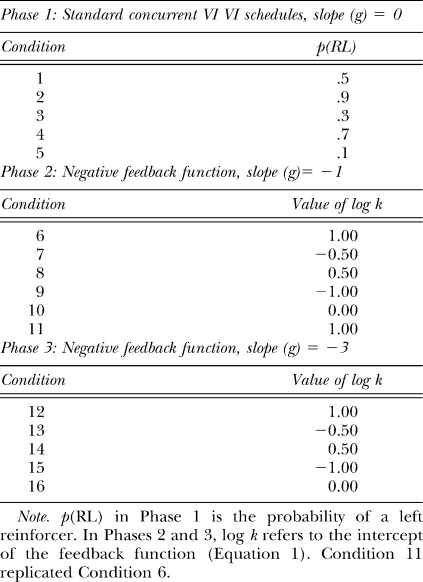
Because the pigeons had been trained previously, no shaping was required, and the pigeons were immediately exposed to the contingencies of Condition 1 (Table 1) at the start of the experiment. Sessions were arranged in the pigeons' home cages.
Table 1.
Sequence of experimental conditions.
The general procedure through all phases of the experiment was a concurrent dependent exponential VI VI schedule that provided an overall 2.22 reinforcers per min (VI 27 s), with no changeover delay. The schedules were arranged by interrogating a probability gate set at p = .037 every 1 s. When a reinforcer was arranged according to this base VI schedule, it was then allocated to the left and right keys with, in Phase 1, a series of fixed probabilities across conditions that produced a set of relative left-key reinforcer rates from .1 to .9 in five steps. These probabilities were presented in an irregular order (Conditions 1 through 5, see Table 1.) Phase 1, then, was a standard concurrent VI VI schedule in which relative reinforcers were changed across conditions.
In Phases 2 and 3, the relative reinforcer rate was changed following each reinforcer depending on the relative choice in the preceding interreinforcer interval, according to the following straight-line feedback function:
The subscript i refers to the current scheduled reinforcer, and i−1 to the immediately preceding interreinforcer interval. In Phases 2 and 3, the value of g, the slope of this relation, was −1 and −3 respectively. This feedback function changed the probabilistic reinforcer ratio for the next reinforcer a smaller amount when choice in the previous IRI was close to indifference, and a larger amount when choice was more extreme. Across conditions in these phases (Table 1), the value of log k was varied from −1 to 1 over five conditions. This variation biases the feedback function toward one alternative or the other, resulting in a variation across conditions in the overall numbers of reinforcers per session allocated to the left and right keys. The sequence of experimental conditions is shown in Table 1. In Phase 1, the value of g was 0 (choice in the last interreinforcer interval did not change the relative probability of the next reinforcer), and log k is the arranged log reinforcer ratio in the five conditions. In Phases 2 and 3, the first reinforcer in a session was allocated to the left key with a probability of .1, so each session usually started with a right-key reinforcer. This was done to expose the pigeons to the feedback function at the start of every session.
Sessions commenced at 01:00 hr in a day–night shifted environment in which the laboratory lights were turned on at 00:30 hr and turned off at 16:00 hours, and were signalled by the onset of the key lights. Sessions ended in the blackout of the response keys after 45 min or 60 reinforcers, whichever came first. Each condition was in effect for 65 daily sessions in order to ensure the performance was stable.
RESULTS
The data used in all analyses were from the last 10 sessions of each experimental condition.
Two parameters of the feedback function that we arranged (Equation 1) jointly determined the next probability of reinforcers on the two keys: the slope, g, of the function and the intercept, k. As the value of g was changed across the three phases from 0, through −1, to −3, choice in an interreinforcer interval increasingly changed the relative frequency of reinforcers in the next interreinforcer interval. The value of k, varied across conditions within phases, changed the overall relative frequency of reinforcers on the keys. Thus, we would expect that variation in k would change choice according to the generalized matching relation (Baum, 1974; Staddon, 1968).
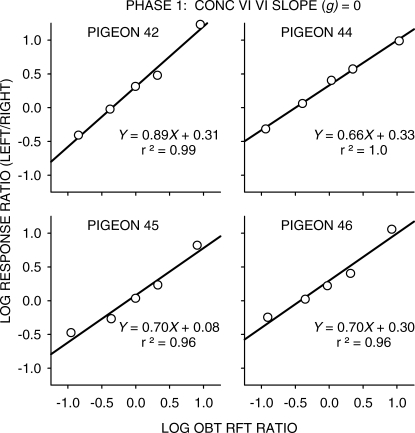
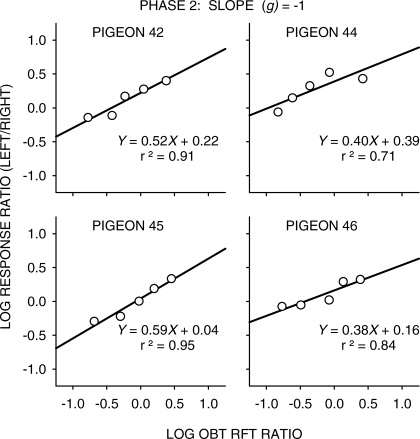
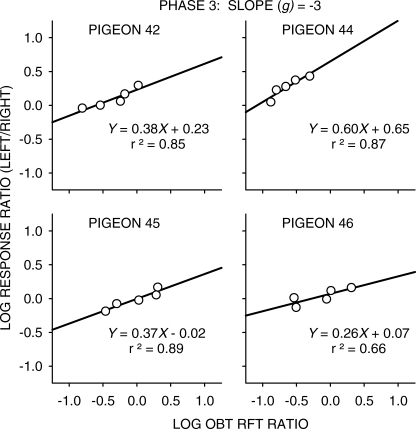
Figures 1, 2 and 3 (Phases 1, 2 and 3 respectively) show log response ratio versus log obtained-reinforcer ratio plots for each pigeon. Because of the feedback function, the distribution of obtained reinforcer ratios will be affected by preference in Conditions 2 and 3. For example, in Phase 3 (Figure 3), Pigeon 44 showed a very strong left-key bias. More responding to the left key would, via the feedback function, increase the number of reinforcers obtained on the right key, thus systematically decreasing the obtained log left/right reinforcer ratio. The steeper the negative feedback function, the greater will this effect be. A similar effect can be seen in the data of Pigeon 42 in Phase 3 (Figure 3). It also will be the case that a feedback function with greater negative slope will decrease obtained log reinforcer ratios at more extreme preferences, decreasing the range of obtained reinforcer ratios across conditions. Such an effect can be seen in the data from Phase 2 (Figure 2).
Fig 1.
Phase 1: Log response ratios as a function of log reinforcer ratios for all 4 pigeons. Straight lines were fitted to the data by the method of least squares, and the equations of the best fitting lines are shown on each graph. Also shown is the variance accounted for (r2).
Fig 2.
Phase 2: Log response ratios as a function of log reinforcer ratios for all 4 pigeons. Straight lines were fitted to the data by the method of least squares, and the equations of the best fitting lines are shown on each graph. Also shown is the variance accounted for (r2).
Fig 3.
Phase 3: Log response ratios as a function of log reinforcer ratios for all 4 pigeons. Straight lines were fitted to the data by the method of least squares, and the equations of the best fitting lines are shown on each graph. Also shown is the variance accounted for (r2).
We fitted the generalized-matching relation (Baum, 1974; Staddon, 1968):
using least-squares linear regression, for each pigeon and phase separately, and the obtained regression lines and their parameters are also shown in Figures 1 to 3. The generalized-matching relation generally fitted well, with high proportions of variance accounted for (r2— remembering that variance accounted for is necessarily directly related to slope). The intercept values (log c in Equation 2) did not change significantly as g was changed (Friedman nonparametric ANOVA, p > .05). The values of sensitivity to reinforcement (Lobb & Davison, 1975; a in Equation 2) for Phase 1 were within the range normally obtained for concurrent VI VI schedules (Baum, 1979; Taylor & Davison, 1983). All pigeons except Pigeon 45 showed quite a strong left-key bias (log c in Equation 2 was positive). Sensitivity to reinforcement fell significantly (Kendall's 1955 nonparametric trend test, N = 4, k = 3, ΣS = 9, p < .05) from Phase 1 through Phase 2 to Phase 3 as g was changed from 0 to −3. The feedback-function parameters thus affected extended-level matching in two ways: First, the intercept of the feedback function, k, clearly controlled choice, because the fitted slopes of Equation 2 were all substantially greater than zero. Second, the slope of the feedback function, g, changed the way in which obtained reinforcer ratios controlled choice, because the slopes of Equation 2 changed with the slope of the feedback function.
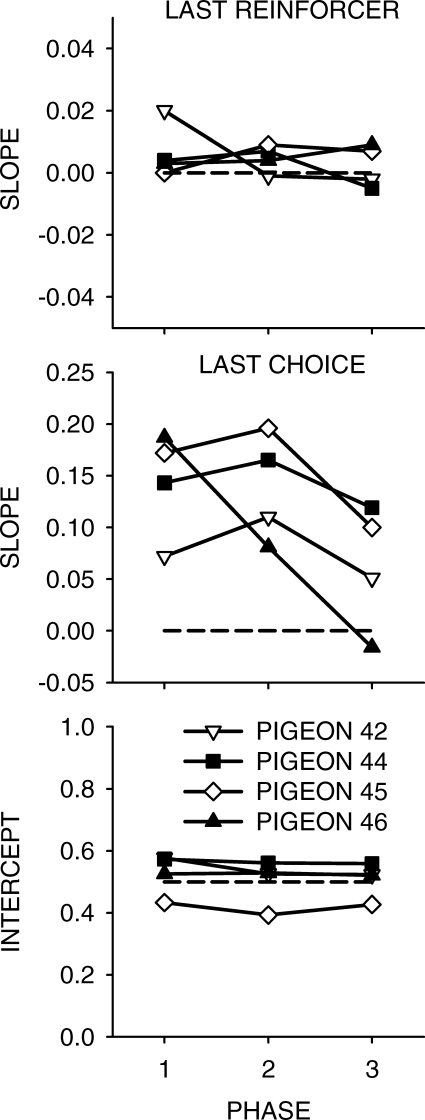
Because the feedback-function slope parameter g resulted in changes in extended-level matching, we may be able to see changes between phases at the level of choice in successive interreinforcer intervals. If the pigeon's local choices were affected by the feedback function—if they had learned a rule of the sort “the more I respond on this key now, the more likely the next reinforcer after this one will be on the other key”—there should be a negative relation between choice in successive interreinforcer intervals. However, choice in an interreinforcer interval may also be affected by the location of the last reinforcer (which is the same as the last, reinforced, response). Thus, we investigated this relation by conducting multiple linear regressions of relative choice in each interreinforcer interval as a function of relative choice in the last interreinforcer interval and the location of the reinforcer ending the last interreinforcer interval. Because the latter variable can take only two values (left or right reinforcer), the last reinforcer value was 1 or 0—a proxy for a relative left-key reinforcer. Proportional, rather than log ratio, choice measures were used for this analysis because choice could be, and reinforcer frequency must be, exclusive in an interreinforcer interval. Of course, the relations involved may not be linear, and this analysis is only a first approximation to quantifying, via the coefficients of each part of the multiple regressions, changes in control of current choice by recent choice and by recent reinforcement. The results are shown in Figure 4.
Fig 4.
The results of multiple linear regressions using choice in each interreinforcer interval as the dependent variable, and the location of the last reinforcer (a dummy variable of 1 [Left] or 0 [Right]) and the relative choice in the last interreinforcer interval as the independent variables. These fits were carried out using relative measures, rather than log-ratio measures, to allow the last-reinforcer variable to be properly specified. The dashed horizontal lines show zero in the top two graphs, and .5 in the bottom graph.
There was no significant effect of the value of the feedback-function slope, g, on control by the prior IRI choice over choice in the next IRI according to a nonparametric trend test (N = 4, k = 3, ΣS = −6, p > .05). However, while control of current choice by choice in the last IRI increased for 3 of the 4 pigeons between Phases 1 and 2, this measure decreased for all pigeons both between Phases 1 and 3, and between Phases 2 and 3. Arguably, then, control over IRI choice was enhanced by the increasing value of g in the feedback function, but the control was incomplete. But an unexpected result was that these slopes were positive for all pigeons in all phases apart from Pigeon 46 in Phase 3—that is, despite the negative feedback function, choice in an IRI was positively related to choice in the last IRI when the effect of the last reinforcer was removed.
Figure 4 also shows that the effect of prior reinforcers on subsequent IRI choice did not change across phases (N = 4, k = 3, ΣS = 0, p > .05), and that the effect of prior reinforcers, while positive in 9 of 12 cases, was very small (means: 0.007, 0.005, and −0.0002 for Phases 1 to 3 respectively). In Phase 1, 15 of 20 (4 subjects, 5 conditions) showed a positive slope for control by the prior reinforcer (binomial p < .05). No such significant effects were found in Phases 2 and 3. There was no significant change in the value of the intercept from the multiple linear regressions (a measure of bias). In this analysis, using relative measures, zero generalized matching bias (log c = 0) equates to a relative intercept of .5.
The Distribution of Interreinforcer Choice
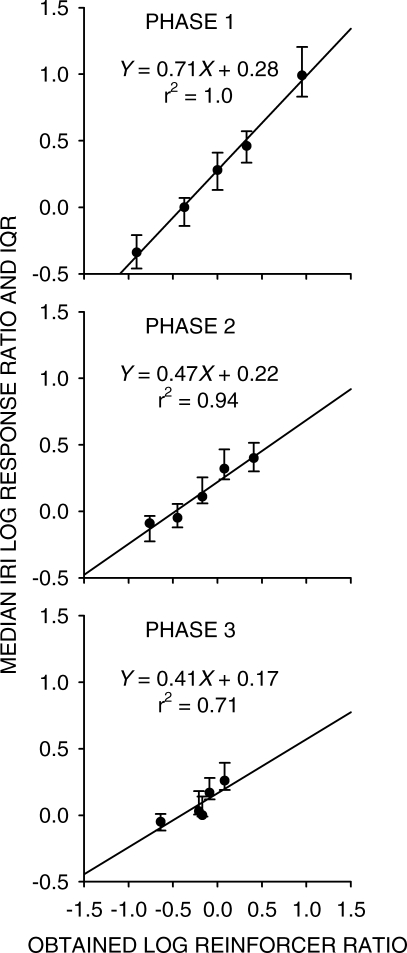
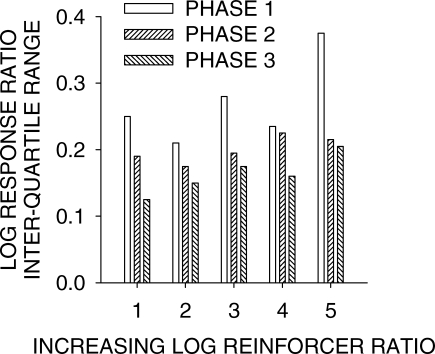
We might expect that the negative feedback functions arranged in Phases 2 and 3 would progressively change the range of choice measures in interreinforcer intervals. For instance, the Phase-3 feedback function with a slope of −3 could cause extreme oscillations in choice during successive interreinforcer intervals, though the analysis above suggests otherwise. We investigated this possibility by finding the median interreinforcer choice for each pigeon, and the interquartile range of the distribution of these choice measures, across all conditions and phases. Figure 5 shows the results of this analysis. A comparison of the regression data in Figure 4 with the equivalent median data from linear regressions from Phases 1 to 3 (extended data in parentheses) gives: Slopes: Phase 1, 0.71 (0.70); Phase 2, 0.47 (0.46); Phase 3, 0.41 (0.39); Intercepts: Phase 1, 0.28 (0.31); Phase 2, 0.22 (0.19); Phase 3, 0.18 (0.18). Thus, the relations between median interreinforcer choice and log obtained reinforcer ratio, and between choice averaged across the last 10 sessions and log obtained reinforcer ratio, were similar, with similar changes in sensitivity across phases. The interquartile ranges for the ordinal log reinforcer ratios, shown in Figure 6, decreased monotonically across the three phases (trend test, p < .05). Thus, changing the negative slope of the feedback function from 0 through −1, and then −3, significantly reduced the variability in IRI choice.
Fig 5.
Median values, and their interquartile ranges, of interreinforcer choice as a function of the obtained log Left/Right reinforcer ratios for each condition in each phase. The lines for each phase were fitted using least-squares linear regression.
Fig 6.
Interquartile ranges of interreinforcer choice measures for ordinally-increasing Left/Right reinforcer ratios for each phase of the experiment.
DISCUSSION
When choice in an IRI produced an inverse change in the relative reinforcers in the next IRI, the sensitivity of extended choice over whole sessions to obtained extended reinforcer ratios depended on the degree of this inverse change. These findings may have a bearing on naturally occurring choice contingencies, in which current choice often does affect subsequent reinforcers at locations. An example is the foraging situation discussed in the introduction—which arranges a negative feedback function. Another general situation, absent in standard concurrent VI VI schedules, occurs when current choice has a positive feedback relation on subsequent reinforcers. In this case, choice will likely become extreme and stabilize at one or the other alternative, as on independently arranged concurrent VR VR schedules, also surely common in nature. Thus, concurrent VI VI schedule performance does not constitute a general analog of choice.
The procedure used here in Phases 2 and 3 is not a simple inverse of the contingencies that operate in concurrent VR VR schedules. In independent concurrent VR VR schedules, there is a positive feedback function between relative preference in an IRI and relative probability of reinforcers that end that same IRI. If there is also a positively sloped relation, however shallow, between reinforcer delivery and subsequent choice (perhaps because of a reinforcement effect, or because of a bias for staying resulting from punishment for changing over), these two functions acting together will induce a change in preference toward extreme values. Choice does not become exclusive under dependently scheduled concurrent VR VR schedules in which there is no relation between current IRI choice and relative reinforcer frequency (Bailey & Mazur, 1990; Mazur, 1992; Mazur & Ratti, 1991), suggesting that the combination of both the behavioral “repeat the same response” effect and the positive environmental feedback function is necessary for changes in choice. The present research generally supports this conclusion, having shown a small “repeat the same response” effect (shown in Figure 4 as the “Last Reinforcer effect”, a proxy for the “Last Response effect”) with a negative feedback function between last IRI choice and next reinforcer location. As the slope of the negative feedback function was steepened across phases, performance appeared to come more under control by the negative feedback function independently of the “Repeat the Last Response” effect, and extended choice became less extreme than the relative reinforcer frequency.
How did the extended-level change in sensitivity to reinforcement come about? It appeared to come, partly or wholly, from increased control by choice in the last IRI over choice in the next interval, resulting from the changed relation between IRI choice and the likely location of the next reinforcer (Figure 4). Thus, it appears that at the local level, pigeons' allocations of responses did come under control of their recent choice proportions and the relation between these choices and the probable location of the next reinforcer. However, the effect of the negative contingency was generally small, and did not, even with the most negative feedback-function slope (Phase 3), approximate anything like alternation, nor even become negative for 3 of 4 pigeons.
Control of choice by choice in the last IRI has two requirements: Both choice in the prior IRI, and the reinforcer contingencies in the subsequent IRI, must be discriminable. In Phases 2 and 3 of the present experiment, both of these discriminations will be difficult because (a), both required the discrimination of continuous variables, and (b), the subsequent reinforcer contingencies were probabilistic. Because of the greater change in reinforcer contingencies in Phase 3 compared to Phase 2, we would expect better discrimination of the subsequent reinforcer contingencies, and indeed found this. Given that extended-level, whole-session, choice measures are composed of local choices, then any local control by our feedback function should also change extended-level choice measures, and they did so. Extended sensitivity to reinforcement (Figures 1 to 3) decreased progressively as the slope g was changed from 0 to −3 (Equation 1). The changes in extended sensitivity were relatively large. Could extended sensitivity have been brought even lower by an even steeper negative feedback function? Presumably: In the limiting case, with a negative feedback function of infinite slope, reinforcers would alternate if and only if control over choice was perfect, and sensitivity would approach zero—but it seems likely that this could only occur if log k in Equation 1 was 0. Additionally, for one or both of the reasons given above, pigeons are poor at alternation (Krägeloh et al., 2005), and this limiting value would surely not be obtained. Choice in pigeons, and probably other animals, is thus biased toward repeating a just-reinforced response, and against alternating, though some degree of control can be achieved (Krägeloh et al.) especially when alternation is signalled by an event that is a poor reinforcer or not a reinforcer at all (Davison & Baum, 2006).
We found that distributions of choice across IRIs did become tighter as g was increased (Figure 6). Thus, the pigeons did not develop a strategy of alternating extreme choices in successive IRIs. Indeed, such a strategy for optimizing reinforcer rates would fail when the value of the intercept to the feedback function was varied. The local negative feedback function did produce less variable choice data than standard concurrent VI VI schedules, and had an effect similar to Blough's (1966) procedure of differentially reinforcing least-frequent interresponse times. Both our feedback function and the Blough procedure show clearly that behavior, response rate, or choice can come under the control of the animal's own prior behavior as a discriminative stimulus, when appropriate contingencies of reinforcement are applied. This, of course, is nothing new, having been demonstrated by Ferster and Skinner (1957) in, for example, mixed fixed-ratio schedules. The present results extend the list of behaviors that can acquire discriminative stimulus control from simple single-schedule responses to choice. Ferster and Skinner's mixed-schedule results were arguably produced by a reasonably discrete binary stimulus (fewer responses versus more responses than the smaller ratio); Blough's and our results add graded control by a continuous behavioral variable over a continuous reinforcer variable. Indeed, control by continuous behavioral or exteroceptive variables on dimensions has been rather little studied in behavior analysis—apart from (relatively) continuous control by elapsed time over choice, which has been studied by Green, Fisher, Perlow and Sherman (1981) under the rubric of self-control.
In conclusion, we showed that the relation between relative choice and relative reinforcers at the extended level can be manipulated by imposing a negative feedback function between local choice in an IRI and relative reinforcer probability in the next IRI. While these added contingencies produced individually small changes at the local level, they produced relatively large changes in choice allocation at the extended level. However, the present results cannot be used to argue that extended-level choice changes result from changes in local contingencies of reinforcement, rather than from extended-level reinforcer-frequency changes as suggested by Baum (2002), because local contingency changes do affect more extended contingencies (for instance, the conditional probability of a reinforcer on an alternative given the same reinforcer; Krägeloh et al., 2005). Equally, of course, extended-level manipulations do affect more local contingencies. Thus, the jury remains out on the locus of control of extended choice, if indeed there is a single locus. More fundamentally, it is hard to imagine how differing levels of control could be empirically dissociated.
Acknowledgments
We thank members of the Experimental Analysis of Behaviour Research Unit for helping to run these experiments, and Mick Sibley for taking care of our pigeons. MJM also thanks Georgia Institute of Technology for sabbatical support.
REFERENCES
- Anger D. The dependence of interresponse times upon the relative reinforcement of different interresponse times. Journal of Experimental Psychology. 1956;52:145–161. doi: 10.1037/h0041255. [DOI] [PubMed] [Google Scholar]
- Bailey J.T, Mazur J.E. Choice behavior in transition: Development of preference for the higher probability of reinforcement. Journal of the Experimental Analysis of Behavior. 1990;53:409–422. doi: 10.1901/jeab.1990.53-409. [DOI] [PMC free article] [PubMed] [Google Scholar]
- Baum W.M. On two types of deviation from the matching law: Bias and undermatching. Journal of the Experimental Analysis of Behavior. 1974;22:231–242. doi: 10.1901/jeab.1974.22-231. [DOI] [PMC free article] [PubMed] [Google Scholar]
- Baum W.M. Matching, undermatching, and overmatching in studies of choice. Journal of the Experimental Analysis of Behavior. 1979;32:269–281. doi: 10.1901/jeab.1979.32-269. [DOI] [PMC free article] [PubMed] [Google Scholar]
- Baum W.M. Optimization and the matching law as accounts of instrumental behavior. Journal of the Experimental Analysis of Behavior. 1981;36:387–403. doi: 10.1901/jeab.1981.36-387. [DOI] [PMC free article] [PubMed] [Google Scholar]
- Baum W.M. Quantitative prediction and molar description of the environment. The Behavior Analyst. 1989;12:167–176. doi: 10.1007/BF03392493. [DOI] [PMC free article] [PubMed] [Google Scholar]
- Baum W.M. From molecular to molar: A paradigm shift in behavior analysis. Journal of the Experimental Analysis of Behavior. 2002;78:95–116. doi: 10.1901/jeab.2002.78-95. [DOI] [PMC free article] [PubMed] [Google Scholar]
- Blough D.S. The reinforcement of least-frequent interresponse times. Journal of the Experimental Analysis of Behavior. 1966;9:581–591. doi: 10.1901/jeab.1966.9-581. [DOI] [PMC free article] [PubMed] [Google Scholar]
- Davison M, Alsop B. Behavior-dependent reinforcer-rate changes in concurrent schedules: A further analysis. Journal of the Experimental Analysis of Behavior. 1991;56:1–19. doi: 10.1901/jeab.1991.56-1. [DOI] [PMC free article] [PubMed] [Google Scholar]
- Davison M, Baum W.M. Do conditional reinforcers count. Journal of the Experimental Analysis of Behavior. 2006;86:269–283. doi: 10.1901/jeab.2006.56-05. [DOI] [PMC free article] [PubMed] [Google Scholar]
- Davison M, Kerr A. Sensitivity of time allocation to an overall reinforcer rate feedback function in concurrent interval schedules. Journal of the Experimental Analysis of Behavior. 1989;51:215–231. doi: 10.1901/jeab.1989.51-215. [DOI] [PMC free article] [PubMed] [Google Scholar]
- Davison M, McCarthy D. The matching law: A research review. Hillsdale, NJ: Erlbaum; 1988. [Google Scholar]
- Ferster C.B, Skinner B.F. Schedules of reinforcement. New York: Appleton-Century-Crofts; 1957. [Google Scholar]
- Green L, Fisher E.B, Jr, Perlow S, Sherman L. Preference reversal and self-control: Choice as a function of reward amount and delay. Behaviour Analysis Letters. 1981;1:43–51. [Google Scholar]
- Herrnstein R.J, Loveland D.H. Maximizing and matching on concurrent ratio schedules. Journal of the Experimental Analysis of Behavior. 1975;24:107–116. doi: 10.1901/jeab.1975.24-107. [DOI] [PMC free article] [PubMed] [Google Scholar]
- Kendall M.G. Rank correlation methods. London: Charles Griffin; 1955. [Google Scholar]
- Killeen P.R. Mechanics of the animate. Journal of the Experimental Analysis of Behavior. 1992;57:429–463. doi: 10.1901/jeab.1992.57-429. [DOI] [PMC free article] [PubMed] [Google Scholar]
- Krägeloh C.U, Davison M, Elliffe D.M. Local preference in concurrent schedules: The effects of reinforcer sequences. Journal of the Experimental Analysis of Behavior. 2005;84:37–64. doi: 10.1901/jeab.2005.114-04. [DOI] [PMC free article] [PubMed] [Google Scholar]
- Lobb B, Davison M.C. Performance in concurrent interval schedules: A systematic replication. Journal of the Experimental Analysis of Behavior. 1975;24:191–197. doi: 10.1901/jeab.1975.24-191. [DOI] [PMC free article] [PubMed] [Google Scholar]
- Marr M.J. Behavior dynamics: One perspective. Journal of the Experimental Analysis of Behavior. 1992;57:249–266. doi: 10.1901/jeab.1992.57-249. [DOI] [PMC free article] [PubMed] [Google Scholar]
- Marr M.J. Food for thought on feedback functions. European Journal of Behavior Analysis. 2006;7:181–185. [Google Scholar]
- Mazur J.E. Choice behavior in transition: Development of preference with ratio and interval schedules. Journal of Experimental Psychology: Animal Behavior Processes. 1992;18:364–378. doi: 10.1037//0097-7403.18.4.364. [DOI] [PubMed] [Google Scholar]
- Mazur J.E, Ratti T.A. Choice behavior in transition: Development of preference in a free-operant procedure. Animal Learning and Behavior. 1991;19:241–248. [Google Scholar]
- Morse W.H. Intermittent reinforcement. In: Honig W.K, editor. Operant behavior: Areas of research and application. New York, NY: Appleton-Century-Crofts; 1966. (Ed.) [Google Scholar]
- Nevin J.A, Baum W.M. Feedback functions for variable-interval reinforcement. Journal of the Experimental Analysis of Behavior. 1980;34:207–217. doi: 10.1901/jeab.1980.34-207. [DOI] [PMC free article] [PubMed] [Google Scholar]
- Shettleworth S.J. Cognition, evolution and behavior. New York, NY: Oxford University Press; 1998. [Google Scholar]
- Silberberg A, Ziriax J.M. Molecular maximizing characterizes choice on Vaughan's (1981) procedure. Journal of the Experimental Analysis of Behavior. 1985;43:83–96. doi: 10.1901/jeab.1985.43-83. [DOI] [PMC free article] [PubMed] [Google Scholar]
- Soto P.L, McDowell J.J, Dallery J. Feedback functions, optimization, and the relation of response rate to reinforcement rate. Journal of the Experimental Analysis of Behavior. 2006;85:57–81. doi: 10.1901/jeab.2006.13-05. [DOI] [PMC free article] [PubMed] [Google Scholar]
- Staddon J.E.R. Spaced responding and choice: A preliminary analysis. Journal of the Experimental Analysis of Behavior. 1968;11:669–682. doi: 10.1901/jeab.1968.11-669. [DOI] [PMC free article] [PubMed] [Google Scholar]
- Staddon J.E.R, Motheral S. On matching and maximizing in operant choice experiments. Psychological Review. 1978;85:436–444. [Google Scholar]
- Taylor R, Davison M. Sensitivity to reinforcement in concurrent arithmetic and exponential schedules. Journal of the Experimental Analysis of Behavior. 1983;39:191–198. doi: 10.1901/jeab.1983.39-191. [DOI] [PMC free article] [PubMed] [Google Scholar]
- Vaughan W., Jr Melioration, matching, and maximization. Journal of the Experimental Analysis of Behavior. 1981;36:141–149. doi: 10.1901/jeab.1981.36-141. [DOI] [PMC free article] [PubMed] [Google Scholar]


