Abstract
K7M2 mouse osteosarcoma cells form lytic tumors and are deficient in osterix (Osx), a zinc finger–containing transcription factor required for osteoblast differentiation and bone formation. Our previous studies showed that replacement of Osx suppresses lytic bone destruction. Cytokines, including interleukin (IL)-1α, IL-6, IL-11, and prostaglandin E2, have been shown to stimulate osteoclast activity. We showed that IL-1α production by K7M2 cells was significantly suppressed following Osx transfection through a transcription-mediated mechanism. Osx had no effect on IL-6, IL-11, or prostaglandin E2. Site-directed mutagenesis and chromatin immunoprecipitation indicated that Osx down-regulated IL-1α through an Sp1-binding site on the IL-1α promoter. Inhibiting Osx by small interfering RNA in two cell lines (Dunn and DLM8) that expressed high levels of Osx led to enhanced IL-1α promoter activity and protein production and altered the phenotype from blastic to lytic. These data suggest that Osx down-regulates IL-1α expression in mouse osteosarcoma cells via transcriptional repression of IL-1α and this may in turn affect the lytic activity of the tumor cells.
Introduction
Osteosarcoma, the most common primary malignant bone tumor in both children and adults (1), has a peak incidence during the second decade of life, with an additional smaller peak after age 50 (2). Osteosarcoma is defined as a malignant tumor of mesenchymal cells, characterized by the direct formation of malignant osteoid and/or woven bone of the tumor (3). Osteosarcoma lesions are also characterized by bone destruction of high biological virulence. The tumor originates within bone, invades, and rapidly destroys the cortical tissue. The destruction of bone is believed to be caused by osteoclasts (3).
Osterix (Osx), a zinc finger–containing transcription factor, is expressed in the osteoblasts of all endochondral and membranous bones (4). We previously showed that mouse K7M2 osteosarcoma cells, which are deficient in Osx, cause osteolytic tumors when injected into the tibia. Replacement of Osx suppresses lytic bone destruction (5). The receptor activator of nuclear factor-κB ligand (RANKL) is a member of the tumor necrosis factor family produced by marrow stromal cells and osteoblasts, which is critical to osteoclast formation (6). RANK is expressed mainly in osteoclasts and dendritic cells (7-11); RANKL binds to the RANK receptor on osteoclast precursors and induces osteoclastic formation (12). Therefore, alterations in RANKL protein secretion by tumor cells may affect their lytic activity. Suppression of RANKL expression would result in decreased osteolysis. However, we were unable to show a decrease in RANKL expression following Osx transfection (5).
Interleukin (IL)-1α is a cytokine with potent stimulatory effects on osteoclastogenesis. These are mediated via the production of RANKL by marrow stromal cells and osteoblasts (13, 14). Furthermore, IL-1α–stimulated bone resorption can be significantly suppressed by anti-RANKL polyclonal antibody (15). The mechanism for the inhibition of lytic bone destruction by Osx is not well understood. In this study, we showed that IL-1α expression was significantly suppressed in the presence of Osx. Using luciferase reporter and chromatin immunoprecipitation (ChIP) assays, we determined that Osx down-regulated IL-1α at the transcriptional level and that the Sp1-binding site spanning the region −1,532 to −1,056 on the IL-1α promoter was involved in this process. Finally, inhibiting Osx in two blastic osteosarcoma cell lines enhanced the IL-1α promoter activity, increased IL-1α protein production, and altered the tumor phenotype from blastic to lytic. These data indicate that the activity of Osx to reduce IL-1α expression is specifically mediated by the repression of IL-1α promoter.
Results
Osx Inhibited IL-1α Expression
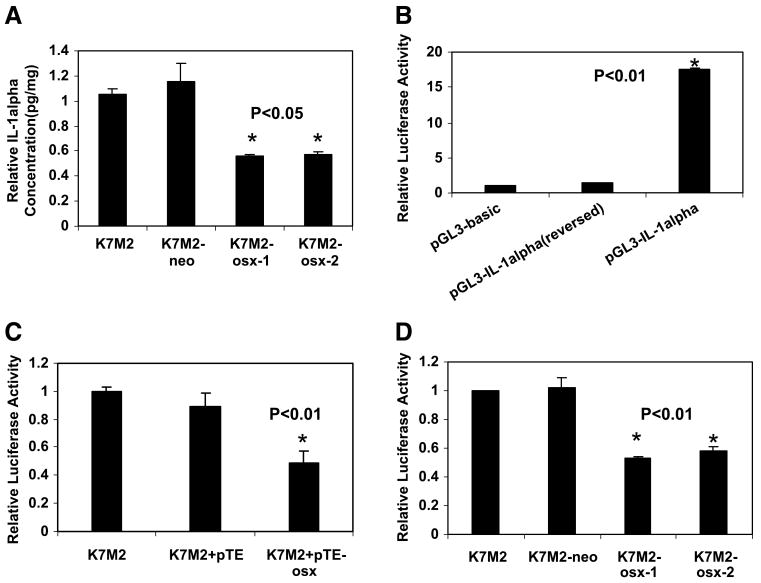
We previously showed that K7M2 cells induce osteolysis after intraosseous injection and have decreased Osx expression. K7M2 cells transfected with Osx (K7M2-osx-1 and K7M2-osx-2) formed smaller tumors with less tumor-induced osteolysis (5). Several cytokines and hormones have been reported to be involved in the bone remodeling process. Among these, IL-1α, IL-6, IL-11, and prostaglandin E2 were of particular interest because these cytokines have been observed to exert osteoclastogenic activity by inducing RANKL expression in osteoblasts (16, 17). IL-1α protein levels in K7M2-osx-1 (23 pg/mg total protein) and K7M2-osx-2 (24 pg/mg total protein) were significantly lower (P < 0.05) than in K7M2 (42 pg/mg total protein) and K7M2-neo cells (46 pg/mg total protein; Fig. 1A). By contrast, no change in IL-6, IL-11, or prostaglandin E2 was detected (data not shown). These data suggested that Osx down-regulated IL-1α expression in K7M2 mouse osteosarcoma cell lines.
FIGURE 1.
Effect of Osx on IL-1α protein production and IL-1α promoter activity. A. IL-1α protein levels in cell lysates were quantified by ELISA. The relative fold (pg/mg) was calculated as described in Materials and Methods. B. To determine the basal IL-1α promoter activity, K7M2 cells were transfected with the empty reporter (pGL3-basic), the IL-1α promoter reporter construct (pGL3-IL-1α), or the IL-1α promoter reporter vector in the reverse orientation [pGL3-IL-1α (reversed)]. Renilla luciferase construct was cotransfected for normalization. Luciferase activity was measured 24 h after transfection. Relative fold activity was calculated as the normalized pGL3-IL-1α or pGL3-IL-1α (reversed) activity divided by the normalized pGL3-basic value. C. K7M2 cells were cotransfected with IL-1α promoter reporter construct and either the expression plasmid for Osx (pTE-osx) or the control vector (pTE). Luciferase activity was measured 24 h after transfection. Relative fold activity was calculated as the normalized luciferase value divided by the normalized luciferase value in untreated K7M2 cells. D. IL-1α promoter reporter construct was transfected into K7M2, K7M2-neo, K7M2-osx-1, and K7M2-osx-2 cells. Luciferase activity was measured 24 h after transfection. Relative fold activity was calculated as described for C.
Effect of Osx on Transcription of IL-1α
Because Osx is a transcription factor (4), one potential mechanism for the down-regulation of IL-1α is through transcriptional repression. We have shown that IL-1α mRNA was significantly down-regulated in K7M2-osx-1 and K7M2-osx-2 cells compared with K7M2 cells and control cell line (data not shown). To determine if Osx caused transcriptional repression of IL-1α, a 2.0-kb section of the 5′ region flanking the IL-1α transcriptional initiation site was isolated from K7M2 genomic DNA and subcloned into the pGL3-basic luciferase reporter vector in both forward and reverse orientations relative to the luciferase gene. The basal activity of the pGL3-IL-1α was first determined by transient transfection into K7M2 cells. Luciferase activity was then quantified using Renilla luciferase to normalize for transfection efficiency. The pGL3-IL-1α construct showed a 17-fold increase in activity (P < 0.01) in K7M2 cells compared with the pGL3-basic activity (Fig. 1B). This suggested that the 2.0-kb region upstream of the IL-1α transcription initiation site contained a functional promoter. IL-1α promoter activity was orientation dependent because pGL3-IL-1α in the reverse orientation (reversed) was inactive.
To determine whether IL-1α promoter activity could be suppressed by Osx, the activity of pGL3-IL-1α was determined in K7M2 cells following transient cotransfection with the Osx-expressing vector. We also assessed IL-1α promoter activity following transfection into K7M2, K7M2-neo, K7M2-osx-1, and K7M2-osx-2 cells. Cotransfection of K7M2 cells with the Osx-expressing vector reduced pGL3-IL-1α activity 2-fold relative to that of K7M2 cells (P < 0.01) and 1.8-fold relative to cotransfection with a control vector (Fig. 1C). The pGL3-IL-1α activity was also reduced 2-fold in K7M2-osx-1 and K7M2-osx-2 cells (P < 0.01) compared with that of K7M2 and K7M2-neo cells (Fig. 1D). These data indicated that the reduction in IL-1α expression induced by Osx was transcriptionally mediated.
Effect of Osx Small Interfering RNA on IL-1α
We next examined the effect on IL-1α promoter activity of inhibiting Osx using the small interfering RNA (siRNA) technique. Dunn and DLM8 cells express high levels of endogenous Osx (Fig. 2A). Osx siRNA-expressing plasmid (Osx-si) was constructed using the pSilencer2.1-U6 hygro vector to target one region of mouse Osx mRNA. Dunn and DLM8 mouse osteosarcoma cells were stably transfected with the plasmid (Dunn-si-2 and DLM8-si-1), and the Osx protein was quantified by Western blotting. As shown in Fig. 2B, Osx expression in the Osx-si–transfected Dunn-si-2–and DLM8-si-1–cloned cells was significantly lower than in parental and control vector–transfected cells (Dunn-si-c and DLM8-si-c).
FIGURE 2.
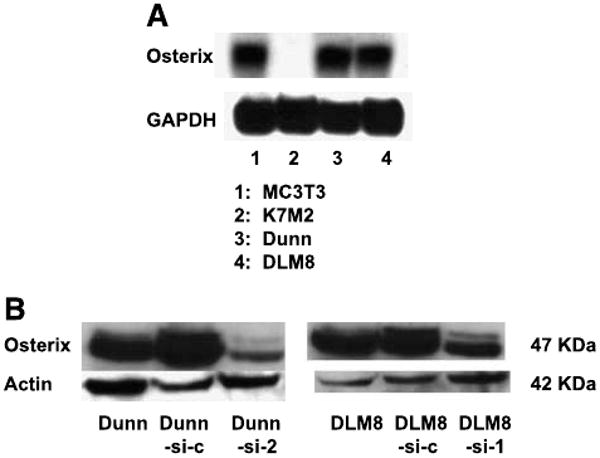
Suppression of Osx by specific siRNA. A. Total RNA was extracted from Dunn and DLM8 cells. Osx expression was quantified by Northern blot. Glyceraldehyde-3-phosphate dehydrogenase (GAPDH) was used as loading control. MC3T3 and K7M2 cells were used as positive and negative control cells, respectively. B. Total protein was extracted from Dunn and DLM8 parental cells, from Dunn-si-c and DLM8-si-c control vector – transfected cells, and from Dunn-si-2 and DLM8-si-1 Osx siRNA – transfected cells. Osx protein was quantified by Western blot.
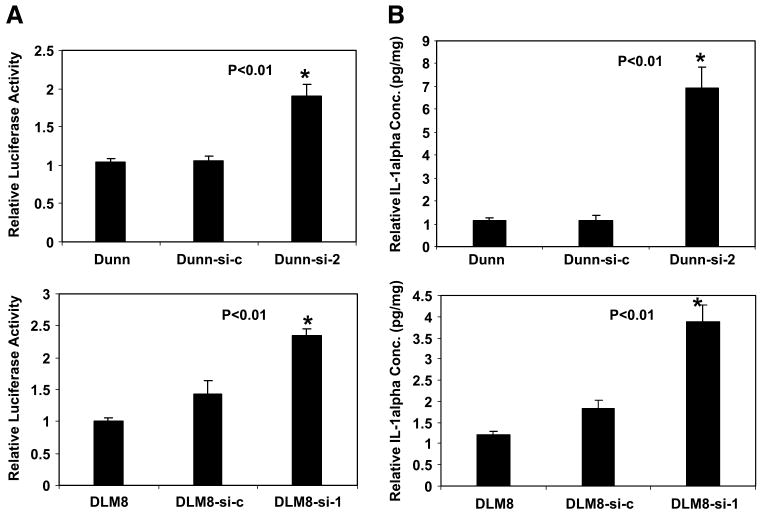
Because we showed that Osx transcriptionally down-regulates IL-1α (Fig. 1C and D), reducing Osx by siRNA should lead to up-regulation of IL-1α. To determine this, we quantified the activity of pGL3-IL-1α following transient transfection into Dunn, Dunn-si-c, and Dunn-si-2 cells. The IL-1α promoter activity in Dunn-si-2 was 1.9-fold higher (P < 0.01) than in parental and control vector–transfected cells (Fig. 3A). Similarly, the promoter activity in DLM8-si-1 was 2.3-fold higher (P < 0.01) than in DLM8 cells and 1.6-fold higher (P < 0.01) than in DLM8-si-c cells (Fig. 3A). IL-1α protein production was also quantified following Osx siRNA transfection (Fig. 3B). Levels of IL-1α protein in Dunn and DLM8 cells were 5 and 7 pg/mg total protein, respectively. This is lower than observed in the K7M2 cells (42 pg/mg total protein). Suppression of Osx led to an increase in IL-1α protein production. In Dunn-si-2 cells, IL-1α protein production was 5.3-fold higher (P < 0.01) than in Dunn and Dunn-si-c cells. DLM8-si-1 cells also produced significantly higher IL-1α protein levels (P < 0.01) compared with those of the parental and control vector–transfected cells. Together, these data suggested that Osx inhibits IL-1α expression and protein production by transcriptional regulation.
FIGURE 3.
IL-1α promoter activity is enhanced and IL-1α protein expression is increased following suppression of Osx. A. The IL-1α promoter reporter construct was transfected into different cells as indicated. Luciferase activity was measured 24 h later. Relative fold activity was calculated as the normalized luciferase value divided by the normalized luciferase value in Dunn or DLM8 cells. B. IL-1α protein in Dunn, Dunn-si-c, Dunn-si-2, DLM8, DLM8-si-c, and DLM8-si-1 cell lysate was quantified by ELISA. Relative fold was calculated as the normalized protein concentration divided by the normalized protein concentration in Dunn or DLM8 cells.
Transcriptional Regulation of IL-1α by Osx Is Mediated through Sp1-Binding Sites on the IL-1α Promoter
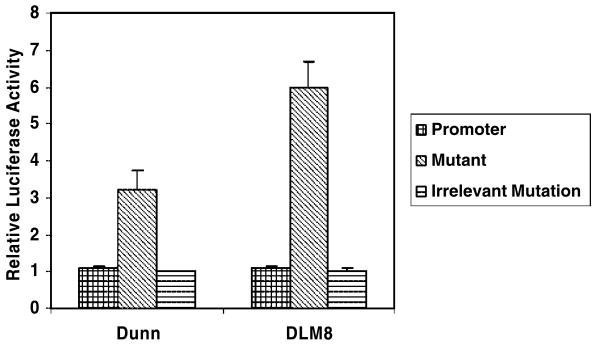
Because Osx belongs to the same family as Sp1 (4), we investigated whether Osx down-regulated IL-1α expression through the Sp1-binding site on the IL-1α promoter (18). A site-directed mutagenesis reporter construct mutated at the Sp1-binding site was generated. If Osx regulation is via the Sp1-binding site, then mutating that site should prevent the transcriptional repression of IL-1α by Osx. We used Dunn and DLM8 cells because of their high Osx expression. When the mutant promoter reporter was transfected into Dunn or DLM8 cells, IL-1α transcription was increased (Fig. 4). When another promoter construct with a mutation at an irrelevant site on the IL-1α promoter was used as a negative control, we found its activity comparable with that of the wild-type promoter. After transfection into K7M2 cells (cells with no Osx), the activity of the mutant promoter was the same as that of the wild-type promoter (data not shown). These results suggested that Osx may down-regulate IL-1α through the Sp1-binding site on the IL-1α promoter.
FIGURE 4.
Mutating one Sp1-binding site on IL-1α promoter increased its activity. IL-1α promoter activity was increased after mutating the Sp1-binding site on the IL-1α promoter in Dunn and DLM8 cells. Wild-type, mutant, or irrelevant mutant promoter reporters were transfected into Dunn and DLM8 cells as indicated. After 24 h, luciferase activity was measured. Relative fold activity was calculated as the normalized luciferase value divided by the normalized luciferase value of wild-type promoter reporter.
Our functional studies with luciferase reporter constructs suggested that Osx can transcriptionally repress IL-1α gene expression. To further confirm that Osx binds to the IL-1α promoter, we did the ChIP assay to determine the intracellular occupancy of the IL-1α gene by Osx (Fig. 5). We selectively amplified different regions of the proximal and basal promoter regions of the IL-1α gene after reversibly cross-linking the chromatin with Osx. To validate the accuracy of our approach, primers were designed to amplify a distal region of the IL-1α gene that does not contain any regulatory elements. The acetylated histone H3 antibody was used as a positive control (Fig. 5). Our results showed that Osx clearly occupies the IL-1α promoter in Dunn and DLM8 cells, consistent with our results using the luciferase reporter assays. Please note that only −1,532 to −1,056 fragment and the −272 to −13 region show binding to the Osx antibody. Osx did not bind to the −2,516 to −2,209 or the +10,099 to +10,459 regions. Based on the site-directed mutagenesis, Osx should only bind to the −1,532 to −1,056 region. Binding to the −272 to −13 region may be due to the fact that the chromatin has DNA strands that are as long as 2 kb. Therefore, we may still get the PCR product for the −272 to −13 region, although Osx is bound to the −1,532 to −1,056 region. Contrarily, it is equally possible that Osx also binds to the −272 to −13 region of the IL-1α promoter to potentiate its transcriptional repression. However, because this region was not used for site-directed mutagenesis studies, it is difficult to infer if it does so through direct or indirect interactions.
FIGURE 5.
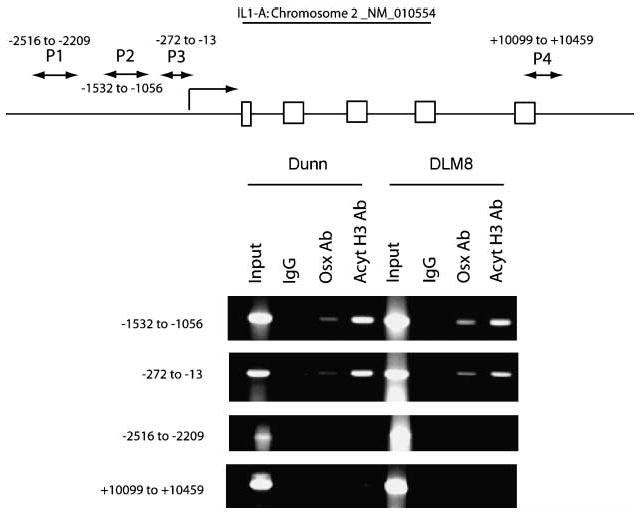
Osx inhibits IL-1α promoter activity through one Sp1-binding site on IL-1α promoter. Intracellular occupancy of Osx on the IL-1α promoter in Dunn and DLM8 cells. Top, primers used to amplify the putative regulatory and non-regulatory regions present in the IL-1α gene. P1, P2, P3, and P4, four pairs of primers used in the ChIP assay. Arrowheads, boundaries of the PCR products. Formaldehyde cross-linked chromatin samples (1 mg) from mouse osteosarcoma cell lines Dunn or DLM8 were subjected to immunoprecipitation with either affinity-purified Osx antibody or acetylated histone H3 antibody and subjected to PCR amplification with primer pair P1, P2, P3, and P4. Normal rabbit IgG (1 μg) was used as control for each ChIP. Input represents 0.2% of each soluble chromatin fraction used for immunoprecipitation.
Effects of Osx on Transcription of Osteoprotegerin
Osteoprotegerin (OPG) is a decoy receptor of RANKL that inhibits osteoclast recruitment. We hypothesized therefore that the inhibition of osteolysis by Osx may be through the transcriptional up-regulation of OPG. However, using the luciferase reporter assay, we were unable to detect increased OPG promoter activity following Osx transfection (data not shown). Furthermore, the luciferase activities of serial 5′ deletion mutant constructs did not change in the presence or absence of Osx (data not shown). Taken together, these data indicated that Osx does not transcriptionally up-regulate OPG.
Inhibition of Osx Expression Alters the Phenotype of Dunn and DLM8 Tumors
Osx expression is absent or low in tumors that form lytic as opposed to blastic bone lesions (5). Dunn and DLM8 tumors are blastic (Fig. 6) and both cell lines express high levels of Osx (Fig. 2A). To determine whether inhibiting Osx leads to a change in tumor phenotype, parental, control vector–transfected, and Osx siRNA–transfected Dunn and DLM8 cells were injected intratibially. Leg tumors were examined by radiograph 35 days later. Osteoblastic lesions developed in mice injected with Dunn and DLM8 cells. Mice injected with Dunn-si-c and DLM8-si-c vector-transfected control cells had a similar phenotype (Fig. 6; Table 1). By contrast, tumors in mice injected with Osx siRNA–transfected Dunn or DLM8 cells were osteolytic (Fig. 6; Table 1).
FIGURE 6.
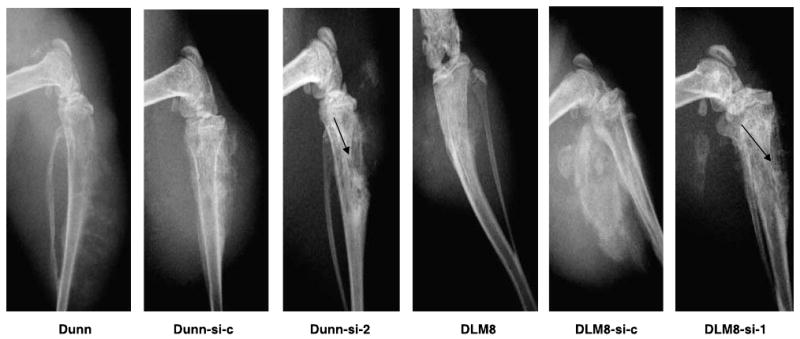
Osx expression correlates inversely with lytic phenotype. Nude mice received an intratibial injection of Dunn, Dunn-si-c, Dunn-si-2, DLM8, DLM8-si-c, or DLM8-si-1 cells. The mice were sacrificed 35 d after tumor cell injection. Representative radiographs of the tumor lesions are shown.
Table 1. Inhibition of Osx Expression Alters Tumor Phenotype.
| Study Group* | Blastic Lesion Incidence (%) | Mixed Lesion Incidence (%) | Lytic Lesion Incidence (%) | Bone Lysis |
|---|---|---|---|---|
| Dunn | 8/8 | 0/8 | 0/8 | 0 |
| Dunn-si-c | 6/7 | 1/7 | 0/7 | 0.07 |
| Dunn-si-2 | 2/8 | 1/8 | 5/8 | 1.1† |
| DLM8 | 6/8 | 2/8 | 0/8 | 0.13 |
| DLM8-si-c | 8/9 | 0/9 | 1/9 | 0.11 |
| DLM8-si-1 | 1/7 | 3/7 | 3/7 | 0.64‡ |
Dunn, Dunn-si-c, Dunn-si-2, DLM8, DLM8-si-c, and DLM8-si-1 cells were injected into the left tibia of nude mice. The mice (10 per group) were sacrificed 35 d after tumor cell injection. Blastic and lytic phenotypes were determined as described in Materials and Methods.
P < 0.01, compared with control groups.
P < 0.05, compared with control groups.
Discussion
In this study, we showed that Osx down-regulates IL-1α expression in osteosarcoma through repression of the IL-1α promoter. This down-regulation was specific as Osx had no effect on the transcription of OPG or the expression of IL-6, IL-11, and prostaglandin E2. Although Osx is an essential gene for osteoblast differentiation, its role in bone tumors is poorly understood. We showed in previous studies that bone tumors induced after intratibial injection of K7M2 osteosarcoma cells were osteolytic. Osx expression was absent in these cells. The reexpression of Osx by stable gene transfection altered the osteolytic phenotype (5). However, the mechanism of reduced osteolysis following Osx gene transfection was unclear and did not involve the suppression of RANKL by Osx (5). Cytokines, such as IL-1α, IL-6, IL-11, and prostaglandin E2, have been shown to participate in the bone remodeling processes by inducing RANKL and osteoclast formation. Therefore, changes in the levels of these cytokines could affect bone lysis. Here, we showed for the first time that expression and production of IL-1α, a cytokine that stimulates osteoclastogenesis through the production of RANKL by marrow stromal cells and osteoblasts (13, 14), was down-regulated at the transcriptional level by Osx. The secretion of IL-1α by tumor cells will have an effect on the expression of RANKL on the stromal cells and osteoblasts. This increased RANKL on stromal cells and osteoblasts increases osteoclast activity. In our previous report, we showed that reexpression of Osx in K7M2 cells had no effect on the RANKL expression in tumor cells.
Our data also showed that the effect of Osx on IL-1α expression was not restricted to one osteosarcoma cell line. The suppression of Osx expression by siRNA in two other osteosarcoma cell lines, Dunn and DLM8, resulted in the up-regulation of both IL-1α promoter activity and IL-1α protein expression. The osteoblastic phenotype of these two cell lines was also altered to a lytic phenotype following Osx suppression. The possible autocrine effect of IL-1α on tumor cell lines has been ruled out because K7M2, Dunn, and DLM8 do not express IL-1α receptors (data not shown). To determine whether Osx acts through the Sp1-binding site on the IL-1α promoter, we used a site-directed mutagenesis reporter vector to show that Osx was unable to repress the IL-1α promoter activity in osteosarcoma cells after mutating the Sp1-binding site. These data indicate that this Sp1-binding site is important for Osx-mediated repression of the IL-1α promoter. The ChIP assay was used to confirm the occupancy of the IL-1α promoter by Osx. These data suggest that Osx represses the activity of IL-1α promoter via binding to the −1,532 to −1,056 and −272 to −13 regions of IL-1α promoter. Our present studies are consistent with the fact that Osx belongs to the Sp1 family (4).
In summary, this study is the first to link Osx, a gene involved in bone differentiation, with the repression of the IL-1α promoter. IL-1α participates in bone remodeling, and therefore, alteration in the production of IL-1α by tumor cells may in turn affect the phenotype of the tumor cells when they metastasize to the bone. Indeed, we have shown that the lytic phenotype of prostate, breast, and renal cell carcinoma cells inversely correlated with the expression of Osx (19). Other cytokines and proteins may also contribute to the lytic activity of tumor cells. It is not our contention that IL-1α is the only cytokine involved. However, the data presented here indicate a strong correlation between the presence or absence of Osx, the production of IL-1α by tumor cells, and tumor-induced bone lysis. Our findings support the premise that Osx has potential as a therapeutic target for decreasing tumor-induced bone destruction and pathologic bone fractures. We hypothesize that Osx-induced repression of IL-1α expression in osteosarcoma changed the microenvironment, decreasing osteoclastogenesis resulting in the change in bone phenotype. Further studies will focus on identifying the critical pathways involved in the regulation of osteoclastogenesis by Osx.
Materials and Methods
Cell Lines and Mouse Model
Mouse osteosarcoma cell lines K7M2 and its stable clones K7M2-osx-1 and K7M2-osx-2 (5) and the MC3T3 normal mouse osteoblast were maintained in DMEM supplemented with 10% fetal bovine serum. The clonally related mouse osteosarcoma cells Dunn and DLM8 (20) were also maintained in DMEM with 10% fetal bovine serum.
Male, 4-week-old, specific pathogen-free BALB/c mice were purchased from Charles River Breeding Laboratories. The mice were maintained in an animal facility approved by the American Association of Laboratory Animal Care in accordance with the current regulations and standards of the U.S. Department of Agriculture, the Department of Health and Human Services, and the NIH. The mice were housed five per cage and kept in a laminar flow cabinet under specific pathogen-free conditions for 2 weeks before being used for any experiments.
IL-1α ELISA
Cells were cultured in 10-cm Petri dishes, and cell lysate was collected and protein concentrations were determined using the Bio-Rad protein assay kit (Bio-Rad Laboratories). IL-1α protein concentration was quantified using an anti-mouse IL-1α ELISA kit (Endogen) according to the manufacturer's protocol. The IL-1α concentration was then normalized by the cell protein concentration.
Generation of IL-1α Promoter Constructs
DNA from K7M2 cells was prepared with a Qiagen genomic tip system according to the manufacturer's instructions. The 2.0-kb genomic fragment upstream of the transcription initiation site was generated by PCR from genomic DNA using the Expand High Fidelity PCR System (sense, 5′-CACATCAGGCCCAGTAAAGC-3′; antisense, 5′-TAAGTCTGAGTCAGGCTTCTC-3′; Roche Applied Sciences). The PCR product was then subcloned into the pCR2.1 expression vector (Invitrogen) in either orientation and digested with BamHI and XhoI. The digests were inserted into the promoterless pGL3-basic vector (Promega) and the constructs were confirmed by sequence analysis.
Transient Transfection and Luciferase Reporter Assay
The cells were grown in six-well plates to 60% confluence for 24 h and then transiently transfected using FuGene 6 (Roche Applied Sciences) with 1.0 μg of a firefly luciferase reporter gene and 50 ng of the Renilla luciferase reporter gene driven by the β-actin promoter (Promega). Cotransfection was done by adding 1 μg of Osx-expressing construct pTriEx-1.1-Osx or the control construct pTriEx-1.1 (Novagen, EMD Biosciences, Inc.) to the DNA solutions. Luciferase activity was determined using the dual-luciferase reporter assay system (Promega) in a monolight 3010 luminometer (BD Biosciences) according to the manufacturer's instructions. Normalization of transfection efficiency was based on cotransfected β-actin Renilla luciferase activities.
siRNA Construct and Cell Transfection
siRNA expression vector pSilencer2.1-U6 hygro was purchased from Ambion and siRNA-expressing plasmid targeting mouse Osx was constructed according to the manufacturer's instructions. Briefly, one pair of cDNA oligonucleotides targeting mouse Osx mRNA (sequence GTTATGATGACGGGTCAGG) was synthesized by Integrated DNA Technologies. The pair of oligonucleotides was annealed at 90°C for 3 min, cooled to 37°C, and incubated for 1 h. Annealed dsDNA oligonucleotide was ligated between BamHI and HindIII sites on the pSilencer2.1-U6 hygro vector. Control vector was constructed by inserting a sequence that expresses a siRNA with limited homology to sequences in human and mouse genomes. The inserted sequence was verified by DNA sequencing. Transfection was done with FuGene 6 and selected in hygromycin B–containing (Invitrogen) medium at 1,000 μg/mL for Dunn and DLM8 cells. Stable transfected cell clones were tested for Osx expression by Western blot analysis.
Northern Blot Analysis
Total RNA was isolated from cells using a Trizol RNA isolation kit. Total RNA (20 μg) was separated by electrophoresis under denaturing conditions and then transferred to a Hybond N+ membrane. Mouse and human Osx cDNAs (4) were labeled with 32P using the Rediprime DNA labeling system (Amersham Biosciences). After prehybridization with 10 mL Rapidhyb buffer (Amersham Biosciences) at 65°C for 2 h, hybridization was done overnight. The blot was subsequently washed in 2% (v/v) SSC and 0.1% (w/v) SDS at room temperature for 20 min and then in 0.5% SSC and 0.1% SDS at 65 °C for 20 min.
Western Blot Analysis
Cells were plated into a 10-cm Petri dish. When cells reached 80% confluence, cell lysate was collected and protein concentrations were determined using the Bio-Rad protein assay kit. The protein (50 μg) was boiled for 5 min before being loaded onto a 12% SDS-polyacrylamide gel and then transferred to a nitrocellulose membrane (Amersham Biosciences). Specific protein bands were detected with polyclonal anti-mouse Osx antibody (obtained from Dr. B. de Crombrugghe's laboratory) and monoclonal β-actin antibody (Sigma Chemical Co.) using the chemiluminescence Western blotting analysis system (Amersham Biosciences) according to the manufacturer's instructions.
Site-Directed Mutagenesis
Mutagenesis was done with the QuikChange Site-Directed Mutagenesis kit (Stratagene) in accordance with the manufacturer's instructions. The following oligonucleotides (single-stranded sense and antisense) were used as primers to introduce mutation within the Sp1-binding elements between −1,325 and −1,291 bp of the IL-1α promoter (normal nucleotides are ACCCACCC and mutated nucleotides are underlined; ref. 18): sense, 5′-GATGTTTAGAGACGGCGCGCCGAGCTTTGGCTCC-3′; antisense, 5′-GGAGCCAAAGCTCGGCGCGCCGTCTCTAAACATC-3′. Irrelevant mutagenesis was used as negative control. The oligonucleotides were used as primers to introduce the mutation between −1,730 and −1,701 bp of the IL-1α promoter (mutated nucleotides are underlined): sense, 5′-AAGGGTGCTTTCCCGGCGCGCCAAAGAGG-3′; anti-sense, 5′-CCTCTTTGGCGCGCCGGGAAAGCACCCTT-3′. PCR analyses were done with the wild-type pGL3-IL-1α reporter vector as template. The newly synthesized PCR products were digested with DpnI and used for transformation. The presence of mutations was verified by sequencing.
ChIP Assay
Formaldehyde Cross-Linking
Cells (107) grown in 150-mm dishes were fixed with 1/10 volume of cross-linking solution [11% formaldehyde/0.1 mol/L NaCl/1 mmol/L Na-EDTA/ 0.5 mmol/L Na-EGTA/50 mmol/L HEPES (pH 8.0)]. After 10-min incubation at 37°C, 1/20 volume of a 2.5 mol/L glycine solution was added to each plate to stop the cross-linking reaction. The cells were scraped and harvested by centrifugation at 2,000 × g for 10 min at 4°C. The cell pellets were resuspended in cold PBS (137 mmol/L NaCl/2.7 mmol/L KCl/ 10 mmol/L Na2HPO4/2 mmol/L KH2PO4) and washed twice. The final cell pellet was snap frozen in liquid nitrogen.
Extraction of Chromatin
The frozen cell pellet from an Eppendorf was resuspended in 1 mL of lysis buffer 1 [0.05 mol/L HEPES-KOH (pH 7.5), 0.14 mol/L NaCl, 1 μmol/L EDTA, 10% glycerol, 0.5% NP40, 0.25% Triton X-100, with protease inhibitor cocktail from Roche Applied Sciences] with a pipette and mixed for 10 min at 4°C on a rocking platform. After centrifugation at 2,000 × g for 10 min at 4°C, the cell pellet was resuspended in 0.8 mL of lysis buffer 2 [0.2 mol/L NaCl, 1 μmol/L EDTA, 0.5 μmol/L EGTA, 10 μmol/L Tris (pH 8), protease inhibitor cocktail] with a pipette and mixed gently at room temperature for 10 min on a rocking platform. After centrifugation again at 2,000 × g for 10 min at 4°C, the pellet is resuspended in 0.5 mL of lysis buffer 3 [1 μmol/L EDTA, 0.5 μmol/L EGTA, 10 μmol/L Tris-HCl (pH 8), protease inhibitor cocktail].
Fragmentation of Chromatin
An ultrasonic sonicator (Branson Sonifier 450, with power setting at 5; Branson Ultrasonics Corp.) was used to break down the cell and nucleus membranes and fragment the chromatin. The sonication was repeated until the chromatin fragments were of desired length (600 bp to 2 kb). At this stage, crude DNA concentration of the chromatin solution was checked and adjusted to 0.5% Sarkosyl (sodium lauryl sarcosine) and gently mixed for 10 min at room temperature on a rocking platform. The chromatin solution was then transferred to a centrifuge tube and spun for 10 min at 10,000 × g to remove cell debris. Chromatin solution (1-2 mg/mL) was used for each chromatin immunoprecipitation.
Chromatin aliquots were precleared with 70 μL of a 25% (v/v) suspension of 2 μg of ssDNA-coated protein A and 1 mg/mL bovine serum albumin. Samples were used directly for immunoprecipitation reactions with 3 μL of affinity-purified Osx antibody or 1 μg of total acetylated H3 antibody (Upstate Biotechnology, Inc.) and normal rabbit IgG as a control. ChIP reactions were allowed to proceed for 2 to 4 h at 4°C on a rotating wheel. Immunocomplexes were mixed with 100 μL of a 25% (v/v) precoated protein A agarose suspension followed by incubation for 1 h at 4°C on a rotating wheel. Beads were washed thrice with low-salt, high-salt, and lithium salt buffers followed by two washes with radioimmunoprecipitation assay buffer containing 1% NP40. After a final wash with Tris-EDTA buffer, the beads were collected by brief centrifugation and the immunocomplexes were eluted twice by adding 150 μL of a freshly prepared solution of 1% SDS-0.1 mol/L NaHCO3. The samples were adjusted to 0.2 mol/L NaCl, and protein-DNA cross-linking was reversed by incubating at 68°C overnight. The samples were treated with 100 μg/mL proteinase K followed by phenol-chloroform extraction and ethanol precipitation using 5 μg glycogen as carrier. An aliquot (2-5 μL) of each sample was assayed for PCR to detect the presence of specific DNA fragments using appropriate oligos from the proximal IL-1α promoter or the distal region as indicated in (Fig. 5).
The primers used were as follows: primer pair P1, 5′-GCGCACGCCTTTAATCCCAGCACTTG-3′ (sense) and 5′-TCTCTACTTCCCTTCATTCCCTCCATCTCATCCTTC-3′ (antisense); primer pair P2, 5′-GAGGCCATCATTAGTGTCATTATTTTTGTTTAGC-3′ (sense) and 5′-CAGAAGCGGTGGGGCGAGAGG-3′ (antisense); primer pair P3, 5′-GCTTCCTGCCGCTCTTCCCGTTTTGTA-3′ (sense) and 5′-GCTTCTCTGCCTTTTTATAGTCTTCCTCA-3′ (antisense); and primer pair P4, 5′-CAGTCTTTCTCCCTCCCGTCCTTA-3′ (sense) and 5′-AAACCCCTTCACTGCATCACAACA-3′ (antisense). PCR conditions for P1, P2, and P3 were 25 cycles of 95°C for 60 s, 94°C for 50 s, 55°C for 40 s, and 72°C for 90 s and then 72°C for 10 min. For P4, the annealing temperature was 52°C for 40 s. All other steps were identical to P1, P2, and P3. P3 was amplified by GC-Rich PCR System (Roche Applied Sciences).
Generation of OPG Promoter Constructs
DNA from K7M2 cells was prepared with a Qiagen genomic tip system according to the manufacturer's instructions. The 1.87-kb genomic fragment spanning 1,842 bp of the 5′ region flanking the OPG transcriptional initiation sites and downstream 33 bp was generated from genomic DNA by PCR using the Expand High Fidelity PCR System (sense, 5′-GGTACCACTTGCTGTCTCCTTCTAC-3′; antisense, 5′-GGTACCAGCCCAGGCAATCATGAC-3′). The PCR product has introduced a KpnI enzymatic site. The PCR product was then subcloned into the pCR2.1 expression vector (Invitrogen) and digested with KpnI. The digests were inserted into the promoterless pGL3-basic vector, and the promoter construct pGL3-OPG was confirmed by sequence analysis. Serial 5′ deletion mutants were generated by digesting pGL3-OPG by SamI and BlnI, SmaI and SpeI, SamI and ApaI, and SmaI and BlpI. The digests were then self-ligated. All constructs were confirmed by sequence analysis.
In vivo Studies
Single-cell suspensions (1 × 10⁵) of different tumor cells in HBSS (4°C) were injected into the left tibia of the animals. Briefly, mice were anesthetized with Nembutal anesthetic mix, and a 30G1/2 needle was inserted into the proximal end of the left tibia followed by injection of 10 μL of cell suspension. Animals were sacrificed 35 days after tumor inoculation; then, the tumor-bearing limbs were resected. Magnified flat radiographs were taken with a MX-20 Specimen Radiograph System (Faxitron X-Ray Co.). The grading scheme for quantification of bone lysis has been described (21). The destruction is graded from 0 to 4+ with increasing degrees of bone lysis. A grade of 0 represents no lysis, 1+ is minimal but visible bone lysis within the medullary canal, 2+ is moderate bone lysis in the medullary canal with preservation of the cortex, 3+ is severe bone lysis with cortical disruption, and 4+ is massive destruction with soft tissue extension of the tumor (21).
Statistics
After doing a one-way ANOVA to compare the means, comparisons among groups were made using the two-tailed, unpaired Student's t test. A difference was considered significant at P < 0.05.
Acknowledgments
We thank Dr. Hui Guan for her expert technical support on the siRNA experiments.
Grant support: NIH grant CA42992, core grant CA16672, and Reliant Energy Corp.
References
- 1.Ragland BD, Bell WC, Lopez RR, et al. Cytogenetics and molecular biology of osteosarcoma. Lab Invest. 2002;82:365–73. doi: 10.1038/labinvest.3780431. [DOI] [PubMed] [Google Scholar]
- 2.Dorfman HD, Czerniak B. Bone cancers. Cancer. 1995;75:203–10. doi: 10.1002/1097-0142(19950101)75:1+<203::aid-cncr2820751308>3.0.co;2-v. [DOI] [PubMed] [Google Scholar]
- 3.Bathurst N, Sanerkin N, Watt I. Osteoclast-rich osteosarcoma. Br J Radiol. 1986;59:667–73. doi: 10.1259/0007-1285-59-703-667. [DOI] [PubMed] [Google Scholar]
- 4.Nakashima K, Zhou X, Kunkel G, et al. The novel zinc finger-containing transcription factor osterix is required for osteoblast differentiation and bone formation. Cell. 2002;108:17–29. doi: 10.1016/s0092-8674(01)00622-5. [DOI] [PubMed] [Google Scholar]
- 5.Cao Y, Zhou Z, de Crombrugghe B, et al. Osterix, a transcription factor for osteoblast differentiation, mediates antitumor activity in murine osteosarcoma. Cancer Res. 2005;65:1124–8. doi: 10.1158/0008-5472.CAN-04-2128. [DOI] [PubMed] [Google Scholar]
- 6.Lacey DL, Timms E, Tan HL, et al. Osteoprotegerin ligand is a cytokine that regulates osteoclast differentiation and activation. Cell. 1998;93:165–76. doi: 10.1016/s0092-8674(00)81569-x. [DOI] [PubMed] [Google Scholar]
- 7.Anderson DM, Maraskovsky E, Billingsley WL, et al. A homologue of the TNF receptor and its ligand enhance T-cell growth and dendritic-cell function. Nature. 1997;390:175–9. doi: 10.1038/36593. [DOI] [PubMed] [Google Scholar]
- 8.Hsu H, Lacey DL, Dunstan CR, et al. Tumor necrosis factor receptor family member RANK mediates osteoclast differentiation and activation induced by osteoprotegerin ligand. Proc Natl Acad Sci U S A. 1999;96:3540–5. doi: 10.1073/pnas.96.7.3540. [DOI] [PMC free article] [PubMed] [Google Scholar]
- 9.Nakagawa N, Kinosaki M, Yamaguchi K, et al. RANK is the essential signaling receptor for osteoclast differentiation factor in osteoclastogenesis. Biochem Biophys Res Commun. 1998;253:395–400. doi: 10.1006/bbrc.1998.9788. [DOI] [PubMed] [Google Scholar]
- 10.Myers DE, Collier FM, Minkin C, et al. Expression of functional RANK on mature rat and human osteoclasts. FEBS Lett. 1999;463:295–300. doi: 10.1016/s0014-5793(99)01650-6. [DOI] [PubMed] [Google Scholar]
- 11.Green EA, Flavell RA. TRANCE-RANK, a new signal pathway involved in lymphocyte development and T cell activation. J Exp Med. 1999;189:1017–20. doi: 10.1084/jem.189.7.1017. [DOI] [PMC free article] [PubMed] [Google Scholar]
- 12.Ross FR. RANKing the importance of measles virus in Paget's disease. J Clin Invest. 2000;105:555–8. doi: 10.1172/JCI9557. [DOI] [PMC free article] [PubMed] [Google Scholar]
- 13.Jilka RL. Cytokines, bone remodeling, and estrogen deficiency: a 1998 update. Bone. 1998;23:75–81. doi: 10.1016/s8756-3282(98)00077-5. [DOI] [PubMed] [Google Scholar]
- 14.Pacifici R. Aging and cytokine production. Calcif Tissue Int. 1999;65:345–51. doi: 10.1007/s002239900710. [DOI] [PubMed] [Google Scholar]
- 15.Tsukii K, Shima N, Mochizuki S, et al. Osteoclast differentiation factor mediates an essential signal for bone resorption induced by 1α,25-dihydroxyvitamin D3, prostaglandin E2, or parathyroid hormone in the microenvironment of bone. Biochem Biophys Res Commun. 1998;246:337–41. doi: 10.1006/bbrc.1998.8610. [DOI] [PubMed] [Google Scholar]
- 16.Yasuda H, Shima N, Nakagawa N, et al. Identity of osteoclastogenesis inhibitory factor (OCIF) and osteoprotegerin (OPG): a mechanism by which OPG/ OCIF inhibits osteoclastogenesis in vitro. Endocrinology. 1998;139:1329–37. doi: 10.1210/endo.139.3.5837. [DOI] [PubMed] [Google Scholar]
- 17.Dinarello AC. The interleukin-1 family: 10 years of discovery. FASEB J. 1994;8:1314–25. [PubMed] [Google Scholar]
- 18.Huang TT, Vinci JM, Lan L, et al. Serotonin-inducible transcription of interleukin-1α in uterine smooth muscle cells requires an AP-1 site: cloning and partial characterization of the rat IL-1α promoter. Mol Cell Endocrinol. 1999;152:21–35. doi: 10.1016/s0303-7207(99)00067-2. [DOI] [PubMed] [Google Scholar]
- 19.Cao Y. Osterix inhibits bone destruction in osteosarcoma through transcriptional repression of interleukin-1α expression [dissertation] Houston (TX): The University of Texas Health Science Center at Houston, Graduate School of Biomedical Sciences; 2006. [Google Scholar]
- 20.Asai T, Ueda T, Itoh K, et al. Establishment and characterization of a murine osteosarcoma cell line (LM8) with high metastatic potential to the lung. Int J Cancer. 1998;76:418–22. doi: 10.1002/(sici)1097-0215(19980504)76:3<418::aid-ijc21>3.0.co;2-5. [DOI] [PubMed] [Google Scholar]
- 21.Weber KL, Doucet M, Price JE, et al. Blockade of epidermal growth factor receptor signaling leads to inhibition of renal cell carcinoma growth in the bone of nude mouse. Cancer Res. 2003;63:2940–7. [PubMed] [Google Scholar]


