Abstract
We present an analysis of the results of in situ surface-enhanced Raman scattering (SERS) of bacteria using a microfluidic chip capable of continuously sorting and concentrating bacteria via three-dimensional dielectrophoresis (DEP). Microchannels were made by sandwiching DEP microelectrodes between two glass slides. Avoiding the use of a metal nanoparticle suspension, a roughened metal surface is integrated into the DEP-based microfluidic chip for on-chip SERS detection of bacteria. On the upper surface of the slide, a roughened metal shelter was settled in front of the DEP concentrator to enhance Raman scattering. Similarly, an electrode-patterned bottom layer fabricated on a thin cover-slip was used to reduce fluorescence noise from the glass substrate. Gram positive (Staphylococcus aureus) and Gram negative (Pseudomonas aeruginosa) bacteria were effectively distinguished in the SERS spectral data. Staphylococcus aureus (concentration of 106 CFU∕ml) was continuously separated and concentrated via DEP out of a sample of blood cells. At a flow rate of 1 μl∕min, the bacteria were highly concentrated at the roughened surface and ready for on-chip SERS analysis within 3 min. The SERS data were successfully amplified by one order of magnitude and analyzed within a few minutes, resulting in the detection of signature peaks of the respective bacteria.
INTRODUCTION
Pathogen and microorganism detection in food, clinical, and environmental samples is becoming increasingly important. The time-consuming (days to weeks), traditional procedure of selectively culturing bacteria from the isolates followed by Gram coloring for cell determination is still the gold standard for bacterial identification. Over the past decade, polymerase chain reaction (PCR)-based methods, such as DNA microarrays and DNA hybridization, to identify bacteria species and strains have become popular.1 A new method utilizes antibody-functionalized immune-colloids to trap and detect specific bacteria owing to bacteria-antibody docking.2 However, both PCR-based methods (reporter labeling, cell lysis, and DNA extraction) and new immunoassay methods require several complicated and time-consuming steps to achieve detection and identification of microorganisms within several hours. An integrated microfluidic chip that could rapidly perform these processing steps would thus be a major breakthrough in technology due to short diffusion length, low sample volume, and high surface∕volume ratio, and enables automatic control.
Dielectrophoresis (DEP) has been widely used for biotechnology applications in microscale environments. DEP offers a number of potential advantages over conventional methods for isolating, separating, focusing, and concentrating bioparticles under nonuniform electric fields.3, 4, 5, 6, 7, 8 The dielectrophoretic force is defined by
| (1) |
where r is the particle radius, εm is the permittivity of the surrounding medium, E is the applied electric field, and Re[fCM] is the real part of Clausius–Mossotti (CM) factor which can be expressed by
| (2) |
and indicate the complex permittivity of the particle and the surrounding medium, respectively. The effect of the complex permittivity of medium can be controlled by changing the conductivity of medium (σm) and frequency (ω) of the applied electric field, and can be given as ε∗=ε−i(σ∕ω). The effects of the permittivity can be well controlled at high frequencies, while the conductivity dominates at relatively low frequencies. Polarizable particles can exhibit attraction Re(fCM(ω))>0, positive DEP (pDEP) or repulsion Re(fCM(ω))<0, and negative DEP (nDEP) from the high electric field region according to its frequency dependent properties. The frequency at the CM factor near zero is known as the cross-over frequency (cof). Some different genera of bacteria exhibit distinct cof’s.7 Quite conveniently, the size difference between bacteria and blood cells results in different DEP strengths which provide more effective separation.9 Thus, dielectrophoresis offers a very sensitive sorting platform for target cells.
A three-dimensional (3D) microfluidic chip with a face-to-face pair of electrodes has been developed and successfully used for the separation of particles.10, 11 With face-to-face electrode DEP, there is a low decay of the field across the top and bottom of the microchannel versus DEP based on electrodes within the same plane, which allows more effective control of target particles and extends many applications. A DEP barrier-based microsystem12 and a DEP-based chip for rapid DNA hybridization13 have all been implemented within the past decade.
For samples with only a few types of target bacteria, such as used when diagnosing genus from blood samples, Raman detection is an attractive platform as it requires very few off- and on-chip processing steps. Raman spectroscopy is based on the measurement of scattered light from the vibration energy levels of chemical bonds following excitation. As previously reported, Raman spectra exhibit peaks unique to each bacterium that can act as bacterial (fungi) fingerprints,14, 15, 16 as Raman spectroscopy can be used to obtain the fingerprint information of a biological sample directly without damaging target cells or requiring complex preparation processes. Unfortunately, the Raman signal is obtained from biological samples that essentially demonstrate very weak spectra with much fluorescence background noise.17 Therefore, amplification of the Raman signal is usually needed to allow discrimination.
Metallic nanoparticles (NPs), a well known surface-enhanced Raman scattering (SERS) technique, can be introduced to the cell surface to generate a more distinguishable Raman signal of higher intensity.18 Unfortunately, the uniformity of the aggregates is quite random and produces undesirable variations in the spectra. It is worth noting that the surface conductance and the total size of each bacteria are changed by attaching NPs or other molecules,19 and this will greatly influence the cross-over frequency of the bacteria and might make it difficult to separate bacteria using electrokinetic methods. A structured micropillar array in a microfluidic channel has been developed to achieve a homogeneous mixing of NPs and analyte.20 Nevertheless, it is still not robust enough for microorganisms or cells, which must generally be localized and concentrated.
A rough metal surface has been considered as an alternative way to produce the SERS effect21, 22 for the discrimination of bacteria fingerprints.23, 24 As summarized by earlier researchers, the SERS effect might occur as a result of chemical and electromagnetic mechanisms. Chemical enhancement normally takes place at sites of atomic scale roughness on the metal surface and involves the exchange of electrons between the metal substrate and the targets. The electromagnetic field resulting from the excitation illumination impinging on the rough surface can be generally enhanced via the surface plasmon excitation.25 Other structured metallic substrates, such as gold nanowires, have also been reported to enhance the SERS effect.26 Until now, even these NP-based SERS detection methods or substrate-based methods could achieve pure-sample identification with high concentration. However, it is still not possible to recognize a low concentration target from a complex mixture sample. For example, bacterial detection in a blood sample is important and necessary for diagnosing bacteremia. Here, incubating bacteria to a high concentration (∼109 CFU∕ml) may still be needed for substrate-based SERS methods,27 which hinders their practical applications. High ac voltage (kilovolt) was used to generate a hydrodynamic vortex inside the 100 μl fluidic bench for particle trapping.28 It is worth mentioning that the applicable high voltage in a biological sample should be well controlled, and high voltage equipments are difficult to miniaturize.
In this study, a portable and rapid biodiagnostic DEP chip is used to continuously sort and concentrate bacteria and to perform on-chip SERS detection. The electrode of the bottom layer is specially fabricated on a thin cover slip (∼0.17 mm) to reduce fluorescence noise generated from the laser light. Moreover, a chemical etching method has been utilized to roughen the glass substrate. This is followed by a physical deposition of the Au∕Cr metal layer. A roughened metal shelter was placed on the top layer in front of the DEP trapper to induce a SERS signal and reduce fluorescence noise from the glass substrate. The challenge of previous works for Raman detection could be addressed through the combination of continuous flow and DEP sorting, concentrating the targets, and using a roughened metal surface for on-chip SERS detection without needing NPs. Until now, the DEP-based microfluidic chip integrated with a roughened metal surface for on-chip SERS detection of bacteria has not been reported in the literature.
MATERIALS AND METHODS
Chip design
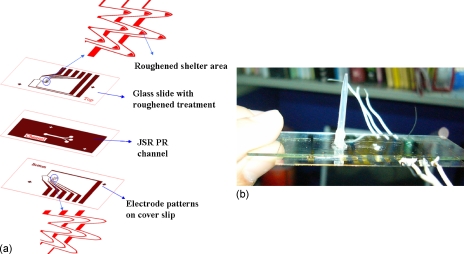
The 3D integrated chip consisted of a patterned electrode design on a thin cover slip at the bottom layer of the microchip to reduce the fluorescence noise from the glass substrate. On the top layer of microchannel, the electrode was fabricated on a roughened glass slide and a patterned shelter area was designed to prevent the penetration of laser light and enhance Raman scattering. Thus, the fluorescence noise and back scattering from the top glass slide were gradually reduced. Moreover, the metallic shelter with roughened surface provided a significant increase of the Raman signal resulting in distinguishable refraction and molecular vibration information from target cells. The construction of the chip is shown in Fig. 1a. The paired electrodes and arrowhead-curvature electrodes were designed for continuous separating and concentrating targets into specific roughened metal shelters. The paired electrodes were placed upstream to continuously sort the detecting targets into their specific trappers. In this manner, target bacteria can be continuously concentrated and localized into the roughened metal areas by the arrowhead electrode trappers. It was found that the trapping area with the roughened metal shelter not only encouraged bacteria aggregation but also supported SERS detection. The finished chip is shown in Fig. 1b.
Figure 1.
(a) Chip design and construction. The electrode patterns of the bottom layer were fabricated on a thin cover slip slide and the electrode pattern of the top layer was fabricated on a treated glass slide. A roughened metal shelter was designed in front of the trapping electrode of the top layer that not only reduces the fluorescence noise but also enhances Raman signal. (b) Finished chip.
Microfabrication
Buffered oxide etchant (BOE) etching was widely used for creating the asperities on the substrate.29 Glass slides (26×26 mm2 and 1 mm thick) of different surface roughnesses were etched by BOE solution (HF:NH4F=1:6). A nonuniform etching rate, by monitoring the by-products such as CaF2 and MgF2, which form some natural gemstones during BOE etching, was applied to control the level of roughness. Briefly, the glass slide was placed in a BOE solution for 1 min and air dried for 30 s that were repeated five times to get the first roughened surface type (RS-1). For the second type (RS-2), the glass slide was dipped in BOE solution for 30 s and then air dried for 20 s. These two steps were repeated ten times. After completing the surface roughening processes, the slide was sonicated in HCl solution for 3 min to remove impurities. A 200∕30 nm thickness of Au∕Cr layer was deposited on the glass slide and cover slip using an electrobeam evaporator. Standard photolithography and wet metal etching used for microelectrode patterning are similar to our earlier work.9 After electrode patterning, JSR THB-126N (Techpoint) photoresist, a negative photosensitive acrylic resin photoresist with good bonding strength, flatness, and coverage, was spin-coated on an electrode-patterned cover slip. Following the standard JSR photolithography technique, a microchannel of 18 μm in height, 1 mm in width, and 1 cm long was patterned. At the slide edges, the residual JSR photoresist was removed during the channel fabrication step to achieve a better and smoother bonding layer that normally culminated in a good bonding result. The fluidic inlet and outlet ports were made on the top slide at the ends of the microchannel. The alignment marks were also defined in the microelectrode and microchannel fabrication steps. The prepared top and bottom slides were microscopically aligned and thermal bonded at 200 °C for 20 min.
Experimental setup
A function generator (FLUKE 284) was used to support an output voltage range of 0.1–20 Vp-p with a frequency range of 0–16 MHz and multioutput with four isolation channels. The suspension of bioparticles was placed into a 500 μl microsyringe (Hamilton 81220) and injected continuously into the microchannel using a microsyringe pump (KDS 230) routed through a Teflon tube (ID=0.5 mm, OD=1.5 mm). The experiment was observed through an inverted microscope (Olympus CH 40) and the results were recorded in both video and photo format using a high speed charge-coupled device (CCD) camera (20 frames∕s, Microfire).
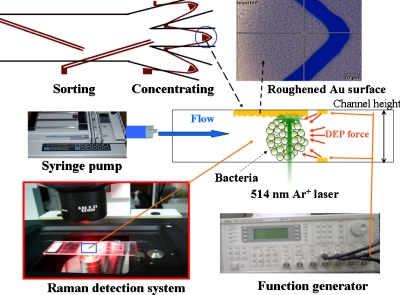
SERS measurement was performed using a confocal microscopic Raman spectrometer (Renishaw, United Kingdom). An argon laser at 514 nm was used for excitation through an inverted microscope. The laser power at the sample position was around 1 mW and the scattering light was collected using a 40× objective lens connected to a CCD. A grating of 1800 lines∕mm was used to disperse the scattered light. The Raman shift was calibrated using a signal of 520 cm−1 generated from a silicon wafer. All spectra reported here of the exposure time were set to 10 s, and signal was accumulated three times in a range of 500–3200 cm−1. Rayleigh scattering was blocked using a holographic notch filter and the tilted baselines of some SERS spectra were corrected to flat by WIRE 3.1 software. The integrated experimental system is shown in Fig. 2.
Figure 2.
Configuration of the setup. The samples were injected into the microfluidic chip using a syringe pump. After the separation procedure, the bacteria were trapped by negative DEP force and aggregated into the roughened metal shelter for SERS detection.
Sample preparation
Gram positive bacteria, Staphylococcus aureus (S. aureus, BCRC 14957), and Gram negative bacteria, Pseudomonas aeruginosa (P. aeruginosa, ATCC 27853), were cultured on tryptic soy agar (TSA) at 35 °C. Applying high voltage across a high conductivity medium always induces chemical reactions and strong Joule heating that destroys microelectrodes and cells, while Joule heating also carries electrothermal fluid convection. These effects could influence cell viability∕activity, trapping efficiency and stability of Raman measurement. An isotonic solution of 300 mM sucrose with low conductivity was used to adjust the conductivity of the experimental buffer solution. To study the bacteria separating from the blood cells, 1X phosphate buffered saline diluted with 300 mM sucrose in a 1:12 ratio was used for the buffer owing to blood cells highly sensitive to the osmotic pressure of the solution. To induce negative DEP, the mixture conductivity was further adjusted to 1.3 mS∕cm to facilitate DEP manipulation and Raman detection without chemical reaction and reduced Joule heating. Under this condition, the cof’s of human red blood cells (RBCs) and S. aureus were roughly 700–800 kHz and 6–7 MHz, respectively (DEP behaviors of both RBCs and bacteria were observed from negative to positive when the frequency increased beyond their cof’s). Blood cells were diluted 1000-fold and resuspended in this isotonic solution to a final cell concentration of ∼106 cells∕ml. The bacteria and blood cell solutions with the concentrations of 106 CFU∕ml and 106 cells∕ml, respectively, were mixed by a ratio of 50:50. Finally, the mixture solution was used throughout the study.
RESULTS AND DISCUSSION
Atomic force microscopy images of the roughened surface
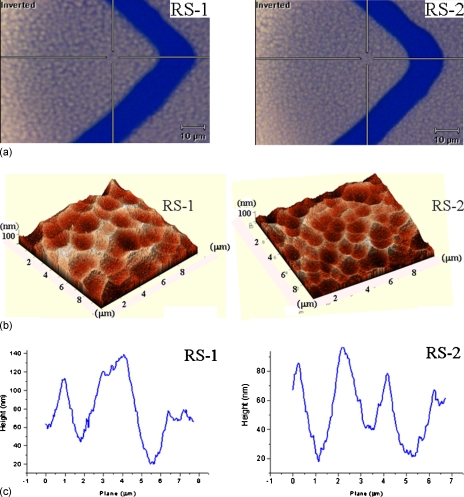
Atomic force microscopy (AFM) (NtMDT-P7LS) was used for measuring the roughness and morphology of the roughened electrode surface. Tapping-mode was used with a scan rate of about 0.9–1.2 Hz and was set to scan the surface with an area of 10×10 μm2. The radius of AFM tip is smaller than 10 nm and the spring constant of cantilever was calculated as 2.0 N∕m. As described previously, we controlled the etching conditions to make the glass substrate with two different roughened surfaces. Figures 3a, 3b show microscopy and AFM images of the two types of roughened electrode surfaces, respectively. The first type of roughened surface (RS-1) demonstrated several flat peaks approximately 1–1.5 μm and a semicircular groove approximately 2–2.5 μm, while the peak-to-valley roughness was roughly 80–100 nm, as shown in Fig. 3c. By contrast, the second type of roughened surface (RS-2) demonstrated sharper peaks and a smaller semicircle groove around 1–1.5 μm with a peak-to-valley roughness in the 60–80 nm range, as illustrated in Fig. 3c. Three averages of these characteristics were taken: RS-1 surface contained 25 valleys with fewer peaks and RS-2 surface contained 59 valleys with more sharp peaks in the 100 μm2 area.
Figure 3.
(a) Microscopy image and (b) AFM image of two types of roughened Au surface. (c) RS-1 surface demonstrated flat peaks with a peak-to-valley roughness of 80–100 nm. RS-2 surface demonstrated sharper peaks with peak-to-valley roughness of 60–80 nm.
SERS on a roughened substrate
Low laser power at 1 mW was used to avoid cell damage during Raman measurements. The intensity count was approximately 800 when the Raman laser irradiated the calibration silicon wafer. All of the Raman data were acquired with a 40× objective and a spot size of ∼10 μm in diameter. The laser beam was then targeted on the aggregated bacterial cells. The Raman signal was detected with a spectrum in the range of 500–3200 cm−1.
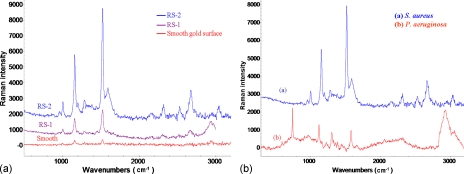
2 μl of bacteria solution with a concentration of 109 CFU∕ml was directly dropped on the different roughened electrode surface to measure the SERS. As shown in Fig. 4a, the Raman spectra of S. aureus from different roughened electrode surfaces present a similar pattern. Here, the Raman spectra of S. aureus were obtained using the RS-1 substrate, RS-2 substrate (more and sharper peaks), and smooth substrate with gold evaporation, respectively. As evident, on the smooth Au surface, the bacteria spectrum demonstrated only three peaks at 1158, 1522, and 2940 cm−1. By contrast, the SERS spectrum with eight peaks (1008, 1158, 1288, 1523, 1588, 2313, 2670, and 2938 cm−1) was identified when bacteria were placed on the RS-1 surface. A similar SERS pattern, but with more distinguishable peaks, was seen at 960, 1007, 1199, 1158, 1288, 1442, 1522, 1589, 2313, 2535, 2670, and 3035 cm−1, and could be produced when using RS-2 surface. The results indicated that the intensity of characteristic SERS spectra peaks on RS-1 and RS-2 surface could enhance the signal by at least 5 and 30 times, respectively, when compared with the spectrum of normal Raman (smooth surface). This enhancing ability of the RS-2 surface is probably higher due to the greater number of sharp peaks and smaller valleys in the spotlight area that induce a higher electromagnetic field coupled with the incoming electric field from the incident radiation to produce greater local optical field.25 Further, the spot size of the laser was about 10 μm. There are more valleys and more sharp peaks are involved in the spotlight area when the laser light was applied to the RS-2 SERS-bacteria region. This is probably due to the RS-2 surface that supports a higher tip-electromagnetic field with larger signal enhancement. Therefore, the RS-2 surface will be used to fabricate the top layer of the 3D integrated chip for further study of on-chip SERS detection.
Figure 4.
(a) The Raman spectra of S. aureus detected by different roughened electrode surfaces. The purple curve, blue curve, and red curve were obtained from the RS-1, the RS-2, and the smooth Au surface, respectively. (b) The measurement results of S. aureus [curve (a)] and P. aeruginosa [curve (b)] show distinct SERS spectra that are promising for fingerprint discrimination.
Figure 4b shows very distinct fingerprints for the discrimination of S. aureus (Gram positive bacteria) and P. aeruginosa (Gram negative bacteria). As can be seen, higher fluorescence scattering and signal-to-noise ratio of P. aeruginosa might slightly reduce the readability of vibration signals when compared with S. aureus. However, the P. aeruginosa SERS spectrum enhances by approximately tenfold as a result of the remarkable peaks at 597, 750, 915, 1125, 1167, 1230, 1308, 1337, 1362, 1389, 1451, 1578, 1662, and 2061 cm−1 [Fig. 4b, spectrum (b)]. In addition, the Gram positive and Gram negative bacteria are promising in terms of allowing easy and rapid discrimination with our microfluidic platform without requiring complex sample treatment (i.e., using the nanoparticles of Refs. 7, 28).
Sorting bacteria from a blood sample
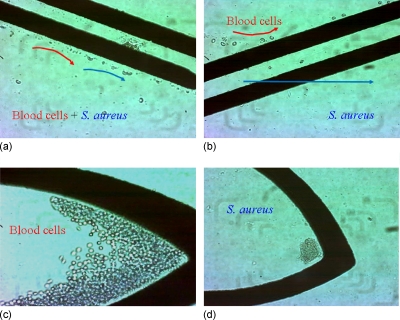
To prove the sorting capabilities of this chip, a bacteria concentration of 106 CFU∕ml and diluted blood sample were mixed to simulate bacteremia detection after blood culture. On the first paired electrode, an ac potential of 20 Vp-p at a frequency of 500 kHz and a flow rate of 1 μl∕min were applied for guiding blood cells and bacteria to the paired sorting electrode. The guiding, sorting, and concentrating results on the chip are shown in Fig. 5. As can be seen clearly, blood cells and bacteria were first repelled by the nDEP force and then guided to the sorting electrode under laminar flow, as shown in Fig. 5a. On the second paired electrode, 12 Vp-p at a frequency of 500 kHz was applied to separate bacteria and blood cells based on their different DEP mobilities. To start separation, as shown in Fig. 5b, blood cells were repelled to the top subchannel by higher nDEP mobility. In contrast, bacteria exhibited lower nDEP mobility and penetrated the paired electrode at the lower subchannel. After the guiding and sorting steps of bacteria and blood cells, an arrowhead-curvature electrode with an applied voltage of 20 Vp-p at a frequency of 500 kHz was set to concentrate those targets in front of the electrodes, as shown in Figs. 5c, 5d. After the sorting process, 20 μl products from outlet 2 and outlet 3 were then cultured in two TSA plates to estimate the sorting efficiency; roughly 80% sorting efficiency of S. aureus was achieved. The sorting efficiency of blood cells was approximately 98% [estimated by counting chambers (Marienfeld Superior, Germany)]. Previous works have reported electrodeless DEP devices to trap DNA molecular and spores by positive DEP force.30, 31 However, effectively trapping bacteria and cells in a continuous flow (with flow velocity of ∼1 mm∕s), the electric field should be as high as 106 V∕m. Trapping bacteria or cells by positive DEP at such high electric field regions for long time analysis would damage live cells. Using negative DEP can push bioparticles away from high field regions to avoid cell damaging. The interaction of negative DEP force and hydrodynamic drag force can trap and localize target cells effectively without cell damage in a continuous flow.
Figure 5.
Results of guiding, sorting, and concentrating. (a) Blood cells and bacteria were guided to the sorting electrode by nDEP and laminar flow. (b) Blood cells were repelled to the upper subchannel while bacteria penetrated the paired electrode that flowed to the lower subchannel. Blood cells (c) and bacteria (d) were concentrated at their specific locations after the guiding and sorting steps.
On-chip SERS analysis
The bacteria were concentrated and trapped in the roughened shelter region whose nano∕microscale roughness would increase the reflection and molecular vibrations.25 An S. aureus colony taken from the agar plate was suspended in 500 μl of buffer solution with a concentration of 106 CFU∕ml. The suspended solution was mixed with blood cells (50:50). The mixture solution was then injected into the chip with a flow rate of 1 μl∕min to separate the target cells into the isolated subchannel. After separation, the target bacteria were continuously collected and concentrated by the trapping electrodes under an applied electric field of 20 Vp-p at a frequency of 500 kHz. Previous reports mentioned that bioparticles have two cross-over frequencies in DEP spectrum.32, 33 For cell∕bacteria-based bio-objects, the conductivity of the cell membrane (typically ∼0.5 μS∕m) (Ref. 32) and cell wall (typically 0.1–0.5 mS∕cm for bacteria)34 is much lower than our buffer (1.3 mS∕cm), hence induced negative DEP (100–700 kHz for RBCs). At a sufficiently high frequency (f>σm∕εmem), the electric field can penetrate through the cell membrane and into the cytoplasm;8 the interior cytoplasm conductivity of cell is roughly in the range of 0.3–0.5 S∕m,33 therefore RBCs and bacteria showed positive DEP in our solution (σ=1.3 mS∕cm). At a very high frequency (generally >70 MHz), the bio-object should demonstrate negative DEP to bring second cross-over frequency because the permittivity of cell (∼60) is lower than the surrounding medium (∼80). The undesirable pDEP was observed to typically occur at high frequency (for S. aureus, f>2 MHz, and for RBCs, f>800 kHz). Therefore, the surrounding medium was controlled with a conductivity of 1.3 mS∕cm and the frequency of 500 kHz was selected to generate a strong negative DEP force for effective bacteria trapping. After 3 min of collection, the target bacteria had accumulated enough volume onto the roughened SERS surface and in situ Raman spectra could be taken on-chip directly via focusing the Raman laser on the concentrated bacteria slugs.
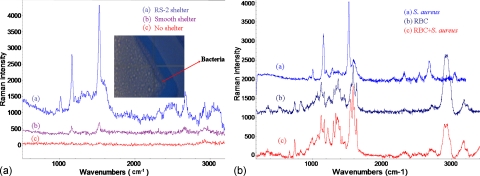
Figure 6 shows the results of Raman spectra of S. aureus that were detected after sorting from bacteria-RBC mixture and concentrating into the detection location on the integrated chip. In a no-shelter chip, the Raman spectrum [Fig. 6, curve (c)] contains pronounced fluorescence noise that is normally generated from the penetration of laser light through the glass substrate. This might overcome the Raman signal and cause no distinguishable peaks after baseline correction. Most of biochips are fabricated with glass slides to reduce costs and enable observation. In order to avoid back scattering and fluorescence, Raman spectra were taken in conjunction with a smooth metal shelter at the top layer of DEP chip [Fig. 1a] and indicated that the fluorescence effect from the glass substrate could be easily reduced. By contrast, Raman spectra with two identical peaks at 1155 and 1520 cm−1 could be obtained from the chip with smooth Au shelters after 3 min of the concentrating process, as shown in curve (b) of Fig. 6.
Figure 6.
(a) The Raman spectra of S. aureus detected on the integrated chip. Curves (a), (b), and (c) were obtained on a 3D chip with a roughened Au shelter surface (RS-2), with smooth Au shelter, and without an Au shelter, respectively. (b) The SERS signatures of S. aureus, RBC, and RBCs/bacteria mixture (RBCs:bacteria=1:10).
With regard to the SERS enhancement from the roughened metal surfaces, the results are shown in Fig. 4. RS-2 exhibited a better topography and was therefore used to create an Au shelter area in front of the trapper where the bacteria could aggregate together under the shelter area. The result demonstrated lower fluorescence noise and remarkable peaks at 958, 1007, 1199, 1158, 1286, 1448, 1522, 1588, 2313, 2536, 2670, and 2933 cm−1, as shown in Fig. 6 [curve (a)]. The signal was enhanced approximately ten times when compared with the SERS spectra from the smooth-shelter surface.
The concentration effect of the targets around the amplified Raman signal has been reported previously.35 It was found that higher target concentration could lead to a slightly higher Raman signal. The advantage of this work over the others is that the target bacteria can be continuously isolated from the mixture solution and then accumulated and concentrated by dielectrophoretic force under an applied laminar flow. Inside this chip, the multifunctional area not only supports the fixation of a bacteria slug but also creates an extremely high bacteria concentration at a local site for effective on-chip SERS fingerprinting of bacteria.
The Raman signatures of S. aureus, RBC, and RBCs∕bacteria mixture (RBC:bacteria=1:10) were detected and shown in Fig. 6b. The results demonstrated that the SERS signals of RBC and S. aureus were very different, and the spectrum of RBC∕bacteria mixture appeared complex signal but similar to RBC signature. This suggests that it is difficult to detect the target bacteria without a separation procedure. The sorting efficiencies of S. aureus and blood cells were roughly 80% and 99%, respectively. However, after DEP sorting, the high percentage S. aureus was trapped into the detection region (only roughly 1% RBCs could be included in the trapped slug), which was capable for elective SERS identification.
CONCLUSION
The DEP-based microfluidic chip with a roughened metal surface for on-chip SERS detection of bacteria has been demonstrated in this article. Laser power of approximately 1 mW can be used for on-chip collection of SERS signal of S. aureus. Smooth and roughened electrode surfaces were compared with respect to SERS enhancement, and it was observed that the SERS signal arising from RS-2 can be amplified approximately 30 times when compared with the normal Raman spectra due to higher electromagnetic tip enhancement from the greater sharpness of the roughened surface. Gram positive (S. aureus) and Gram negative (P. aeruginosa) bacteria were also effectively distinguished in the detected SERS spectra. Targets in low concentration solution can be continuously concentrated and localized within the microchip and enriched via negative DEP force. Therefore, extremely high bacteria concentration at a local site can be achieved within few minutes. Further, in situ SERS enhancement of the concentrated samples in each specific subchannel can be successfully performed through the patterned roughened electrode surface. SERS discrimination with distinguishable peaks can be obtained after 3 min of concentration of a solution containing bacteria at 106 CFU∕ml. The operation process would be prolonged to around 30 min if the concentration of bacteria is approximately 105 CFU∕ml.
ACKNOWLEDGMENTS
This work was supported by the Ministry of Education, Taiwan, R.O.C. under the NCKU Project of Promoting Academic Excellence & Developing World Class Research Centers (R017), Department of Health, Executive Yuan, Taiwan (DOH99-TD-N-111-010) and the NSC under Grant Nos. 96-2628-B-006-010 MY3 and 97-2218-E-006-004. We also thank National Nano Device Laboratory and Southern Taiwan Nanotechnology Research Center for supplying microfabrication equipment. The authors would like to thank Professor Tsung-Chain Chang in the Department of Medical Laboratory Sciences and Biotechnology at the National Cheng Kung University for supplying the S. aureus and P. aeruginosa. We are grateful to Professor Hsueh-Chia Chang at the University of Notre Dame for input and assistance in the manuscript preparation.
References
- Chen C. -C., Teng L. -J., Tsao S. -K., and Chang T. -C., J. Clin. Microbiol. 43, 1515 (2005). 10.1128/JCM.43.4.1515-1521.2005 [DOI] [PMC free article] [PubMed] [Google Scholar]
- Gupta A., Akin D., and Bashir R., J. Vac. Sci. Technol. B 22, 2785 (2004). 10.1116/1.1824047 [DOI] [Google Scholar]
- Pohl H. A., Dielectrophoresis (Cambridge University Press, Cambridge, England, 1978). [Google Scholar]
- Gascoyne P., Mahidol C., Ruchirawat M., Satayavivad J., Watcharasit P., and Becker F. F., Lab Chip 2, 70 (2002). 10.1039/b110990c [DOI] [PMC free article] [PubMed] [Google Scholar]
- Yang F., Yang X. M., Jiang H., Bulkhaults P., Wood P., Hrushesky W., and Wang G., Biomicrofluidics 4, 013204 (2010). 10.1063/1.3279786 [DOI] [PMC free article] [PubMed] [Google Scholar]
- Church C., Zhu J., Wang G., Tzeng T. J., and Xuan X., Biomicrofluidics 3, 044109 (2009). 10.1063/1.3267098 [DOI] [PMC free article] [PubMed] [Google Scholar]
- Cheng I. -F., Chang H. -C., Hou D., and Chang H. -C., Biomicrofluidics 1, 021503 (2007). 10.1063/1.2723669 [DOI] [Google Scholar]
- Pethig R., Biomicrofluidics 4, 022811 (2010). 10.1063/1.3456626 [DOI] [PMC free article] [PubMed] [Google Scholar]
- Cheng I. -F., Froude V. E., Zhu Y. X., Chang H. -C., and Chang H. -C., Lab Chip 9, 3193 (2009). 10.1039/b910587e [DOI] [PubMed] [Google Scholar]
- Fiedler S., Shirley S. G., Schnelle T., and Fuhr G., Anal. Chem. 70, 1909 (1998). 10.1021/ac971063b [DOI] [PubMed] [Google Scholar]
- Müller T., Gradl G., Howitz S., Shirley S. G., Schnelle T., and Fuhr G., Biosens. Bioelectron. 14, 247 (1999). 10.1016/S0956-5663(99)00006-8 [DOI] [Google Scholar]
- Chen D. F. and Du H., Microfluid. Nanofluid. 3, 603 (2007). 10.1007/s10404-007-0151-x [DOI] [Google Scholar]
- Cheng I. -F., Senapati S., Cheng X., Basuray S., Chang H. -C., and Chang H. -C., Lab Chip 10, 828 (2010). 10.1039/b925854j [DOI] [PubMed] [Google Scholar]
- Maquelin K., Kirschner C., Choo-Smith L. P., Ngo-Thi N. A., van Vreeswijk T., Stammler M., Endtz H. P., Bruining H. A., Naumann D., and Puppels G. J., J. Clin. Microbiol. 41, 324 (2003). 10.1128/JCM.41.1.324-329.2003 [DOI] [PMC free article] [PubMed] [Google Scholar]
- Jarvis R. M. and Goodacre R., Anal. Chem. 76, 40 (2004). 10.1021/ac034689c [DOI] [PubMed] [Google Scholar]
- Huh Y. -S., Chung A. J., and Erickson D., Microfluid. Nanofluid. 6, 285 (2009). 10.1007/s10404-008-0392-3 [DOI] [Google Scholar]
- Kneipp K., Haka A. S., Kneipp H., Badizadegan K., Yoshizawa N., Boone C., Shafer-Peltier K. E., Mozt J. T., Dasari R. R., and Feld M. S., Appl. Spectrosc. 56, 150 (2002). 10.1366/0003702021954557 [DOI] [Google Scholar]
- Lin C. -C., Yang Y. -M., Chen Y. -F., Yang T. -S., and Chang H. -C., Biosens. Bioelectron. 24, 178 (2008). 10.1016/j.bios.2008.03.035 [DOI] [PubMed] [Google Scholar]
- Gagnon Z., Senapati S., and Chang H. -C., Electrophoresis 29, 4808 (2008). 10.1002/elps.200800528 [DOI] [PubMed] [Google Scholar]
- Quang L. -X., Lim C. S., Seong G. -H., Choo J. B., Do K. -J., and Yoo S. -K., Lab Chip 8, 2214 (2008). 10.1039/b808835g [DOI] [PubMed] [Google Scholar]
- Kahl M., Voges E., Kostrewa S., Viets C., and Hill W., Sens. Actuators B 51, 285 (1998). 10.1016/S0925-4005(98)00219-6 [DOI] [Google Scholar]
- Zhang L. S., Zhang P. X., and Fang Y., J. Colloid Interface Sci. 311, 502 (2007). 10.1016/j.jcis.2007.03.024 [DOI] [PubMed] [Google Scholar]
- Vo-Dinh T., Stokes D. L., Griffin G. D., Volkan M., Kim U. J., and Simon M. I., J. Raman Spectrosc. 30, 785 (1999). [DOI] [Google Scholar]
- Premasiri W. R., Moir D. T., and Ziegler L. D., Proc. SPIE 5795, 19 (2005). 10.1117/12.605742 [DOI] [Google Scholar]
- Campion A. and Kambhampati P., Chem. Soc. Rev. 27, 241 (1998). 10.1039/a827241z [DOI] [Google Scholar]
- Gamby J., Rudolf A., Abid M., Girault H. H., Deslouisa C., and Tribolleta B., Lab Chip 9, 1806 (2009). 10.1039/b820802f [DOI] [PubMed] [Google Scholar]
- Jarvis R. M., Brooker A., and Goodacre R., Faraday Discuss. 132, 281 (2006). 10.1039/b506413a [DOI] [PubMed] [Google Scholar]
- Hou D., Maheshwari S., and Chang H. -C., Biomicrofluidics 1, 014106 (2007). 10.1063/1.2710191 [DOI] [PMC free article] [PubMed] [Google Scholar]
- Tan C. -M., Linggajaya K., Er E., and Chai V. S.-H., IEEE Trans. Compon. Packag. Technol. 22, 551 (1999). 10.1109/6144.814971 [DOI] [Google Scholar]
- Swami N., Chou C. -F., Ramamurthy V., and Chaurey V., Lab Chip 9, 3212 (2009). 10.1039/b910598k [DOI] [PubMed] [Google Scholar]
- Lapizco-Encinas B. H., Davalos R. V., Simmons B. A., Cummings E. B., and Fintschenko Y., J. Microbiol. Methods 62, 317 (2005). 10.1016/j.mimet.2005.04.027 [DOI] [PubMed] [Google Scholar]
- Gordon J. E., Gagnon Z., and Chang H. -C., Biomicrofluidics 1, 044102 (2007). 10.1063/1.2818767 [DOI] [PMC free article] [PubMed] [Google Scholar]
- Gagnon Z., Gordon J., Sengupta S., and Chang H. -C., Electrophoresis 29, 2272 (2008). 10.1002/elps.200700604 [DOI] [PubMed] [Google Scholar]
- Gagnon Z., Mazur J., and Chang H. -C., Biomicrofluidics 3, 044108 (2009). 10.1063/1.3257857 [DOI] [PMC free article] [PubMed] [Google Scholar]
- Filik J. and Stone N., Analyst (Cambridge, U.K.) 132, 544 (2007). 10.1039/b701541k [DOI] [PubMed] [Google Scholar]


