Abstract
The piezoelectric response of [001] poled domain engineered (1−x)Pb(Mg1∕3Nb2∕3)O3−xPbTiO3 (PMN-PT) crystals was investigated as a function of composition and phase using Rayleigh analysis. The results revealed that the intrinsic (reversible) contribution plays a dominant role in the high piezoelectric activity for PMN-PT crystals. The intrinsic piezoelectric response of the monoclinic (MC) PMN−xPT crystals, 0.31≤x≤0.35, exhibited peak values for compositions close to R-MC and MC-T phase boundaries, however, being less than 2000 pC∕N. In the rhombohedral phase region, x≤0.30, the intrinsic piezoelectric response was found to increase as the composition approached the rhombohedral-monoclinic (R-MC) phase boundary. The maximum piezoelectric response was observed in rhombohedral PMN-0.30PT crystals, being on the order of 2500 pC∕N. This ultrahigh piezoelectric response was determined to be related to the high shear piezoelectric activity of single domain state, corresponding to an ease in polarization rotation, for compositions close to a morphotropic phase boundary (MPB). The role of monoclinic phase is only to form a MPB with R phase, but not directly contribute to the ultrahigh piezoelectric activity in rhombohedral PMN-0.30PT crystals. The extrinsic contribution to piezoelectric activity was found to be less than 5% for the compositions away from R-MC and MC-T phase boundaries, due to a stable domain engineered structure. As the composition approached MPBs, the extrinsic contribution increased slightly (<10%), due to the enhanced motion of phase boundaries.
INTRODUCTION
Relaxor-based ferroelectric single crystals, such as (1−x)Pb(Zn1∕3Nb2∕3)O3−xPbTiO3 (PZN-PT) and (1−x)Pb(Mg1∕3Nb2∕3)O3−xPbTiO3 (PMN-PT) have attracted interest over the last decade due to their superior piezoelectric properties compared to commercial piezoelectric ceramics, including (1−x)PbZrO3−xPbTiO3 (PZT). In relaxor-based crystals, the ultrahigh piezoelectric response (d33>2500 pC∕N, k33>95%) is found to occur along the [001] crystallographic direction, for compositions lying in proximity to a morphotropic phase boundary (MPB).1, 2 The high piezoelectric activity in relaxor-based crystals is believed to be primarily intrinsic in nature. Two mechanisms, based on intrinsic contributions, have been proposed. The first one is “polarization rotation,”3 where the high piezoelectric response is attributed to a monoclinic phase found in the MPB region. In this theory, the monoclinic (M) phase acts as a bridge between rhombohedral (R) and tetragonal (T) phases, allowing the polarization vector to easily rotate.4 From first principle calculations,3, 5 the rotation paths, “R-MA,” “O-MC,” and “MA-MC,” were proposed to play an important role in the high piezoelectric activity, where the two monoclinic MA and MC phases were described in Refs. 3, 4. In the second intrinsic mechanism, the high piezoelectric response was attributed to the large degree of anisotropy in rhombohedral crystals,6, 7 due to a flattening of the Gibbs free energy profile near the MPB.8, 9, 10 In this case, the observed monoclinic structure was considered to be piezoelectrically distorted R, O, or T phases, resulting from the application of an electric field away from the ⟨111⟩ polar axis.11
Regardless of the debate about the presence and role of a monoclinic phase, the ultrahigh piezoelectric response in PMN-PT and PZN-PT crystals is attributed to an intrinsic contribution, i.e., lattice deformation. From previous works, based on anisotropic calculations, eighty percent of the piezoelectric response in [001] poled PMN-0.33PT crystals was believed to be related to an intrinsic contribution.6, 7
On the other hand, extrinsic contributions were thought to be an important factor for the high piezoelectric response in relaxor-based PMN-PT and PZN-PT crystals. A high level of domain wall mobility was pointed out to be responsible for the high piezoelectric response of PMN-PT and PZN-PT crystals in an “adaptive phase model.”12, 13 In addition, the domain wall density was also suggested to be responsible for high piezoelectric response, as reported in BaTiO3 crystals.14
Recently, Rayleigh analysis has been successfully used to quantitatively describe the degree of extrinsic contribution to the dielectric and piezoelectric response in ferroelectric ceramics and single crystals.15, 16, 17, 18, 19, 20, 21 In previous studies, the intrinsic (reversible) and extrinsic (irreversible) contributions to the piezoelectric response in domain engineered PMN-PT and PZN-PT crystals were studied from the direct piezoelectric response.17, 21 The high intrinsic contribution to the piezoelectric response was observed in PMN-PT and PZN-PT crystals, being >1300 pC∕N for PZN-0.045PT and >1800 pC∕N for PZN-0.08PT and PMN-0.32PT crystals. The extrinsic contribution was found to be 5% and 20% for PZN-0.045PT and PZN-0.08PT crystals, respectively.21 However, those experiments were focused on limited compositions of PMN-PT and PZN-PT crystals (PZN-0.045PT, PZN-0.08PT, PMN-0.32PT).
To date, the relationship between composition∕phase and intrinsic∕extrinsic contributions has not been systematically established. Thus, an investigation of the intrinsic and extrinsic piezoelectric response in relaxor-based crystals as a function of composition around the MPB is essential to better understand the underlying nature of the ultrahigh piezoelectric response in relaxor-based crystal systems.
In this paper, the variation in intrinsic and extrinsic contributions to the piezoelectric response was investigated using the Rayleigh analysis for [001] poled (1−x)PMN−xPT crystals as a function of composition. The crystals investigated in this study were categorized into rhombohedral (x≤0.30), monoclinic (0.31≤x≤0.36) and tetragonal (x≥0.36) regions. The ferroelectric phase(s) of investigated crystals were inferred by temperature dependent dielectric permittivity and electric-field-induced-strain measurements. The maximum intrinsic (reversible) piezoelectric response of PMN-PT crystals was found to lie in the rhombohedral phase close to the R-MC phase boundary, where the extrinsic contribution was less than 6%. Although the extrinsic piezoelectric response of PMN-PT crystals showed peak values around the R-MC and MC-T phase boundaries, the extrinsic contribution to total piezoelectric response was less than 10% for all domain engineered PMN-PT crystals. Our results support previous models that the underlying mechanism for the high piezoelectric activity in relaxor-PT based crystals is intrinsic. Furthermore, the high intrinsic piezoelectric response is related to the nature of a MPB, where the enhanced shear piezoelectric response of single domain state is the main contributor to the high longitudinal piezoelectric response in domain engineered crystals.
EXPERIMENTAL APPROACH
PMN-PT single crystals with a series of compositions were grown along their crystallographic ⟨001⟩ direction using the modified Bridgman technique.22, 23 The samples were oriented by real-time Laue and cut to obtain longitudinal rods with dimensions of 1.5×1.5×6 mm3. Vacuum sputtered gold was applied to the end surfaces of the samples as the electrodes. All the [001] oriented samples were poled by applying an 5 kV∕cm dc electric field at room temperature. The temperature dependence of the dielectric permittivity was determined using an LCR meter (HP4284A), being connected to a computer controlled temperature chamber. The electric-field-induced strain was measured using a linear variable differential transducer driven by an lock-in amplifier (Stanford Research system, Model SR830). For Rayleigh experiments, the maximum amplitude of electric field was selected to be 1 kV∕cm, smaller than the half of coercive field for PMN-PT crystals (about 2–3 kV∕cm).
EXPERIMENTAL RESULTS
Rayleigh analysis
For the case of the converse piezoelectric response, the Rayleigh law can be expressed using the following formulae:20
| (1) |
| (2) |
| (3) |
where S(E) is the electric-field-induced strain, and E0 is the level of applied electric field. The coefficient dinit describes the reversible piezoelectric response, including the intrinsic (lattice) and reversible internal interface motion. For ferroelectric materials, the latter contribution is relatively small.20, 21 Furthermore, there is no evidence that a linear, reversible internal interface motion, is present in domain engineered PMN-PT crystals. In the present investigation, therefore, the measured coefficient dinit was considered to arise from an intrinsic contribution. The coefficient α is the irreversible Rayleigh parameter, resulting from the irreversible motion of internal interfaces, and αE0 represents the extrinsic contribution to the total piezoelectric response. For convenience, dinit is defined as a nonunit coefficient and the unit of α is given as centimeter per kilovolt, as expressed in Eq. 3. Equation 1 describes the Rayleigh hysteresis, where the signs “+” and “−” correspond to decreasing and increasing electric field, respectively.
From the Rayleigh measurements, the total piezoelectric coefficient d33 was calculated from the peak to peak strain, Sp-p, measured for each excitation electric field (E0) as follows:
| (4) |
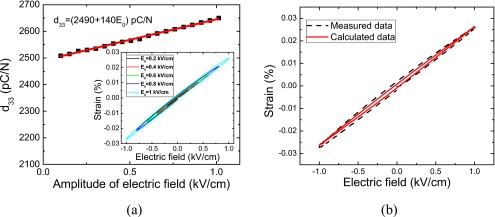
Figure 1 shows the ac field dependent d33(E0) for a [001] poled PMN-0.30PT crystal, where the inset presents the measured strain-versus-electric field behavior at various field levels. It can be observed that the piezoelectric coefficient d33 exhibits a linear behavior as a function of driving-field amplitude, demonstrating that the piezoelectric response can be described using the Rayleigh law. Consequently, by determination of the ac electric field dependence of the piezoelectric coefficient d33(E0), the Rayleigh parameters and associate errors could be obtained by fitting Eq. 3, as given in Fig. 1. The values of dinit and α were found to be on the order of 2500 cm∕kV and 140 cm∕kV, respectively, indicating that the extrinsic contribution to the piezoelectric response was less than 6%. From the obtained dinit and α, the S-E loop was calculated using Eq. 1, and given in Fig. 1b, showing a minor discrepancy to the measured behavior. This minor discrepancy may be due to the presence of other hysteretic mechanisms in piezoelectric response, such as a linear, hysteretic piezoelectric response.20
Figure 1.
(a) The ac electric field dependent piezoelectric coefficient d33 for PMN-0.30PT crystal at 1 Hz; (b) comparison between the measured and calculated strain-vs-electric field hysteresis loop.
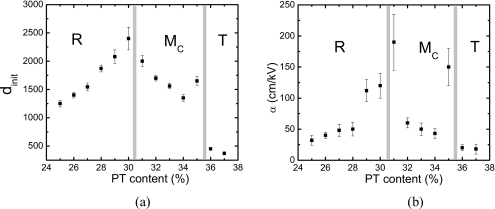
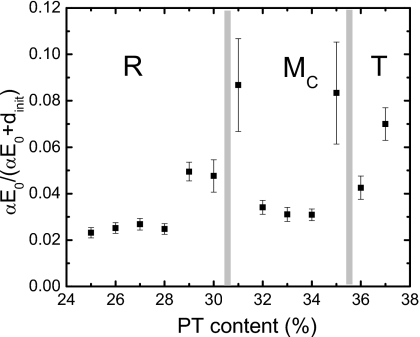
The Rayleigh-like behavior was observed for all [001] poled PMN−xPT crystals, with the compositional range of x=0.25–0.37. The Rayleigh parameters as a function of composition are given in Fig. 2, where the error bars were calculated from three samples for each composition. The rhombohedral (R), monoclinic (MC), and tetragonal (T) regions are marked accordingly, being determined by phase characterization measurements described in the following section. Both Rayleigh parameters, dinit and α, showed peak values around the R-MC and MC-T phase transition boundaries. For the PMN-0.30PT crystals, the maximum intrinsic piezoelectric response (∼2500 pC∕N) was 25% larger than that in PMN-0.31PT crystals, and almost twice the value as obtained in PMN-0.25PT crystals. The error bars for the parameter α, being related to the extrinsic contribution, were relatively high for compositions near phase boundaries, demonstrating that the extrinsic contribution in the compositions in proximity to the MPBs was not stable when compared to that of the compositions far away from the MPB. The ratio of extrinsic contribution to total piezoelectric response [αE0∕(αE0+dinit)] for PMN-PT crystals was also calculated and given in Fig. 3, where the ratios for PMN-0.31PT and PMN-0.35PT crystals were found to be on the order of 10%. The ratio was 7% for tetragonal PMN-0.37PT crystal, while it was less than 5% for all other compositions.
Figure 2.
Compositional dependence of Rayleigh parameters for (1−x)PMN−xPT crystals at 1 Hz.
Figure 3.
The level of extrinsic contribution to piezoelectric response at E0=1 kV∕cm for (1−x)PMN−xPT crystals with various compositions.
Composition and phase analysis in PMN-PT crystals
The composition and phase of the crystals were determined from dielectric permittivity-versus-temperature behavior and strain-versus-electric field loops. The Curie temperature Tc, temperature of maximum permittivity Tm and “depoling” or macrodomain to microdomain transition temperature Td of PMN-PT crystals are sensitive to the PT content. Based on the investigation of the relationship between the temperature Td and composition of (1−x)PMN−xPT crystals, the following equation was used to calculate x from Td:24
| (5) |
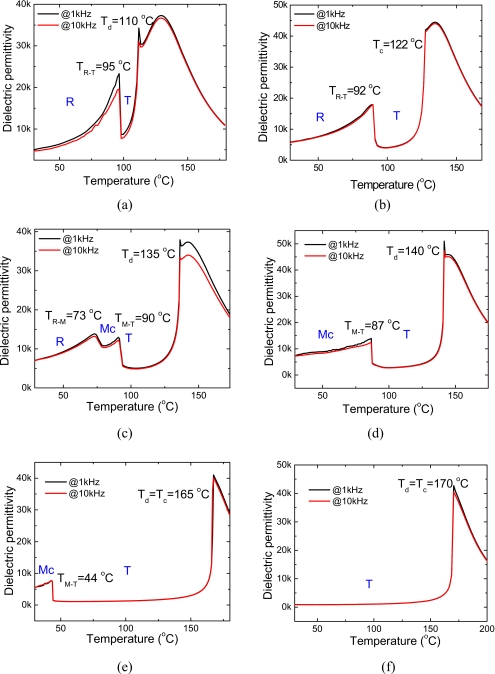
Figures 4a, 4b, 4c, 4d, 4e, 4f show the dielectric permittivity as a function of temperature for [001] poled PMN-0.26PT, PMN-0.28PT, PMN-0.30PT, PMN-0.31PT, PMN-0.35PT, and PMN-0.36PT crystals, respectively. In Figs. 4a, 4b, 4c, 4d, a dielectric “shoulder” (PMN-0.28PT) or dielectric anomaly (PMN-0.26PT, PMN-0.30PT, and PMN-0.31PT) was found at Td, while another dielectric peak was observed at yet higher temperatures, corresponding to Tm. With increasing PT content, the temperatures Td and Tm converged to a sharp phase transition, corresponding to the Curie temperature (Tc), as shown in Figs. 4e, 4f. For the PMN-0.26PT and PMN-0.28PT crystals, two phase transitions were observed, indicating the rhombohedral-tetragonal (TR-T) and tetragonal-cubic phase transitions, respectively. Three dielectric peaks were observed for the PMN-0.30PT. According to investigations of the temperature induced phase transition by x-ray diffraction25 and electric-field-induced-strain,26 these three dielectric peaks correspond to the phase transitions R-MC, MC-T, and T-C. Only one ferroelectric phase transition was observed prior to the Curie temperature for PMN-0.31PT and PMN-0.35PT crystals, demonstrating the [001] poled (1−x)PMN−xPT crystals (x:0.31–0.35) were in the monoclinic MC phase region at room temperature. It can also be observed that the phase transition temperature TM-T drastically decreased with increasing PT content in the MC region. For (1−x)PMN−xPT crystals with x≥0.36, no phase transition prior to the Curie temperature was observed, indicating these crystals located in the tetragonal phase region. Nearly temperature independent dielectric behavior was observed in [001] poled PMN-0.36PT crystals over the range from room temperature to 150 °C, as observed in other tetragonal relaxor-PT based crystals.27, 28
Figure 4.
The temperature dependence of dielectric permittivity for (1−x)PMN−xPT crystals. (a) PMN-0.26PT; (b) PMN-0.28PT; (c) PMN-0.30PT; (d) PMN-0.31PT; (e) PMN-0.35PT, and (f) PMN-0.36PT.
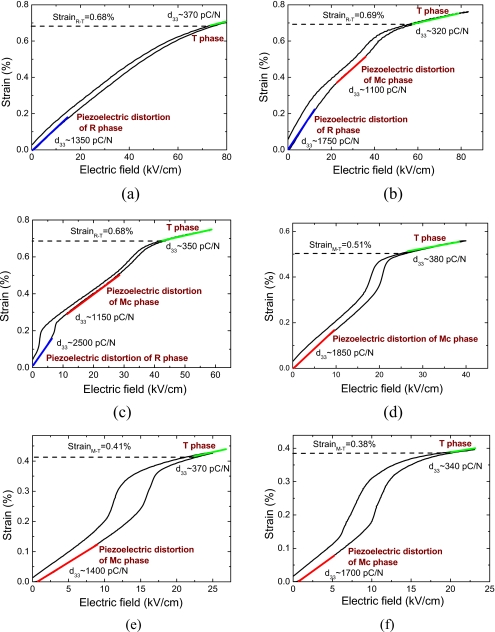
To complement the dielectric permittivity analysis, the electric-field-induced-strain behavior for [001] oriented PMN-PT crystals was investigated. As shown in Fig. 5, the transition from the rhomboheral to tetragonal phase was almost continuous and hysteresis-free in PMN-0.26PT, exhibiting similar behavior observed in PZN-0.045PT crystals.1 For PMN-0.28PT and PMN-0.30PT crystals, two discontinuous “jumps” were observed, whereas only one “jump” was observed in PMN-0.31PT, PMN-0.34PT, and PMN-0.35PT crystals. According to investigations of electric-field-induced phase transitions by high-energy x-ray-diffraction,29 the first “jump” observed in Figs. 5b, 5c is associated to a R-MC phase transition, while the second “jump” is related to the MC-T phase transition. The strain-versus-electric field loops of PMN-0.28PT and PMN-0.30PT crystals were repeatable, demonstrating the rhombohedral phase was stable at room temperature.
Figure 5.
Strain-vs-electric field for (1−x)PMN−xPT crystals measured at 1 Hz. (a) PMN-0.26PT; (b) PMN-0.28PT; (c) PMN-0.30PT; (d) PMN-0.31PT; (e) PMN-0.34PT; and (f) PMN-0.35PT.
From the results of the temperature dependent dielectric permittivity and electric-field-induced-strain measurements, the PMN-(0.25–0.30)PT crystals were confirmed to be in the rhombohedral phase region, while the principle phase in [001] poled PMN-(0.31–0.35)PT crystals at room temperature was the MC phase. Admittedly, metastable phases could also coexist, due to compositional nonuniformity and fluctuations.30 It was also observed that the variation in the field-induced-strain from rhombohedral to tetragonal phase was almost unchanged (SR-T∼0.68%) in the R phase region, whereas the variation in the field-induced-strain from MC to tetragonal phase was found to decrease from 0.51% to 0.38% with increasing x from 0.31 to 0.35, as shown in Figs. 5d, 5e, 5f. The above phenomenon could be explained by the theory “coexistence of morphotropic phases.”31 In this theory, the volume fraction of the majority MC phase decreased, while the volume fraction of tetragonal phase increased with increasing PT content in the MC region. Thus, the contribution to electric-field-induced-strain (MC→T) was found to decrease. However, this theory is based on the results determined from polycrystal powders.25 In the poled single crystals, the volume fraction of morphotropic phase(s) needs to be further investigated.
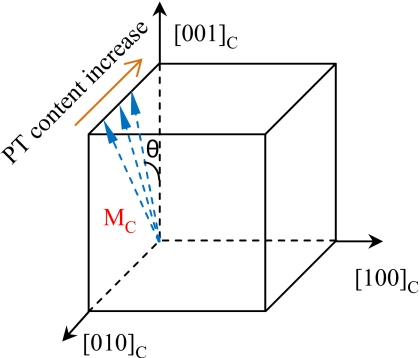
The variation in the level of induced strain from the MC to tetragonal phase for composition with x=0.31–0.35, could be also attributed to the variation in the MC phase. The monoclinic MC phase is recognized to be a bridge between rhombohedral and tetragonal phases, and the polar vector is constrained to lie within the cubic mirror plane (001).4, 26 Based on the strain-versus-electric field measurements, therefore, it was proposal that the polar vector of the MC phase rotated to the [001] direction as the composition approached the tetragonal phase, as depicted in Fig. 6. As the angle (θ), between the spontaneous polarization of the MC and tetragonal phases, decreased with increasing PT content, the contribution to the electric-field-induced-strain associated with MC→T phase transition was reduced.
Figure 6.
Schematic of the variation in spontaneous polarization with PT content for monoclinic PMN-PT crystals, where θ corresponds to the angle between the spontaneous polarization direction of MC phase and the [001] direction.
DISCUSSION
Based on the results presented, the intrinsic piezoelectric response is the major contribution to the ultrahigh piezoelectric activity in PMN-PT crystals, being larger than 90%, far more than those previous reports based on anisotropic calculations.6, 7 This discrepancy is believe to be the result of inaccurate single domain piezoelectric coefficients used for the anisotropic calculations, due to the instability of a single domain state in relaxor-based PMN-PT or PZN-PT crystals.32
In this section, the intrinsic contribution (dinit) is discussed as a function of composition and phase, in order to delineate the origin of ultrahigh piezoelectric activity in PMN-PT crystals. Extrinsic contributions, though small in domain engineered PMN-PT crystals, will be discussed and thought to be related to the contribution of morphotropic phase boundaries motion.
Compositional dependence of intrinsic piezoelectric response in the PMN-PT crystal system
The compositional dependence of the intrinsic contribution to the piezoelectric response in PMN-PT crystals was discussed in respective to rhombohedral, monoclinic, and tetragonal regions. In the R region, the intrinsic piezoelectric response along the [001] direction can be expressed according to the crystal anisotropy
| (6) |
where , , , and are single domain piezoelectric coefficients measured along principal crystallographic axes, and θ, the angle between the [111] and [001] axis, being 54.7°. From this equation, the high intrinsic piezoelectric response along the [001] direction is attributed to the high shear mode piezoelectric coefficient , which is significantly higher than other piezoelectric coefficients.7 According to the thermodynamic analysis, the shear piezoelectric coefficient can be expressed as8
| (7) |
where ε0 is the dielectric permittivity of vacuum, the spontaneous polarization of R phase, Qij the electrostrictive coefficients, and the transverse dielectric permittivity. The dielectric permittivity was enhanced as the composition approached the R-MC phase boundary, due to a dielectrically softening along the crystallographic directions perpendicular to the polarization direction.8, 9 As evident in Eq. 7, will be increased for compositions close to the R-MC phase boundary. Therefore, the observed dinit in the R region increased as the composition approached the R-MC phase boundary, and the maximum dinit (∼2500 pC∕N) was observed for rhombohedral PMN-0.30PT crystals, as shown in Fig. 2a.
For PMN−xPT crystals with x>0.3, the MC phase is the majority phase at room temperature, which was confirmed in Sec. 3B. For the [001] poled PMN-0.31PT crystals, the coefficient dinit was 2000, being 25% lower than that in PMN-0.30PT crystals. The coefficient dinit was decreased with increasing PT content in the MC region for PMN−xPT crystals from x=0.31 to 0.34, while the enhanced dinit was observed at x=0.35, with the composition extremely close to the MC-T phase boundary.
To analyze the observed variation in dinit in the MC region, the longitudinal piezoelectric coefficient of a single-domain MC phase along the [001] crystallographic direction was calculated from crystal anisotropy,8 as follows:
| (8) |
where , , and are the single domain piezoelectric coefficients measured along principal crystallographic axes in the MC phase, and θ is the angle between the spontaneous polarization of MC and the tetragonal phase, as depicted in Fig. 6. In Eq. 8, the piezoelectric coefficient is dominated by the first term, because the coefficient is much larger than both and . Analogous to the shear piezoelectric coefficient in the R phase, the shear coefficient would increase as the composition approached the MC-T phase boundary. This mechanism would lead to an increase in dinit with compositions close to the MC-T phase boundary (Mechanism I). However, the variation in the phase component with composition (described in Sec. 3B) would lead to a decrease in dinit, as the composition approached the MC-T phase boundary (Mechanism II). The both two cases, including mixed phases and pureMCphase at MC region, were considered and analyzed in the following:
-
(1)
For the case of mixed phases (MC and T), the volume fraction of tetragonal phase would increase with increasing PT content. Thus, the macro-coefficient dinit would decrease with increasing PT content, due to the relatively small piezoelectric response of the tetragonal phase along its spontaneous polarization [001] direction.
-
(2)
For the case of pure MC phase, according to the analysis in Sec. 3B (Fig. 6), the angle θ decreased with increasing PT content in the MC region. Therefore, the coefficient dinit would decrease as the composition approached the MC-T phase boundary, as a result of the decreasing of θ, which leads to a decrease in the first term of Eq. 8.
In summing, for composition with x=0.31–0.34, Mechanism II plays the dominant role, the coefficient dinit decreased with increasing PT content, as shown in Fig. 2a. On the other hand, for the compositions extremely close to the MC-T phase boundary, the shear coefficient greatly increased and Mechanism I dominated, which lead to a higher value of dinit in PMN-0.35PT.
For [001] poled tetragonal PMN-0.36PT and PMN-0.37PT crystals, low levels of intrinsic piezoelectric response, being less than 500 pC∕N, were found. This low level of intrinsic piezoelectric response can be attributed to the spontaneous polarization direction coinciding with that of the applied electric field, where no polarization rotation can occur. Consequently, the shear piezoelectric response cannot contribute to the longitudinal piezoelectric effect. It is worth noting that the value of d33 along the [011] direction was relatively high for tetragonal relaxor-PT crystals, being >1000 pC∕N, due to a polarization rotation process in “2T” domain engineered structures.33
Compositional dependence of extrinsic contribution in the PMN-PT crystal system
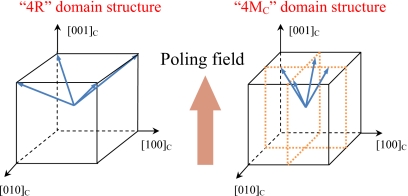
In [001] poled rhombohedral PMN-PT crystals, four different domains along [111], , , and direction are expected, forming an engineered domain configuration “4R,” where an extrinsic contribution cannot arise from domain wall motion due to the four energetically equivalent domains. As in the rhombohedral phase, an engineered domain structure “4MC” is expected to occur in [001] poled monoclinic (MC) PMN-PT crystals, as shown in Fig. 7. Therefore, the extrinsic contribution to the piezoelectric response in rhombohedral and monoclinic (MC) regions was relatively small when compared to ferroelectric polycrystalline ceramics (up to 40%),16 due to the lack of domain wall motion. The higher level of extrinsic contributions in compositions at the R-MC and MC-T phase boundaries, as presented in Fig. 2b at PT content=0.31 and 0.35, are a consequence of the motion of the phase boundaries. Phases at MPBs are energetically similar and easy to transform into the other energetically more favorable ferroelectric phase when electric∕stress field applied, subsequently contributing to the macro-piezoelectric response, which will be discussed below.
Figure 7.
Schematic of domain structure for [001] poled PMN-PT crystals with rhombohedral and monoclinic (MC) phases respectively, where the blue arrow represents the spontaneous polarization.
The phase stability under an electric field can be studied using free energy equation as following:
| (9) |
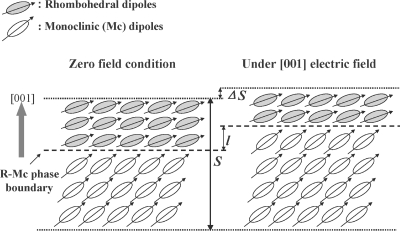
where U is the internal energy under zero field, E is the applied electric field and P is the spontaneous polarization, and θ is the angle between the direction of the applied electric field and spontaneous polarization. In Eq. 9, the lower free energy F corresponds to more stable ferroelectric phase. Therefore, the electric field induced R→MC phase transition can occur at the composition close to R-MC phase boundary, because the MC phase (θ<45°) is energetically more favorable than the rhombohedral phase (θ=54.7°), under an electric field along the [001] direction. This phase transition could contribute to a macropiezoelectric response, due to an accompanied strain with ferroelectric∕ferroelastic phase transition. As depicted in Fig. 8, the strain along the [001] direction will increase by ΔS∕S as a result of R-MC phase boundary motion when an [001] electric field is applied. Similarly, the MC→T phase transition could be easily induced when an electric field is applied along the [001] direction at the composition close to MC-T phase boundary. Therefore, the enhanced extrinsic piezoelectric activity around MPBs is believed to be associated with the motion of the phase boundary. For compositions close to MPB, an enhanced extrinsic contribution to dielectric response was also observed in relaxor based PZN-PT crystals.19
Figure 8.
Schematic of R-MC phase transition contribution to piezoelectric response, where l represents the displacement of R-MC phase boundary, ΔS∕S represents the induced strain through R-MC phase boundary motion.
In the tetragonal phase region, the coefficient α decreased to the lowest level, while the ratio, αE0∕(αE0+dinit), was greater when compared to the domain engineered rhombohedral and monoclinic PMN-PT crystals with composition far away from MPBs, indicating a large piezoelectric hysteresis in tetragonal PMN-PT crystals.20 For [001] poled tetragonal crystals, a single domain state was difficult to be obtained, especially for crystals with high c∕a ratio (c and a are lattice parameters), thus some 90° domain wall motion could contribute to the extrinsic contribution and induce piezoelectric hysteresis.
The role of monoclinic phase in ultrahigh piezoelectric response for relaxor-PT based crystal system
The monoclinic phase in high performance piezoelectric systems, including PZT, PMN-PT and PZN-PT, has received considerable attention.3, 4, 5, 25, 34, 35, 36 In PMN-PT systems, the MC phase has been observed by x-ray and neutron diffraction.25, 35 In this study, the R-MC phase transition with compositions between PMN-0.30PT and PMN-0.31PT was also inferred from both dielectric permittivity-versus-temperature and strain-versus-electric field behaviors.
The high piezoelectric response observed in domain engineered PMN-PT crystals can be explained by the high degree of piezoelectric anisotropy, which would increase as the composition approached ferroelectric-ferroelectric phase transition boundaries, due to the dielectrically softening along direction perpendicular to the polarization direction, enhancing η11 or η22.8 The peak values of piezoelectric response for domain engineered PMN-PT crystals were found to occur near the two MPBs (i.e., R-MC, MC-T), with the maximum piezoelectric coefficient d33 observed in rhombohedral PMN-0.30PT crystals.
Thus, to obtain ultrahigh piezoelectric response in PMN-PT crystals, two factors are critical. The first factor is a MPB, around which the shear piezoelectric response is enhanced due to a flattening of free energy profile.8, 9 The second one is an engineered domain configuration, such as “4R,” “4MC,” and “2T,” in which the applied electric field is away from the spontaneous polarization direction. As a consequence, the high shear piezoelectric response of single domain state can greatly contribute to the longitudinal piezoelectric response, a process of polarization rotation.
From the above discussion, the monoclinic phase (including MC, MA, and∕or O phase) was thought to play the role in formation of MPBs with R and∕or T phases, leading to the high piezoelectric response. As a result, the monoclinic phase does not directly contribute to the ultrahigh piezoelectric activity in rhombohedral PMN-0.30PT crystals (∼2500 pC∕N). It is worth noting that in PMN-PT crystals the maximum piezoelectric coefficient d33 was observed in the R phase near the R-MC phase boundary, rather than in the MC or T phase region. This phenomenon might be due to the higher piezoelectric anisotropy in R phase than that in MC (O) and∕or T phase.10, 33
CONCLUSION
The intrinsic (reversible) and extrinsic (irreversible) contributions to the piezoelectric activity in domain engineered PMN-PT crystals were explored as a function of composition and phase using Rayleigh analysis. The intrinsic contribution was found to play a dominant role in the high piezoelectric response of domain engineered PMN-PT crystals, being generally higher than 95% in total piezoelectric response. The maximum intrinsic piezoelectric response (∼2500 pC∕N) was found in PMN-0.30PT crystals, with the composition lying at the rhombohedral side of the R-MC phase boundary. The origin of this ultrahigh piezoelectric response can be explained by the high shear piezoelectric response, corresponding to an easy polarization rotation, for compositions close to MPB. The role of monoclinic phase (MC) is thought to form MPBs with R and∕or T phases, which is not a direct contributor to the ultrahigh piezoelectric activity in domain engineered PMN-0.30PT crystals. The extrinsic contribution to piezoelectric response for [001] poled PMN-PT crystals was quite small, due to a stable domain engineered configurations. A slight increase in extrinsic contribution was found at compositions close to the R-MC and MC-T phase boundaries, owing to an increased motion of the phase boundaries, but still less than 10% of the total piezoelectric response.
ACKNOWLEDGMENTS
The author (F. Li) wants to thank the support from China Scholarship Council. The authors from Xi’an Jiaotong University acknowledged the National basic research program of China under Grant No. 2009CB623306, International science & technology cooperation program of China under Grant No. 2010DFR50480, the National Natural Science Foundation of China under Grant Nos. 50632030 and 10976022. The work supported by NIH under Grant No. P41-EB21820 and ONR under Grant Nos. N00014-09-1-01456 and N-00014-07-C-0858.
References
- Park S. -E. and Shrout T. R., J. Appl. Phys. 82, 1804 (1997). 10.1063/1.365983 [DOI] [Google Scholar]
- Park S. E. and Shrout T. R., Mater. Res. Innovations 1, 20 (1997). 10.1007/s100190050014 [DOI] [Google Scholar]
- Fu H. and Cohen R. E., Nature (London) 403, 281 (2000). 10.1038/35002022 [DOI] [PubMed] [Google Scholar]
- Noheda B., Curr. Opin. Solid State Mater. Sci. 6, 27 (2002). 10.1016/S1359-0286(02)00015-3 [DOI] [Google Scholar]
- Bellaiche L., Garcia A., and Vanderbilt D., Phys. Rev. B 64, 060103 (2001). 10.1103/PhysRevB.64.060103 [DOI] [Google Scholar]
- Damjanovic D., Budimir M., Davis M., and Setter N., Appl. Phys. Lett. 83, 527 (2003). 10.1063/1.1592880 [DOI] [Google Scholar]
- Zhang R., Jiang B., and Cao W., Appl. Phys. Lett. 82, 3737 (2003). 10.1063/1.1576510 [DOI] [Google Scholar]
- Budimir M., Damjanovic D., and Setter N., J. Appl. Phys. 94, 6753 (2003). 10.1063/1.1625080 [DOI] [Google Scholar]
- Budimir M., Damjanovic D., and Setter N., Phys. Rev. B 72, 064107 (2005). 10.1103/PhysRevB.72.064107 [DOI] [Google Scholar]
- Davis M., Budimir M., Damjanovic D., and Setter N., J. Appl. Phys. 101, 054112 (2007). 10.1063/1.2653925 [DOI] [Google Scholar]
- Kisi E. H., Piltz R. O., Forrester J. S., and Howard C. J., J. Phys.: Condens. Matter 15, 3631 (2003). 10.1088/0953-8984/15/21/311 [DOI] [Google Scholar]
- Jin Y. M., Wang Y. U., Khachaturyan A. G., Li J. F., and Viehland D., Phys. Rev. Lett. 91, 197601 (2003). 10.1103/PhysRevLett.91.197601 [DOI] [PubMed] [Google Scholar]
- Wang Y. U., Phys. Rev. B 73, 014113 (2006). 10.1103/PhysRevB.73.014113 [DOI] [Google Scholar]
- Wada S., Yako K., Kakemoto H., and Tsurumi T., J. Appl. Phys. 98, 014109 (2005). 10.1063/1.1957130 [DOI] [Google Scholar]
- Damjanovic D., Phys. Rev. B 55, R649 (1997). 10.1103/PhysRevB.55.R649 [DOI] [Google Scholar]
- Damjanovic D. and Demartin M., J. Phys.: Condens. Matter 9, 4943 (1997). 10.1088/0953-8984/9/23/018 [DOI] [Google Scholar]
- Davis M., Damjanovic D., and Setter N., J. Appl. Phys. 95, 5679 (2004). 10.1063/1.1703829 [DOI] [Google Scholar]
- Eitel R. and Randall C. A., Phys. Rev. B 75, 094106 (2007). 10.1103/PhysRevB.75.094106 [DOI] [Google Scholar]
- Bernal A., Zhang S. J., and Bassiri-Gharb N., Appl. Phys. Lett. 95, 142911 (2009). 10.1063/1.3245316 [DOI] [Google Scholar]
- Damjanvoic D., The Science of Hysteresis (Elsevier, New York, 2005), Vol. 3, p. 337. [Google Scholar]
- Davis M., Damjanovic D., and Setter N., J. Appl. Phys. 100, 084103 (2006). 10.1063/1.2358408 [DOI] [Google Scholar]
- Tian J., Han P., and Payne D. A., IEEE Trans. Ultrason. Ferroelectr. Freq. Control 54, 1895 (2007). 10.1109/TUFFC.2007.474 [DOI] [PubMed] [Google Scholar]
- Zhang S. J., Luo J., Hackenberger W., and Shrout T. R., J. Appl. Phys. 104, 064106 (2008). 10.1063/1.2978333 [DOI] [PMC free article] [PubMed] [Google Scholar]
- Davis M., Ph.D. thesis, Swiss Federal Institute of Technology-EPFL, 2006. [Google Scholar]
- Noheda B., Cox D. E., Shirane G., Gao J., and Ye Z. -G., Phys. Rev. B 66, 054104 (2002). 10.1103/PhysRevB.66.054104 [DOI] [Google Scholar]
- Davis M., Damjanovic D., and Stter N., Phys. Rev. B 73, 014115 (2006). 10.1103/PhysRevB.73.014115 [DOI] [Google Scholar]
- Zhang S. J., Lebrun L., Randall C. A., and Shrout T. R., Phys. Status Solidi A 202, 151 (2005). 10.1002/pssa.200406900 [DOI] [Google Scholar]
- Li F., Zhang S. J., Xu Z., Wei X., Luo J., and Shrout T. R., J. Appl. Phys. 107, 054107 (2010). 10.1063/1.3331407 [DOI] [PMC free article] [PubMed] [Google Scholar]
- Noheda B., Zhong Z., Cox D. E., Shirane G., Park S. E., and Rehrig P., Phys. Rev. B 65, 224101 (2002). 10.1103/PhysRevB.65.224101 [DOI] [Google Scholar]
- Kakegawa K., Mohri J., Takahashi T., Yamamura H., and Shirasaki S., Solid State Commun. 24, 769 (1977). 10.1016/0038-1098(77)91186-3 [DOI] [Google Scholar]
- Topolov V. Y. and Ye Z. -G., Phys. Rev. B 70, 094113 (2004). 10.1103/PhysRevB.70.094113 [DOI] [Google Scholar]
- Zhang S. J., Sherlock N. P., R. J.Meyer, Jr., and Shrout T. R., Appl. Phys. Lett. 94, 162906 (2009). 10.1063/1.3125431 [DOI] [PMC free article] [PubMed] [Google Scholar]
- Li F., Zhang S. J., Xu Z., Wei X., Luo J., and Shrout T. R., “Investigation of electromechanical properties and related temperature characteristics in domain-engineered tetragonal Pb(In1/2Nb1/2)O3-Pb(Mg1/3Nb2/3)O3-PbTiO3 crystals,” J. Am. Ceram. Soc. (in press).
- Davis M., J. Electroceram. 19, 25 (2007). 10.1007/s10832-007-9046-1 [DOI] [Google Scholar]
- Singh A. K., Pandey D., and Zaharko O., Phys. Rev. B 74, 024101 (2006). 10.1103/PhysRevB.74.024101 [DOI] [Google Scholar]
- Ye Z. G., Noheda B., Dong M., Cox D., and Shirane G., Phys. Rev. B 64, 184114 (2001). 10.1103/PhysRevB.64.184114 [DOI] [Google Scholar]


