Abstract
A toolkit (BEUDcal) has been developed for evaluating the effectiveness and for predicting the outcome of treatment plans by calculating the biologically effective uniform dose (BEUD) and complication-free tumor control probability. The input for the BEUDcal is the differential dose-volume histograms of organs exported from the treatment planning system. A clinical database is built for the dose-response parameters of different tumors and normal tissues. Dose-response probabilities of all the examined organs are illustrated together with the corresponding BEUDs and the P+ values. Furthermore, BEUDcal is able to generate a report that simultaneously presents the radiobiological evaluation together with the physical dose indices, showing the complementary relation between the physical and radiobiological treatment plan analysis performed by BEUDcal. Comparisons between treatment plans for helical tomotherapy and multileaf collimator-based intensity modulated radiotherapy of a lung patient were demonstrated to show the versatility of BEUDcal in the assessment and report of dose-response relations.
Keywords: Biologically effective uniform dose, helical tomotherapy, treatment planning, radiobiological objectives
1. Introduction
In modern radiation therapy, physical dose indices, such as mean dose, dose volume histogram (DVH), and isodose distribution charts are often used for treatment plan evaluation. When reviewing those physical dose indices, the resulting biological objectives such as tumor control rate and normal tissue complication probability have to be indirectly estimated based on clinical experience and knowledge. In some competing plans, it is possible that similar mean dose, maximum dose or minimum dose might have significantly different radiobiological outcomes. In order to facilitate the direct and accurate intercomparison and ranking of treatment plans, radiobiological models for treatment plan evaluation have been introduced [1-4]. These radiobiological models are based on the fact that the radiosensitivity of different organs should be taken into account precisely [5]. As a result, the physical dose delivered to an organ would be directly associated with the dose-response probability of inducing complications in normal tissues or tumor control.
Different models of cell kill (linear and linear-quadratic) and statistics (Poisson and binominal) have been employed [6-9] to predict the biological response. The biologically effective uniform dose (BEUD), which is implemented in our program, is defined as the uniform dose that causes the same tumor control probability or normal tissue complication rate as the delivered dose distribution [4]. The reasons that BEUD is an improvement over other biological concepts are twofold. The BEUD can be applied to compare treatment plans that have more than one target and/or normal tissues. Furthermore, BEUD provides a common dose prescription base. The complication-free tumor control rate (denoted as P+), is also applied in the assessment of treatment plans. The P+ is derived from the probability of benefit (PB), which is the overall tumor control probability of a treatment plan, and the probability of injury (PI), which is the overall normal tissue complication rate.
More and more theoretical studies and accumulated clinical data suggest that the treatment outcome will be substantially improved by employing biological measures in treatment planning [10-13]. Surrogates for long-term disease-free survival (ex. P+) would consequently expedite our capability to obtain useful information about the biological effectiveness of alternate and refined radiation treatments. Motivated by the need of comprehensive analysis on a dose plan through simultaneous presentation of physical and biological evaluations, a toolkit of BEUD calculation (BEUDcal) was developed. Using as input the dose distribution in the subunits of tumor and normal tissues together with the values of dose-response parameters from a clinical database, BEUDcal is easy to use for reporting and comparing different dose plans during treatment planning in a user-friendly interface.
2. Computational methods and theory
The graphic user interface (GUI) of the BEUDcal was developed to facilitate the calculation of the biological effective uniform dose. The interface was constructed using the Matlab 7.5 (The MathWork Inc., Natick, MA, 01760, USA). The definition of the biological effective uniform dose (BEUD) is the uniform dose that causes exactly the same tumor control probability or normal tissue complication rate as the real dose distribution in the tumor(s) or normal tissues [3]. The general expression of BEUD is denoted as the equation below:
| (1) |
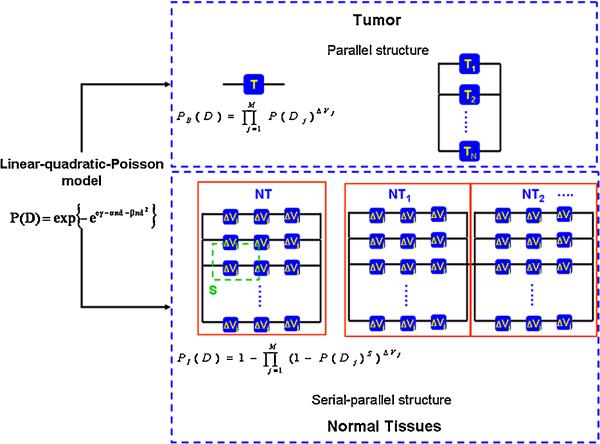
where represents the real dose distribution. In order to derive the BEUD, the radiobiological model that describes the dose-response relationship of the tumor and normal tissues, needs to be defined first. Following that, the tumor organization has to be set and thus the probability of benefit (PB) for tumor control can be described. At the same time, the infrastructure for normal tissues needs to be identified, so that the probability of normal tissue injury (PI) can be estimated. The estimated response probability (either PB or PI) for a single organ can be applied to composite cases where more than one targets and normal tissues are involved. Figure 1 illustrates the organization of the structures defined in this program for the tumor (T) and the normal tissues (NT). For a single organ (either a tumor or a normal tissue), the probability of benefit (PB), which is the tumor control rate, and the probability of injury (PI), which is the normal tissue complication rate are also described in this figure.
Figure 1.
Schematic definition of tissue organization for tumors and normal tissues. The tumors are defined as the parallel structure of subunits, whereas normal tissues are considered as serial-parallel organizations. For cases that have more than one tumor involved in the calculation of the response probability, the overall probability of benefit, PB, is described by equation (4). The overall probability of injury, PI, for all normal tissues is defined by the equation (6).
2.1 Dose response relationship
The linear–quadratic model was applied in this software to describe the dose-response relationship for tumors and normal tissues. The dose-response parameters that account for the fractionation effects are α and β, which express the linear and quadratic parts of the cell surviving curve, respectively. In addition to α and β, N0 is the initial number of clonogenic cells for tumors or the initial number of functional subunits for healthy tissues [14]. In clinical practice, however, the dose that causes a response probability of 50%, D50, and the maximum normalized value of the dose-response gradient, γ, are the most important observable parameters and consequently they are more common in the literature. The values of α and β for each organ can be calculated from the corresponding values of D50, γ plus the α/β ratio that is specified for each organ [4]. According to the linear-quadratic model for cell killing statistics, the probability of controlling a tumor or inducing a certain injury to a normal tissue that is irradiated uniformly with a dose D, P(D), is estimated using the linear-quadratic-Poisson model. The general form of P(D) based on the linear-quadratic-Poisson model is expressed as:
| (2) |
where d is the dose per fraction and n is the number of fractions applied, resulting in D=nd [7,9]. The organization as well as the dose-response probability of tumors and normal tissues are described in the following two sections.
2.2 Benefit: tumor control probability, PB
As illustrated in figure 1, the internal structure of tumors is considered to have a parallel organization, which is associated with a strong volume dependence [5]. The organ that has a parallel infrastructure can maintain its function even when a large portion of its subunits is damaged. Since the radiobiological endpoint of tumor control is to eradicate all the clonogens, in the case where more than one targets are present, a parallel organization is also assumed. Taking this assumption into account and applying the linear-quadratic-Poisson model (equation (2)), the probability of benefit, PB, for overall tumor control can be described by the equation:
| (3) |
where PB(Dj) is the probability of benefit to control the tumor having a volume equal to the
reference volume and be irradiated to dose Dj
Δvj is the relative subvolume of the tumor receiving dose Dj
Mi is the number of subvolumes in the tumor i
N is the total number of tumors.
In BEUDcal, the dose distribution is exported from the treatment planning system (TPS). TPS usually divides tumors and normal tissues into numbers of voxels (in 3D image volume) with equal size of subvolume. Therefore, the Δvj in equation (3) can be substituted by 1/M since M is the total number of voxels to which a tumor is divided. Then, the equation of the PB becomes:
| (4) |
From equation (4), the radiobiological parameters that are needed in order to calculate the probability of benefit are the D50, γ, α/β (for calculation of α and β), plus the M, N and Dj that is from dose volume histograms (DVHs) exported from the TPS.
2.3 Injury: normal tissue complication probability, PI
The organization of a normal tissue is deemed as a parallel structure of serially aligned subunits as demonstrated in figure 1 [7]. However, when several normal tissues are involved, which is typical in clinical cases, the overall risk for normal tissue complications depends on the response probability of each tissue. Because fatal deficient would be induced if one critical organ is fatally damaged, a common assumption is to define that all the critical normal tissues are serially organized [9]. The overall probability of injury, PI, for N normal tissue can be express as:
| (5) |
where PI(Dj) is the probability of injury for a normal tissue having a volume equal to the
reference volume and be irradiated to dose Dj
sj is the relative seriality parameter that characterizes the structural organization of the given normal tissue i
Δvj is the relative subvolume of the tissue receiving dose Dj
M is the number of subvolumes in the tissue
N is the total number of organs at risk.
Substituting Δvj with 1/M where the total number of M voxels are divided in each organ and by applying the linear-quadratic-Poisson model to the PI(Dj), equation (5) becomes:
| (6) |
From equation (6), the radiobiological parameters that are needed in order to calculate the probability of injury are the D50, γ, α/β that are available from the radiobiological database, plus the M, N and Dj, which are available from the TPS.
After the calculation of the PB and PI, the BEUD can be solved numerically from both the probabilities of benefit and injury. As a result, BEUDb is the biologically effective uniform dose, which is calculated based on the radiological characteristics of the target and it is associated with the clinical benefit. BEUDi is the biologically effective uniform dose, which is calculated based on the radiological characteristics of the examined normal tissues and it is associated with the radiation induced injury [4]. Furthermore, from the PB and PI, the probability of achieving the complication-free tumor control, P+, can be derived from:
| (7) |
with the assumption that the PB and PI are statistically totally correlated [7].
3. Program description
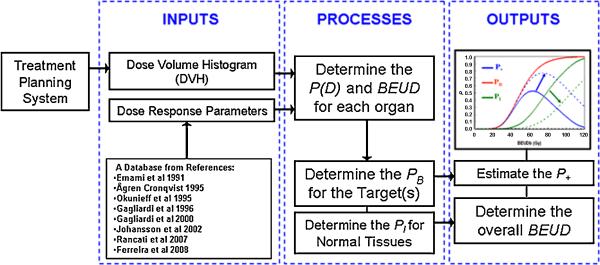
The calculation flow of BEUDcal is depicted in figure 2. The inputs for the calculation of BEUD include the DVHs exported from the TPS and the dose-response parameters from the clinical database [15-22]. In the Input tab of this program, the user will first put in the comparing modalities (eq. Tomotherapy plan cp. MLC-based IMRT plan). Exported differential DVHs from either the Pinnacle treatment planning system (ADAC Laboratories, Milpitas, CA) or Hi-Art TomoTherapy system (TomoTherapy Inc., Madison, WI) can be read and automatically reformatted into a data file (*.dat file). For exported DVH files from other treatment planning systems, users can also generate a formatted-data file and introduce it into BEUDcal for the BEUD calculation. The next step of input is to enter the dose-response parameters for the different organs. When clicking dose-response parameters in the Input tab, an interactive panel will open up with help messages, guiding the users to select the corresponding parameters of the examined organs from the built-in database of this program. Table1 lists this database of dose-response parameters that are integrated in this program. For both tumors and normal tissues, users can also manually put in dose-response parameters based on different references of clinical data by selecting “other” in the built-in list. After inputting both DVHs and dose-response parameters, the BEUD calculation will proceed to the determination of the P(D) values for each organ using the equations indicated in figure 1. Following the P(D) estimation of the individual organs, the BEUD for each organ can be numerically solved. Then, the overall PB and PI values can be calculated by the equations (4) and (6), respectively. Two figures will be graphed from this program. One figure shows the cumulative DVHs of the different organs, indicating the physical indices reviewed in clinic for plan evaluation, and the calculation of P(D) for all the organs, specifying the biological results assessed from the physical doses. The second figure illustrates the overall BEUD (including BEUDb and BEUDi) and P+ calculated from equation (7).
Figure 2.
The flow chart of BEUD calculation implemented in the BEUDcal program.
Table 1.
Database of dose–response parameters as input in the linear-quadratic-Poisson and relative seriality models. D50 is the dose that causes 50% response probability, γ is the maximum normalized value of the dose–response gradient and s is the relative seriality, which characterizes the volume dependence of the normal tissue. The α/β ratio describes the shoulder of the cell survival curve.
| D50 (Gy) | γ | α/β | |
|---|---|---|---|
| Targets | |||
| Breast-CTV | 42.0 | 3.00 | 10.0 |
| Breast-ITV | 40.0 | 3.00 | 10.0 |
| Breast-LN | 82.0 | 2.80 | 10.0 |
| Cervix | 80.0 | 4.00 | 10.0 |
| Head and neck | 52.8 | 2.30 | 10.0 |
| Lung | 49.2 | 1.0 | 10.0 |
| Lymph nodes | 55.0 | 3.00 | 10.0 |
| Pancreas | 55.0 | 4.00 | 10.0 |
| Prostate | 80.0 | 4.00 | 10.0 |
| Seminal vesicles | 55.0 | 3.00 | 10.0 |
| Other | – | – | 10.0 |
| D50 (Gy) | γ | α/β | s | |
|---|---|---|---|---|
| Normal tissues | ||||
| Bladder | 80.0 | 4.00 | 3.0 | 0.300 |
| Cricopharyngeus | 68.4 | 6.55 | 3.0 | 0.220 |
| Esophagus | 68.0 | 2.80 | 3.0 | 3.400 |
| Heart | 70.7 | 0.96 | 3.0 | 1.000 |
| Healthy breasts | 30.0 | 5.00 | 3.0 | 0.200 |
| Healthy lungs | 30.1 | 0.97 | 3.0 | 0.010 |
| Kidney | 28.2 | 2.60 | 3.0 | 0.004 |
| Liver | 39.2 | 2.60 | 3.0 | 0.170 |
| Parotid gland | 39.0 | 0.87 | 3.0 | 1.000 |
| Rectum | 80.0 | 2.20 | 3.0 | 0.700 |
| Small bowel | 62.0 | 2.10 | 3.0 | 0.140 |
| Spinal cord | 57.0 | 6.70 | 3.0 | 1.000 |
| Stomach | 65.0 | 2.60 | 3.0 | 1.000 |
| Other | – | – | 3.0 | 1.000 |
4. Samples of typical program runs
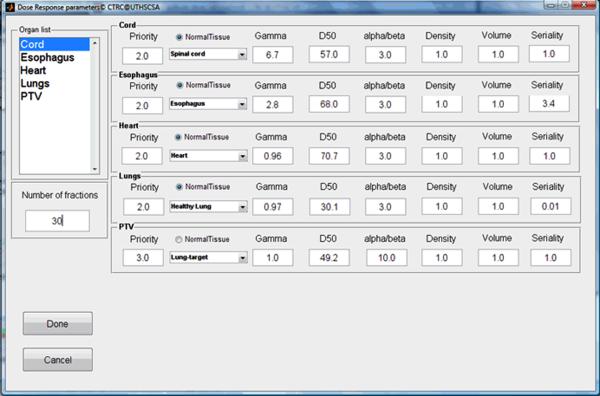
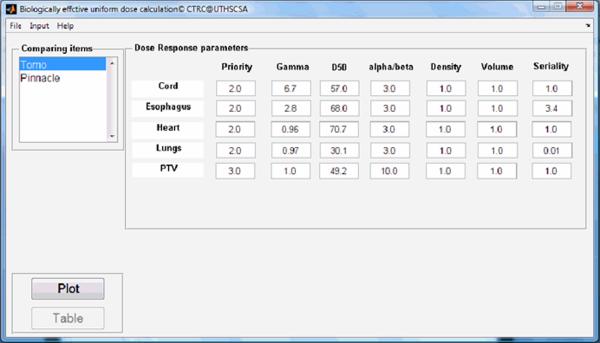
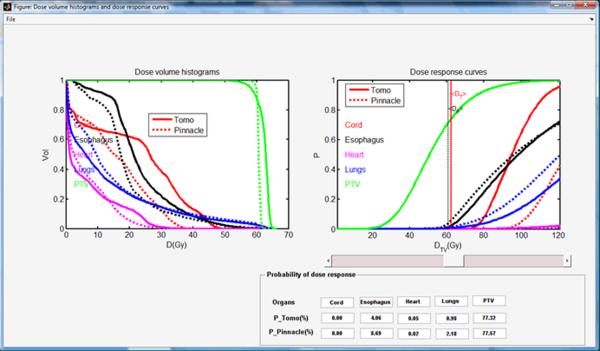
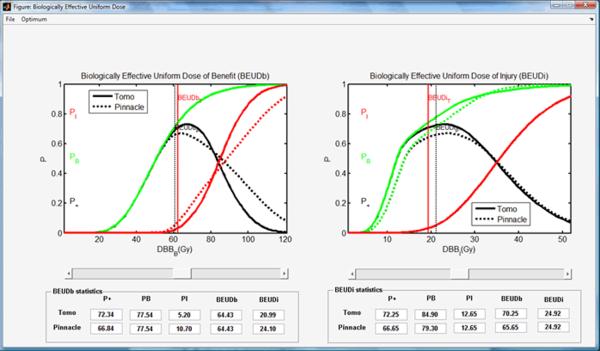
A lung cancer case was selected to demonstrate the different phases of typical program runs using the BEUDcal. For this lung cancer patient, a tomotherapy plan (denoted as Tomo in the figures) was compared to a MLC-based IMRT plan (denoted as Pinnacle in the figures), which was generated from the Pinnacle treatment planning station. Figure 3 shows the interactive panel for inputs of dose-response parameters. On the upper left corner, there is an organ list, indicating the organs included in the entered data file (*.dat) containing DVHs of those organs. By selecting the organs from the pull-down menu in this panel, the dose-response parameters are filled in automatically. The gamma and alpha/beta parameters indicated in this input panel of dose-response parameters are the same as the γ and α/β, respectively, denoted in equations (2-6). By clicking the button ‘Done’ in the input panel of dose-response parameters, the main window of the BEUDcal shows up with the dose-response parameters listed in this interface (figure 4). The BEUD calculation, which produces the output of two illustrations can be enabled and generated by clicking the button ‘Plot’ in this main window. Figure 5 demonstrates the cumulative DVHs and dose-response curves of different organs. In the figure of dose-response curves, the vertical red-solid line specifies the mean dose (62.39 Gy) of the target in the tomotherapy plan (the first item in the list of comparing items); the vertical black-dashed line shows the mean dose (60.76 Gy) of the target in the MLC-based IMRT plan (the second item in the list of comparing items). The slider under the figure of dose-response curves allows users to review the response probability of each organ, which would dynamically be shown in the panel of “Probability of dose response” below the slider, for various examined dose levels. Figure 6 illustrates the results of BEUD calculation that were estimated in terms of both BEUDb and BEUDi. Because BEUDb is calculated based on the tumor characteristics, in the figure of BEUDb, the PB curves of these two plans would overlay with each other [4]. In this situation, users are able to choose the superior plan by selecting the plan that has higher P+, and lower PI. The same conditions can be applied to the figure of BEUDi. For the reason that BEUDi is assessed based on characteristics of normal tissues, the PI curves of two plans would be superimposed. Therefore, the plan that has higher P+ and higher PB is considered as the better plan. In this example of lung cancer case, the tomotherapy plan has the higher P+ with lower overall PI for a BEUD to the target of less than 85 Gy as compared to the MLC-based IMRT plan indicated in the BEUDb diagram. In the BEUDi figure, the tomotherapy plan is superior to the MLC-based IMRT plan because of the higher P+ and overall PB. The sliders under both diagrams enable users to evaluate the P+, PB and PI at different levels of BEUDs, which would dynamically be displayed in the panel of “BEUDb (or BEUDi) statistics” below the sliders. By reviewing the probabilities of tumor control without fatal complications at various levels of BEUDs, users are capable of selecting a new dose prescription (in terms of BEUD) for the treatment plans, which would achieve a higher P+ with an acceptable overall PI. Figure 7 shows the optimal values of P+, which is defined as the highest complication-free tumor control probability, for both plans that were compared in this example. The PB and PI, contributing to this optimal P+, are also listed in this “Optimal values” panel. Furthermore, the BEUDb and BEUDi of the PB and PI, respectively, and the P(D) values of the individual organs are demonstrated to provide the numerical overview of the dose response results at the optimal P+. From figure 7, the optimal P+ of the tomotherapy plan is 72.96%with an overall PB of 80.86% and an overall PI, of 7.90%. At the optimal P+ of the tomotherapy plan, the P(D) to the PTV, healthy lungs, heart, esophagus, and cord are 80.86%, 1.27%, 0.07%, 6.66% and ~0.00%, respectively. The optimal P+ of the MLC-based IMRT plan is 66.90% with an overall PB of 76.92% and an overall PI, of 10.03%. At the optimal P+ of the MLC-based IMRT plan, the P(D) to the PTV, healthy lungs, heart, esophagus, and cord are 76.92%, 2.09%, 0.02%, 8.09% and ~0.00%, respectively. In other words, the tomotherapy plan gives a higher probability of tumor control and at the same time it offers a better normal tissue sparing with a lower probability of normal tissue injury.
Figure 3.
The input panel of dose-response parameters with built-in database. Gamma and alpha/beta in this panel are the same as γ and α/β, respectively, denoted in equations (2-6). By selecting the organ from the pull-down menu, the dose-response parameters are filled in automatically.
Figure 4.
The main window of the BEUDcal after inputting the dose-response parameters of the organs included in the data file of DVHs exported from the treatment planning system.
Figure 5.
Cumulative dose volume histograms (left) and dose- response curves (right) of all the organs.
Figure 6.
Plots of the overall response probabilities PB, PI and P+ using the BEUDb (left) and BEUDi (right) for scaling the dose prescription levels of the treatment plans.
Figure 7.
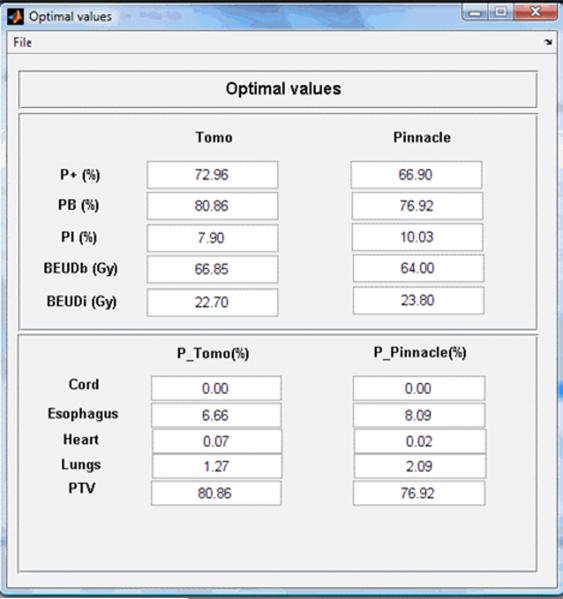
The optimal P+ of two comparing items, and the overall PB and PI. The BEUDb and BEUDi for the tumors and normal tissues are also listed with the dose-response probabilities (P(D)) of all the organs contained in the input data file of DVHs.
After the BEUD calculation, BEUDcal is also capable of generating the final report of the plan comparison between the different treatment plans. Table 2 lists the output of the comparisons between the treatment plans of tomotherapy and MLC-based IMRT in this example of BEUDcal run. This report states the radiobiology information of P(D) and BEUD for all the organs in addition to the physical dose statistics of mean dose (D̄), standard deviation (SD), maximum dose (Dmax), and minimum dose (Dmin). The overall P+, PB and PI as well as BEUDs that were calculated for the input tomotherapy and MLC-based IMRT treatment plans (shown in the column of “Clinical”) are also included in this table. The optimal biological goal listed in the “Optimal values” panel (shown in the column of “Optimal”) is also integrated in the output report for both treatment plans. The simultaneous presentation of the radiobiological evaluation together with the physical dose indices in this output report shows the complementary relation between the physical dose distribution and the radiobiological evaluation analyzed by the BEUDcal program.
Table 2.
An example of final report generated by BEUDcal. This report summarized the radiobiology information of P(D) and BEUD for all the organs in addition to the physical dose statistics of mean dose (D̄), standard deviation (SD), maximum dose (Dmax), and minimum dose (Dmin). Moreover, the biological indices, P+, PB and PI and BEUD, of both plans were also listed. The “Clinical” column indicated the biological effect calculated based on the prescribed doses delivered in the treatment plans. The “Optimal” column showed the highest P+ achievable based on the input dose distributions.
| Organs | P_Tomo (%) | P_Pinnacle (%) | BEUD_Tomo (Gy) | BEUD_Pinnacle (Gy) | D_Tomo (Gy) | D_Pinnacle (Gy) | SD_Tomo (Gy) | SD_Pinnacle (Gy) | Dmax_Tomo (Gy) | Dmax_Pinnacle (Gy) | Dmin_Tomo (Gy) | Dmin_Pinnacle (Gy) |
|---|---|---|---|---|---|---|---|---|---|---|---|---|
| Cord | 0.00 | 0.00 | 48.80 | 48.50 | 22.26 | 15.72 | 1.5.98 | 11.2.3 | 49.33 | 40.05 | 0.33 | 0.33 |
| Esophagus | 2.46 | 4.04 | 55.45 | 56.35 | 23.53 | 19.34 | 10.72 | 10.81 | 61.33 | 61.75 | 2.00 | 2.34 |
| Heart | 0.04 | 0.02 | 18.60 | 15.40 | 6.46 | 6.47 | 8.73 | 7.04 | 38.33 | 34.04 | 0.33 | 0.33 |
| Lungs | 0.80 | 1.50 | 15.20 | 16.95 | 12.79 | 14.67 | 15.97 | 15.79 | 66.00 | 62.41 | 0.33 | 0.33 |
| PTV | 74.15 | 71.66 | 62.25 | 60.80 | 62.39 | 60.76 | 109 | 0.57 | 66.00 | 64.00 | 46.00 | 46.00 |
| Modality | Tomo | Pinnacle | ||||||||||
|---|---|---|---|---|---|---|---|---|---|---|---|---|
| Dose Prescription | Clinical | Optimal | Clinical | Optimal | ||||||||
| P+(%) | 70.87 | 72.96 | 66.16 | 66.90 | ||||||||
| PB(%) | 74.15 | 80.86 | 71.66 | 76.92 | ||||||||
| Pl(%) | 3.28 | 7.90 | 5.50 | 10.03 | ||||||||
| BEUD_b(Gy) | 62.25 | 66.85 | 60.80 | 64.00 | ||||||||
| BEUD_i(Gy) | 19.30 | 22.70 | 21.20 | 23.80 |
5. Hardware and software specifications
Performance has been tested on the PC with Matlab 7.5 version or latter installed under Windows XP or Vista. The processor is dual-core AMD Turion Mobile Technology TL 64 (2.2 GHz) and the memory (RAM) is 2 GB. Run times for the comparison between two modalities are approximately 30-60 sec and an additional 40-60 sec for the generation of output tables depending on the system performance.
6. Mode of availability of the program
The tool is available as a Matlab-based software package upon request from the authors via the electronic mail.
7. Discussion
BEUDcal is able to comprehensively report physical dose delivery, but more importantly, it facilitates the analysis of dose-response relations, which links radiation dose to the clinical effect (i.e. P+, and combination of PB and PI). The GUI of BEUDcal provides a friendly interface to implement the BEUD calculation by simply inputting the differential DVHs of the different tissues exported from TPS. The BEUD evaluation has been successfully applied to compare the differences between planned and delivered IMRT dose distributions [23]. Moreover, previous studies have utilized BEUD on plan comparisons between helical tomotherapy and MLC-based IMRT for brain, cranio-spinal, head-and-neck, lung and prostate tumors [24, 25]. Preceding researches have proven that plan assessments using the radiobiological measures P+ and BEUD, provide a closer association of the delivered treatment with the clinical outcome by taking into account the dose-response relations of the irradiated tumors and normal tissues. By taking into consideration the clinical outcome in terms of P+ estimated from the BEUDcal, radiobiological adaptive radiation therapy can be fulfilled directly based on the optimal PB and acceptable PI instead of physical dose statistics.
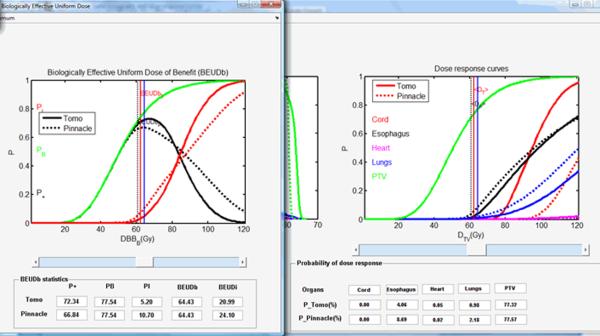
The “Optimal values” panel shows the highest P+ for each treatment plan. The PB and PI are also derived based on the highest P+ indicated in this panel. The original definition of P+ does not use different weights for the targets and organs at risk as well as different weights for the different normal tissues. From equation (7), the P+ index finds the pure benefit from the treatment by subtracting the normal tissue complication probabilities from the tumor control probability. In clinical practice, there are not different weighting factors that are applied, but there are risk thresholds (usually 5-10%) for every organ at risk, which should not be exceeded. In the example of the lung cancer case, both overall PI of 7.90% and 10.03%, respectively, for the tomotherapy and the MLC-based IMRT plans are deemed as high. Instead, physicians usually set a clinical standard for the overall PI, which is usually at 5%. As a result, the BEUDcal offers an extra function to select the desired level of tumor control probability and/or normal tissue complication rate by using a function called “Cursor on.” The “Cursor on” function can be enabled by a right-mouse click on either the figure of BEUDb or BEUDi. When activating this “Cursor on” function, a cross cursor appears to enable users select a clinical cutoff level of PB and/or PI on the figure. After selecting the desired probability level, the values of the P+, PB, PI together with BEUDb and BEUDi are calculated accordingly, and displayed in the “BEUDb (or BEUDi) statistics” panel in the figure of BEUD (figure 6). Furthermore, the dose level in the “Probability of dose-response” panel in the figure of dose-response curves (right figure in figure 5) is synchronized with the selected dose in the BEUD figure. The dose-response probabilities of the different organs for both comparing items in the figure of dose-response curves are calculated simultaneously at the selected dose level defined by the users using the “Cursor on” function. Figure 8 demonstrates an example of using the “Cursor on” function on the BEUDb diagram. The blue lines in both figures indicate the selected dose level at 64.43 Gy. From figure 8, the overall P+, PB, and PI for the tomotherapy plan are 72.34%, 77.54% and 5.20%, respectively. For the MLC-based IMRT plan, the corresponding overall P+, PB and PI are 68.84%, 77.54% and 10.70%. The P+ of the tomotherapy plan at the selected dose level is higher, and the overall PI is at a clinically acceptable level of 5.2%. On the other hand, the MLC-based IMRT plan has a lower P+ mainly because of the higher PI of 10.7%. The right figure of the dose-response curves in figure 8 shows that the higher overall PI of the MLC-based IMRT plan results from the significantly higher P(D) of esophagus, i.e. 8.69% compared to that of 4.06% in the tomotherapy. The P(D) of the healthy lungs, i.e. 2.18%, in the MLC-based IMRT plan is also higher than that of 0.98% in the tomotherapy plan. With the assistance of the “Cursor on” function in the BEUD figure, users can point out the main reasons for this unacceptable higher PI of the MLC-based IMRT plan from the results that are calculated and shown by the synchronization of the dose level in the figures of BEUD and dose-response curves. Therefore, users are able to compare two treatment plans with awareness of not only the overall P+, PB, and PI, but also the individual P(D) of tumors and normal tissues.
Figure 8.
An example of the “Cursor on” function built in the figure of BEUD. By activating the “Cursor on” function, the dose in the figure of the dose-response curves (the right figure) is synchronized with the selected dose level (as demonstrated by the blue lines in both figures). The P(D) for all the organs is calculated and shown, respectively, in the “Probability of dose response” panel under the dose-response curves.
The linear-quadratic-Poisson model has two weak points, which might compromise the BEUD estimation using the BEUDcal. When the hypersensitivity effect takes place in the low dose range, the linear-quadratic-Poisson model of cell kill would fail. In other words, when evaluating the dose response to certain normal tissues, the low dose hypersensitivity effect is not accounted in the BEUD calculation. Another survival function that can deal with this problem should be implemented in this situation using the equation (8) [9]:
| (8) |
The other weak point of linear-quadratic-Poisson model is that Poisson statistics is not accurate at very low doses. Again, the Poisson statistics failure would affect the prediction of normal tissue complication. Instead, the binomial model described in equation (9) should be used to estimate the dose response in such cases:
| (9) |
where S(D) denotes the survival fraction at dose D, and N0 is the initial number of clonogenic cells for tumors or the initial number of functional subunits for healthy tissues.
One of the most important advantages of BEUD calculation is that the definition of the BEUD can be applied to any model to derive the corresponding BEUD values and subsequently produce the P(D) of the individual organs and overall P+, PB, and PI for plan reporting and comparison. The results and conclusions of this study are strongly dependent on the accuracy of the radiobiological models and the parameters describing the dose-response relation of the different tumors and normal tissues. However, it is known that all the existing models are based on certain assumptions or take into account only certain biological mechanisms. Furthermore, the determination of the model parameters expressing the effective radiosensitivity of the tissues is subject to uncertainties imposed by the inaccuracies in the patient setup during radiotherapy, lack of knowledge of the inter-patient and intra-patient radiosensitivity and inconsistencies in treatment methodology. Consequently, the determined model parameters (such as the D50, γ, and s) and the corresponding dose-response curves are characterized by confidence intervals. As a results, the possibility of demonstrating the confidence intervals of the total control and complication dose-response curves as well as the inclusion of more radiobiological models are among the features to be developed in the next version of this toolkit.
As we are in the beginning era of biologically guided radiation therapy, the BEUDcal provides a user-friendly and interactive platform for specification, report and comparison of dose-response probabilities and treatment planning. BEUDcal utilizes a fairly good database of radiobiological data, and will be updated upon newer information of radiobiological mechanisms available. In the near future, with further understanding of radiobiological response to extract tumor-specific and, even, patient-specific biological parameters, this software will be able to predict the treatment outcome and tailor the treatment plans to the biological characteristics of specific patients.
Acknowledgement
This project is sponsored in part in part by National Institutes of Health/ National Library of Medicine grant (1 R01 LM009362).
Footnotes
Publisher's Disclaimer: This is a PDF file of an unedited manuscript that has been accepted for publication. As a service to our customers we are providing this early version of the manuscript. The manuscript will undergo copyediting, typesetting, and review of the resulting proof before it is published in its final citable form. Please note that during the production process errors may be discovered which could affect the content, and all legal disclaimers that apply to the journal pertain.
Conflict of Interest Statement
The authors report no conflicts of interest.
References
- 1.Webb S, Nahum AE. A model for calculating tumour control probability in radiotherapy including the effects of inhomogeneous distributions of dose and clonogenic cell density. Phys.Med.Biol. 1993;38:653–666. doi: 10.1088/0031-9155/38/6/001. [DOI] [PubMed] [Google Scholar]
- 2.Niemierko A. Reporting and analyzing dose distributions: a concept of equivalent uniform dose. Med.Phys. 1997;24:103–110. doi: 10.1118/1.598063. [DOI] [PubMed] [Google Scholar]
- 3.Mavroidis P, Lind BK, Van Dijk J, Koedooder K, De Neve W, De Wagter C, Planskoy B, Rosenwald JC, Proimos B, Kappas C, Claudia D, Benassi M, Chierego G, Brahme A. Comparison of conformal radiation therapy techniques within the dynamic radiotherapy project 'Dynarad'. Phys.Med.Biol. 2000;45:2459–2481. doi: 10.1088/0031-9155/45/9/302. [DOI] [PubMed] [Google Scholar]
- 4.Mavroidis P, Lind BK, Brahme A. Biologically effective uniform dose (D) for specification, report and comparison of dose response relations and treatment plans. Phys.Med.Biol. 2001;46:2607–2630. doi: 10.1088/0031-9155/46/10/307. [DOI] [PubMed] [Google Scholar]
- 5.Brahme A. Development of radiation therapy optimization. Acta Oncol. 2000;40:579–595. doi: 10.1080/028418600750013267. [DOI] [PubMed] [Google Scholar]
- 6.Källman P, Agren A, Brahme A. Tumour and normal tissue responses to fractionated nonuniform dose delivery. Int.J.Radiat.Biol. 1992;62:249–262. doi: 10.1080/09553009214552071. [DOI] [PubMed] [Google Scholar]
- 7.Källman P, Lind BK, Brahme A. An algorithm for maximizing the probability of complication-free tumour control in radiation therapy. Phys.Med.Biol. 1992;37:871–890. doi: 10.1088/0031-9155/37/4/004. [DOI] [PubMed] [Google Scholar]
- 8.Ågren Cronqvist AK, Källman P, Brahme A. Determination of the relative seriality of a tissue from its response to non-uniform dose delivery Modeling. In: Baltas D, editor. Clinical Radiobiology. Albert-Ludwigs-University; 1994. p. 127. [Google Scholar]
- 9.Lind BK, Mavroidis P, Hyodynmaa S, Kappas C. Optimization of the dose level for a given treatment plan to maximize the complication-free tumor cure. Acta Oncol. 1999;38:787–798. doi: 10.1080/028418699432950. [DOI] [PubMed] [Google Scholar]
- 10.Bentzen SM. Radiation therapy: intensity modulated, image guided, biologically optimized and evidence based. Radiother.Oncol. 2005;77:227–230. doi: 10.1016/j.radonc.2005.11.001. [DOI] [PubMed] [Google Scholar]
- 11.Brahme A. Biologically optimized 3-dimensional in vivo predictive assay-based radiation therapy using positron emission tomography-computerized tomography imaging. Acta Oncol. 2003;42:123–136. doi: 10.1080/02841860310004986. [DOI] [PubMed] [Google Scholar]
- 12.Brahme A, Nilsson J, Belkic D. Biologically optimized radiation therapy. Acta Oncol. 2001;40:725–734. doi: 10.1080/02841860152619142. [DOI] [PubMed] [Google Scholar]
- 13.Ling CC, Li XA. Over the next decade the success of radiation treatment planning will be judged by the immediate biological response of tumor cells rather than by surrogate measures such as dose maximization and uniformity. Med.Phys. 2005;32:2189–2192. doi: 10.1118/1.1930908. [DOI] [PubMed] [Google Scholar]
- 14.Withers HR, Taylor JM, Maciejewski B. T reatment volume and tissue tolerance. Int.J.Radiat.Oncol.Biol.Phys. 1988;14:751–759. doi: 10.1016/0360-3016(88)90098-3. [DOI] [PubMed] [Google Scholar]
- 15.Emami B, Lyman J, Brown A, Coia L, Goitein M, Munzenrider JE, Shank B, Solin LJ, Wesson M. Tolerance of normal tissue to therapeutic irradiation. Int.J.Radiat.Oncol.Biol.Phys. 1991;21:109–122. doi: 10.1016/0360-3016(91)90171-y. [DOI] [PubMed] [Google Scholar]
- 16.Ågren Cronqvist AK. Quantification of the response of heterogeneous tumours and organized normal tissues to fractionated radiotherapy. Stockholm University; Sweden: 1995. [Google Scholar]
- 17.Okunieff P, Morgan D, Niemierko A, Suit HD. Radiation dose-response of human tumors. Int.J.Radiat.Oncol.Biol.Phys. 1995;32:1227–1237. doi: 10.1016/0360-3016(94)00475-z. [DOI] [PubMed] [Google Scholar]
- 18.Gagliardi G, Lax I, Ottolenghi A, Rutqvist LE. Long-term cardiac mortality after radiotherapy of breast cancer--application of the relative seriality model. Br.J.Radiol. 1996;69:839–846. doi: 10.1259/0007-1285-69-825-839. [DOI] [PubMed] [Google Scholar]
- 19.Gagliardi G, Bjohle J, Lax I, Ottolenghi A, Eriksson F, Liedberg A, Lind P, Rutqvist LE. Radiation pneumonitis after breast cancer irradiation: analysis of the complication probability using the relative seriality model. Int.J.Radiat.Oncol.Biol.Phys. 2000;46:373–381. doi: 10.1016/s0360-3016(99)00420-4. [DOI] [PubMed] [Google Scholar]
- 20.Johansson S, Svensson H, Denekamp J. Dose response and latency for radiation-induced fibrosis, edema, and neuropathy in breast cancer patients. Int.J.Radiat.Oncol.Biol.Phys. 2002;52:1207–1219. doi: 10.1016/s0360-3016(01)02743-2. [DOI] [PubMed] [Google Scholar]
- 21.Rancati T, Wennberg B, Lind P, Svane G, Gagliardi G. Early clinical and radiological pulmonary complications following breast cancer radiation therapy: NTCP fit with four different models. Radiother.Oncol. 2007;82:308–316. doi: 10.1016/j.radonc.2006.12.001. [DOI] [PubMed] [Google Scholar]
- 22.Ferreira BC, Mavroidis P, Adamus-Gorka M, Svensson R, Lind BK. The impact of different dose-response parameters on biologically optimized IMRT in breast cancer. Phys.Med.Biol. 2008;53:2733–2752. doi: 10.1088/0031-9155/53/10/019. [DOI] [PubMed] [Google Scholar]
- 23.Mavroidis P, Plataniotis GA, Gorka MA, Lind BK. Comments on 'Reconsidering the definition of a dose-volume histogram'--dose-mass histogram (DMH) versus dose-volume histogram (DVH) for predicting radiation-induced pneumonitis. Phys.Med.Biol. 2006;51:L43–50. doi: 10.1088/0031-9155/51/24/L01. [DOI] [PubMed] [Google Scholar]
- 24.Mavroidis P, Ferreira BC, Shi C, Lind BK, Papanikolaou N. Treatment plan comparison between helical tomotherapy and MLC-based IMRT using radiobiological measures. Phys.Med.Biol. 2007;52:3817–3836. doi: 10.1088/0031-9155/52/13/011. [DOI] [PubMed] [Google Scholar]
- 25.Mavroidis P, Ferreira BC, Shi C, Delichas MG, Lind BK, Papanikolaou N. Comparison of the Helical Tomotherapy and MLC-based IMRT Radiation Modalities in Treating Brain and Cranio-spinal Tumors. Technol.Cancer.Res.Treat. 2009;8:3–14. doi: 10.1177/153303460900800102. [DOI] [PubMed] [Google Scholar]


