

Abstract
Background
Rats chronically fed ethanol for 3 weeks presented a marked decreased in total hepatic Mg2+ content and required approximately 12 days to restore Mg2+ homeostasis upon ethanol withdrawal. The present study was aimed at investigating the mechanisms responsible for the EtOH-induced delay.
Methods
Hepatocytes from rats fed ethanol for 3 weeks (Lieber De-Carli diet – chronic model), rats re-fed a control diet for varying periods of time following ethanol withdrawal, and age-matched control rats fed a liquid or a pellet diet were used. As acute models, hepatocytes from control animals or HepG2 cells were exposed to varying doses of ethanol in vitro for 8 min.
Results
Hepatocytes from ethanol-fed rats presented a marked inhibition of Mg2+ accumulation and a defective translocation of PKCε to the cell membrane. Upon ethanol withdrawal, 12 days were necessary for PKCε translocation and Mg2+ accumulation to return to normal levels. Exposure of control hepatocytes or HepG2 cells to a dose of ethanol as low as 0.01% for 8 min was already sufficient to inhibit Mg2+ accumulation and PKCε translocation for more than 60 min. Also in this model, recovery of Mg2+ accumulation was associated with restoration of PKCε translocation. The use of specific antisense in HepG2 cells confirmed the involvement of PKCε in modulating Mg2+ accumulation.
Conclusions
Translocation of PKCε isoform to the hepatocyte membrane is essential for Mg2+ accumulation to occur. Both acute and chronic ethanol administrations inhibit Mg2+ accumulation by specifically altering PKCε translocation to the cell membrane.
Keywords: Mg2+ homeostasis, hepatocyte, protein kinase C isoforms, EtOH
Introduction
Magnesium (Mg2+) is the second most abundant cation in mammalian cells after potassium (Gunther, 1993). Within the cell, Mg2+ is mainly localized within mitochondria, endoplasmic (or sarcoplasmic) reticulum, nucleus, and cytoplasm (Gunther, 1993; Romani and Scarpa, 2000), in which it regulates numerous biological functions (Romani and Scarpa, 2000). Despite its cellular abundance and its physiological relevance for the proper functioning of various cellular enzymes and channels, our understanding of the mechanisms regulating Mg2+ homeostasis and transport is limited. Under resting conditions, total cellular Mg2+ remains unchanged through the compensatory operation of entry and exit mechanisms (Gunther, 1993; Romani and Scarpa, 2000), and through buffering by ATP and other phosphonucleotides (reviewed in Romani and Scarpa, 2000). Upon hormonal stimulation, however, large and fast fluxes of Mg2+ cross the cell membrane in either direction across based upon the specific hormone administered, resulting in a transient net loss or net gain of cellular Mg2+ (Romani and Scarpa, 2000). Mg2+ extrusion predominantly occurs via a Na+-dependent pathway which, in the absence of functional cloning, has been tentatively identified as a Na+/Mg2+ exchanger activated directly or indirectly via cAMP-dependent phosphorylation (Romani and Scarpa, 1990; Romani and Scarpa, 2000; Cefaratti and Romani, 2007). In contrast, hormones or agents that decrease cellular cAMP level or activate protein kinase C (PKC1) signaling induce an accumulation of Mg2+ within the cell (Romani et al., 1992; Romani and Scarpa, 2000). Contrasting the lack of cloning information about the Mg2+ extrusion pathways, several Mg2+ entry mechanisms have recently been identified (reviewed in Romani, 2007). However, the relative contribution of these entry mechanisms to Mg2+ accumulation, their modality of operation, and their activation by signaling pathways is only partially understood.
Following acute or chronic EtOH administration, hypomagnesemia and a marked Mg2+ loss have been observed in various tissues including liver (Flink, 1986; Swann, 1990; Zou et al., 1992), both in patients and animal models. Conversely, Mg2+ supplementation results in the amelioration of several metabolic functions compromised by alcohol consumption (Zou et al., 1992). Yet, the mechanisms responsible for Mg2+ loss, the relevance of this loss for the onset of EtOH-related complications, and the modality by which Mg2+ supplementation exerts its beneficial effects have not been fully investigated.
Previous investigation from our group has revealed that the acute infusion of EtOH in livers results in a marked, dose- and time-dependent extrusion of Mg2+ from the hepatocyte via a Na+-dependent mechanism. This extrusion is associated with the transient decrease in cellular ATP content consequent to EtOH metabolism both processes being prevented by the pre-treatment of liver cells with 4-methyl-pyrazole (4-MP), an inhibitor of alcohol dehydrogenase (Tessman and Romani, 1998). A larger and more persistent decrease in hepatic Mg2+ and ATP contents have been observed in rats receiving EtOH in the diet for 3–4 weeks (Young et al., 2003). In this chronic model of EtOH administration approximately 12 days are necessary for hepatic Mg2+ content to return to basal level upon withdrawal of EtOH from the diet (Torres et al., 2009).
The present study was undertaken to elucidate the mechanisms by which chronic EtOH administration impairs Mg2+ accumulation in liver cells and delays the recovery of hepatic Mg2+ homeostasis upon EtOH removal. The results reported here indicate that chronic ethanol exposure impairs hepatic Mg2+ accumulation by specifically altering the translocation of PKCε to the cell membrane, and approximately 12 days are required to fully restore both PKCε translocation and Mg2+ accumulation. An altered PKCε translocation and a defective Mg2+ accumulation are also observed upon acute administration (8 min) of a single dose of ETOH as low as 0.01% to hepatocyte. In this model, approximately 75 min are necessary for both processes to be fully restored.
Materials and Methods
Materials
Collagenase (CLS2) was from Worthington. Dulbecco’s modified eagle’s medium (DMEM), luciferin-luciferase and LDH enzymatic kits, and all the other chemicals and reagents were from Sigma (St Louis, MO). Lieber-De Carli diet and liquid control diet were from Bio-Serve (Frenchtown, NJ). Antibodies anti-classical and novel PKC isoforms were from Santa Cruz (Santa Cruz, CA). PKCδ and PKCε antisense and control missense were from Translational Laboratories (Lexington, KY). HepG2 cell line was from ATCC (Manassas, VA). Oxyblot detection kit was from Millipore, Billerica, MA). Antibodies recognizing the HNE/protein adducts were a kind gift from Dr. Szweda, Oklahoma Medical Center, Oklahoma).
Liquid Diet
Male Sprague-Dawley rats (180–200 g body weight) were randomly divided into control- and EtOH-treated groups and housed individually in metabolic cages. EtOH-treated rats were maintained for 3 weeks on a 6% EtOH Lieber-De Carli diet. Pair-fed control rats received an isocaloric liquid control diet. Age-matched, Purina Chow pellet-fed control rats were used for comparison. Weight gain was recorded weekly. For the EtOH withdrawal studies, after 3 weeks of administration the alcohol-diet was suspended and the rats were fed the liquid control diet for a period of time varying from 2 to 15 days.
Hepatocytes Isolation
To isolate liver cells, rats were anesthetized by i.p. injection of saturated sodium pentobarbital solution (50 mg/bw). Upon attainment of a deep anesthesia, the abdomen was opened, the portal vein cannulated, and the hepatocytes isolated by collagenase digestion as previously reported (Tessman and Romani, 1998; Young et al., 2003). This protocol was in agreement with the NIH directives for the use and maintenance of experimental animals and was approved by the Institutional Animal Care and Utilization Committee (IACUC) at Case Western Reserve University.
Hepatocytes isolated from rats fed liquid EtOH diet, liquid control diet, or pellet diet (without EtOH) were resuspended, at the final concentration of ~1×10⁶ cells/mL, in a medium having the following composition (mM): NaCl 120, KCl 3, KH2PO4 1.2, NaHCO3 12, CaCl2 1.2, MgCl2 1.2, Hepes 10 and glucose 10, pH 7.2 at 37°C, under O2:CO2 (95:5 v/v) flow, and kept at room temperature until used. Trypan Blue exclusion test indicated a cell viability of 87±3%, 88±2% and 87±4%, respectively, for the 3 experimental groups (n=10 for each group). Viability did not change significantly over 3–4 hours (85±2%, 86±3% and 86±4%, respectively, n=10 for each group). For Mg2+ uptake determination, 1 mL of cell suspension was rapidly sedimented at 600 g × 30 seconds. The supernatant was removed and the cells washed with 1 mL of the medium reported above containing contaminant (10µM) or 1.2mM Mg2+. The cells were transferred in 10 mL of incubation medium, pre-warmed at 37°C, and incubated therein under continuous stirring and O2:CO2 flow. After a few minutes of equilibration, the reported concentrations of vasopressin, PMA or OAG as PKC stimulating agents were added to the incubation system. At selected times, 700 µL aliquots of the incubation mixture were withdrawn in duplicate, and the cells sedimented in microfuge tubes. The pellets were digested overnight in 10% HNO3. Following sedimentation of the denaturated protein at 5,000 RPM for 5 min in a refrigerated J-6B Beckman centrifuge, the Mg2+ content in the acid extract was measured by atomic absorbance spectrophotometry (AAS) in a Perkin-Elmer 3100 (Tessman and Romani, 1998; Young et al., 2003).
Acute EtOH administration
Hepatocytes from control rats were pre-incubated with 0.01%, 0.1% or 1% EtOH for 8 min at 37°C (Young et al., 2007). At the end of the pre-incubation, the cells were sedimented at 600 g × 30 seconds. The supernatant was removed and assessed for Mg2+ content by AAS. The cell pellet was transferred in the incubation medium indicated previously, and assessed for Mg2+ accumulation as indicated above.
Western Blot Analysis
Aliquots of liver cells from EtOH-fed and control-diet rats were removed from the incubation system prior to or 6 min after the addition of EtOH or protein kinase C agonists, and rapidly homogenized in a buffer containing (mM): 100 NaCl, 0.01 leupeptin, 1 Na3VO4, 10 Hepes, pH 7.4, in the presence of a cocktail of protease and phosphatase inhibitors (Sigma, St Louis). Following centrifugation (14,000 g × 10 min), the membrane fraction was collected and equal amounts of proteins were applied to a 10% acrylamide gels. The proteins were separated by SDS-PAGE and transferred onto a PVDF immobilization membrane (Schleicher & Schuell Inc.). Novel PKC isoforms ε and δ, and classical isoforms a, β-I and β-II were immunodetected by Western blot analysis using isoform specific polyclonal antibodies (Santa Cruz). Blots were routinely stained with Ponceau S before immunostaining to confirm the equal loading of samples and the transfer of equivalent amounts of protein. The membranes were extensively washed with PBS, and the primary antibody binding was visualized utilizing peroxidase-conjugated secondary antibody and ECL western blotting detection reagents (Amersham). Densitometry was performed using Scion Image Program (NIH).
HepG2 Cell Culture
HepG2 cells were cultured according to the vendor directive (ATCC) and used at ~80% confluence. HepG2 (~100,000 cells/ml) were incubated in 6 wells plates at 37°C on a slide warmer, and varying concentrations of EtOH (i.e. 0.01%. 0.1% or 1%) were added directly to the culture medium for 8 min. The cells were then washed to remove excess EtOH and the medium replaced. Vasopressin (VP, 20nM), OAG (20nM), PMA (20nM) or PDBU (20nM) were added to the cells to stimulate Mg2+ accumulation. Eight min (8 min) later, the incubation was stopped by transferring the plates to an ice bed. The medium was removed and the cells were washed twice with PBS prior to the addition of 1 ml 10%HNO3. Cells were scraped and the acid mixture was transferred to microfuge tubes for overnight digestion. Following sedimentation of the denatured protein at 2,000 g for 5 min in a Beckman J-6B, the Mg2+ content in the acid extract was measured by AAS (Tessman and Romani, 1998; Young et al., 2003; Young et al., 2007; Torres et al., 2009).
Antisense Experiment
HepG2 at ~80% confluence were transfected with antisense for PKCε (5′-GCCAGCTCGATCTTGCGCCC-3′) (Pessino et al., 1995) and PKCδ (5'-AGGGTGCCATGATGGA-3’) (Parada et al., 2003). A scrambled missense was used as control. The expression of the indicated PKC isoforms was assessed by Western Blot analysis and densitometry as detailed above. Antisense- and missense- transfected HepG2 cells were stimulated for 8min with vasopressin, OAG, PMA or PDBU to induce Mg2+ accumulation. Incubation was stopped as reported previously, and the cells digested in 10% HNO3 to measure total cellular Mg2+ content by AAS.
In separated sets of experiments, the cells were incubated in vitro with cycloheximide (10 to 50 µM) for up to 72 hours. The medium was then replaced with fresh medium containing 1 mM extracellular Mg2+, and the cells were stimulated for Mg2+ uptake for 8 min by addition of OAG (20 nM). At the end of the experiment the excess medium was removed, and the cell digested in 10% HNO3 to determine cellular Mg2+ content by AAS in the acid extract as described in detail previously. In parallel experiments, cycloheximide pre-treated HepG2cells were digested in Laemmli buffer to assess basal PKCε expression.
Oxidative modification of proteins
To determine whether exposure to EtOH inhibited Mg2+ accumulation via oxidative modification of proteins, HepG2 cells were pre-treated with 100µM di-thio-threitol (DTT) or 100µM N-acetyl-cysteine (NAC) for 15 min prior to undergoing 8 min exposure to 0.01% EtOH at 37°C. Following EtOH exposure, the cells were washed twice with fresh medium and stimulated for Mg2+ accumulation for 8 min by addition of OAG or PDBU (20 nM each). At the end of the experiment, cellular Mg2+ content was assessed by AAS in the acid digestion of cell pellet as indicated above. Parallel experiments were performed to prepare cells for SDS-PAGE and Western Blot analysis to assess oxidative modification of proteins using antibodies recognizing HNE/protein adducts (Lashin et al., 2006) or oxyblot detection kit according to the manufacturer instructions as reported previously (Lashin et al., 2006).
Determination of ATP and protein content
Cellular ATP level was measured in isolated hepatocytes as reported previously (Tessman and Romani, 1998). Protein content was measured according to the procedure of Lowry (Lowry et al., 1951), using BSA as standard.
Statistical analysis
The data are reported as mean±SEM. Data were first analyzed by one-way ANOVA. Multiple means were then compared by Tukey’s multiple comparison test performed with a q value established for statistical significance of P<0.05.
Results
Mg2+ Homeostasis and Accumulation Following Chronic EtOH Exposure
Total hepatic Mg2+ content decreased by 20–25% in EtOH-fed rats as compared to age-matched controls fed a liquid control diet or a pellet diet (Torres et al., 2009). Following EtOH withdrawal, approximately 12 days were necessary for hepatic Mg2+ content to return to control levels (Torres et al., 2009). To elucidate the mechanisms responsible for the Mg2+ loss and the delayed restoration of Mg2+ homeostasis, isolated hepatocytes were used. Total Mg2+ content in hepatocytes from rats fed EtOH for 3 weeks accounted for 27.2±2.4 nmol Mg2+/mg protein vs. 36.3±1.0 and 37.1+1.6 nmol Mg2+/mg protein in hepatocytes from rats fed liquid control and pellet diets (n=12 for each experimental groups, p<0.003). Hepatic ATP content was also significantly reduced in EtOH-fed animals as compared to the two control groups (11.8±0.17 vs. 14.2±0.2 and 14.6±0.4 nmol/mg protein, respectively, n=12 for each experimental groups, p<0.001).
Mg2+ accumulation was then assessed. Fig. 1 shows that the addition of 20nM OAG or 20nM PDBU (or PMA, not shown) failed to elicit a Mg2+ accumulation in hepatocytes from EtOH-fed rats. Longer time of stimulation and larger doses of agonists were similarly ineffective (not shown). In contrast, all these agonists induced a Mg2+ accumulation in hepatocytes from rats on control liquid-diet animals, which reached the maximum within 6 min from the agent addition (Fig. 1). A quantitatively similar Mg2+ accumulation was observed in hepatocytes from control rats fed a pellet diet (2.75±0.42, 2.64±0.57, and 2.53±0.51 nmol Mg2+/mg protein/6 min for VP, OAG and PMA stimulated cells, respectively, vs. 0.32±0.07 nmol Mg2+/mg protein/6 min for non-stimulated cells, n=7 for each experimental condition, p<0.02). The experiments reported in Fig. 1 utilized contaminant Mg2+ due to the high sensitivity of the AAS technique used to measure extracellular Mg2+ content. Similar experiments were repeated in cells incubated in the presence of a physiological (1.2mM) extracellular Mg2+ concentration with superimposable results (e.g., VP-stimulated hepatocytes accumulated 2.68±0.47 nmol Mg2+/mg protein/6 min in the presence of 1.2 mM extracellular Mg2+ (n=6) vs. 2.75±0.42 nmol Mg2+/mg protein /6 min in the presence of contaminant Mg2+ (Fig. 1)). For these experiments, changes in Mg2+ content were assessed at the cellular level to obviate the high noise-to-signal ratio resulting from the several fold dilution necessary to scale the extracellular Mg2+ concentration down to the AAS sensitivity range. All the subsequent experiments were then performed in the presence of 1.2 mM extracellular Mg2+, and the results reported as net change in cellular Mg2+ content for simplicity. Because hepatocytes from control rats fed a pellet- or a liquid-diet presented comparable amounts of cellular Mg2+ and ATP, and accumulated Mg2+ in a qualitatively and quantitatively similar manner, for the remainder of our study we used hepatocytes from rats fed a liquid control-diet, as they better mimic the experimental conditions of rats on Lieber-De Carli diet.
Figure 1. Mg2+ accumulation in liver cells isolated from rats fed with EtOH in the diet for 3 weeks.
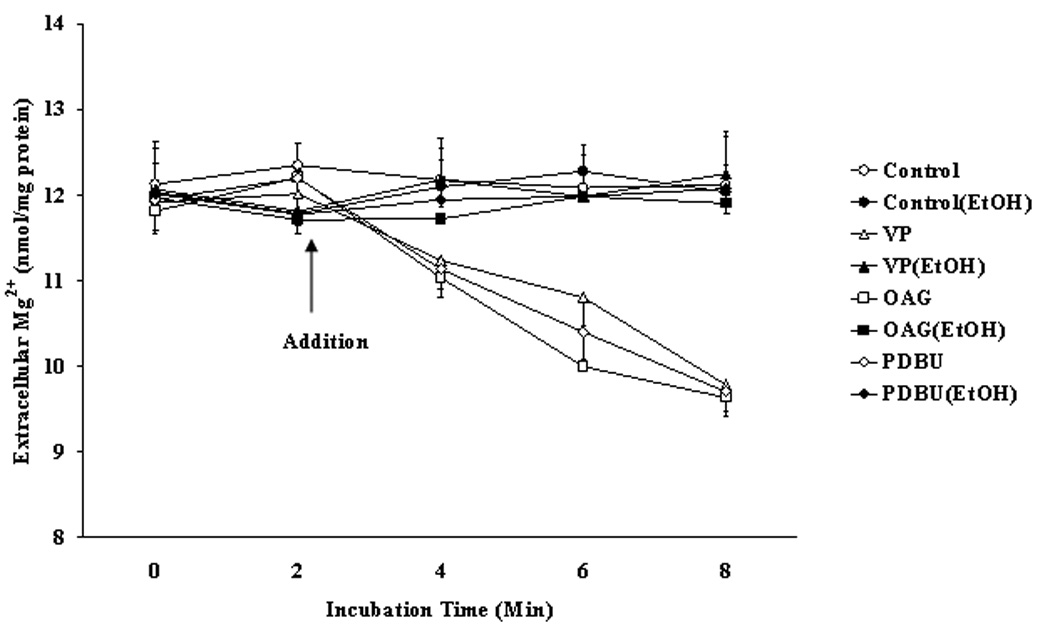
Hepatocytes from rats fed EtOH or liquid control diet were stimulated for Mg2+ accumulation with VP, OAG or PDBU. Data are means±S.E. of 4 different preparations each tested in duplicate for each experimental condition. *Statistically significant vs. corresponding values in control samples.
Recovery of Mg2+ Accumulation
To determine the recovery time of Mg2+ accumulation, following removal of EtOH from the diet rats were re-fed with liquid-control diet containing 24 g/Kg diet as magnesium oxide for varying period of time as previously reported (Torres et al., 2009). Fig. 2 shows that in hepatocytes isolated from re-fed animals Mg2+ accumulation reached levels comparable to those observed in pare-fed control-diet animals by day 12 after EtOH removal. Prolonging the control-diet re-feeding for more than 12 days (i.e. 15 days, Fig. 2) did not further increase the amplitude of Mg2+ accumulation. This time course was consistent with the time course of the increase in total Mg2+ content previously observed (Torres et al., 2009). Doses of agonists larger than those reported in Fig. 2 at any time point neither enhanced Mg2+ accumulation nor accelerated the recovery (not shown).
Figure 2. Recovery of Mg2+ accumulation in liver cells isolated from EtOH-fed rats.
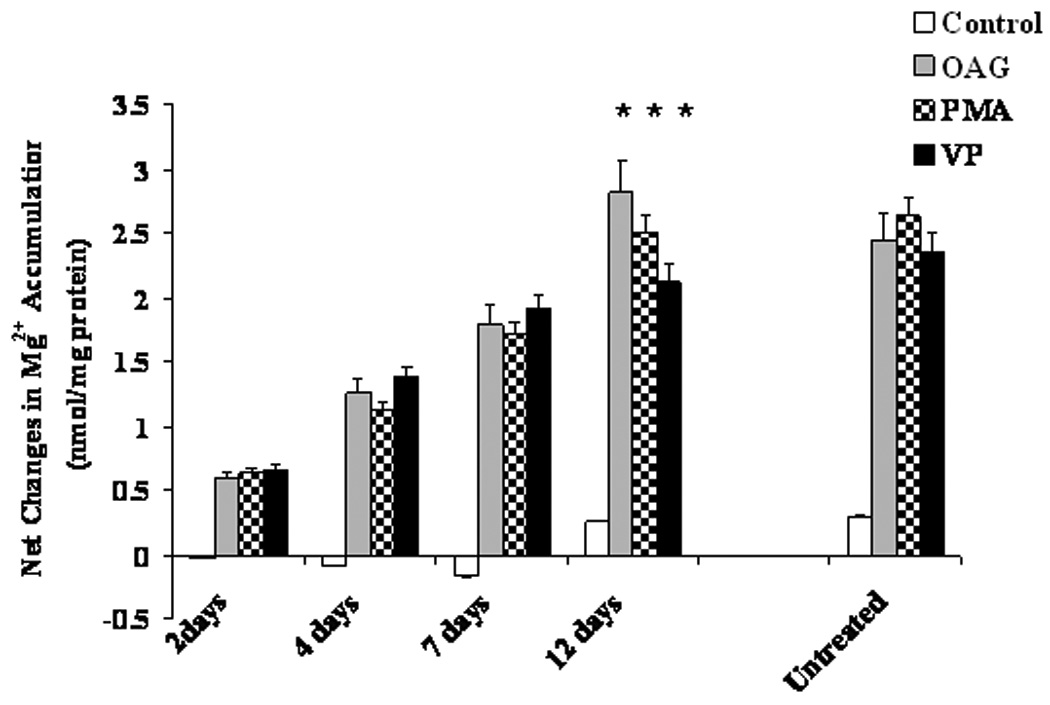
Hepatocytes were isolated from EtOH-fed rats prior to or after being switched to control diet for varying periods of time. Net Mg2+ accumulation at time 6 min after agonist addition is reported. Data are means±S.E. of 6 different preparations each tested in duplicate for all experimental conditions. *Statistically significant vs. corresponding values at 2 days, 4 days and 7 days.
Involvement of PKCε in Mg2+ Accumulation
Mg2+ accumulation is mediated via PKC (Csermely et al. 1987; Grubbs and Maguire, 1986; Romani et al., 1992), a signaling pathway that can be altered by EtOH administration (Hoek et al., 1987; Domenicotti et al., 1996). We assessed whether the defective Mg2+ accumulation depended on an altered PKC distribution. Rat hepatocytes possess three classical (α, βI and βII) and two novel (δ and ε) PKC isoforms (Tang et al., 1993). PKC translocation from the cytoplasm to the cell membrane is the first step in PKC activation, and changes in PKC translocation have been routinely used as a way to assess changes in PKC activity (Diaz-Guerra et al., 1991). Chronic EtOH administration reduced the basal amount of PKCε and PKCδ in hepatocytes by ~15% and ~12%, respectively (Fig. 3A). Also, it significantly reduced (>75%) the amount of PKCε translocating to the cell membrane upon administration of OAG (Figs. 3A and 3B), PMA or VP (not shown). Translocation of PKCδ (Figs. 3A), and α, βI and βII isoforms (not shown) was marginally affected (<15%). The similar basal levels of the various PKC isoforms excluded differences in gel loading. We then assessed whether the restoration of Mg2+ accumulation was associated with a re-normalization of PKCε translocation to the cell membrane upon OAG stimulation. As reported in Fig. 3C, the translocation of PKCε to the cell membrane returned to levels comparable to those observed in EtOH-untreated cells within a time frame similar to that of Mg2+ accumulation (Fig. 2).
Figure 3. PKCε and PKCδ distribution in liver cells isolated from rats fed with EtOH in the diet for 3 weeks.
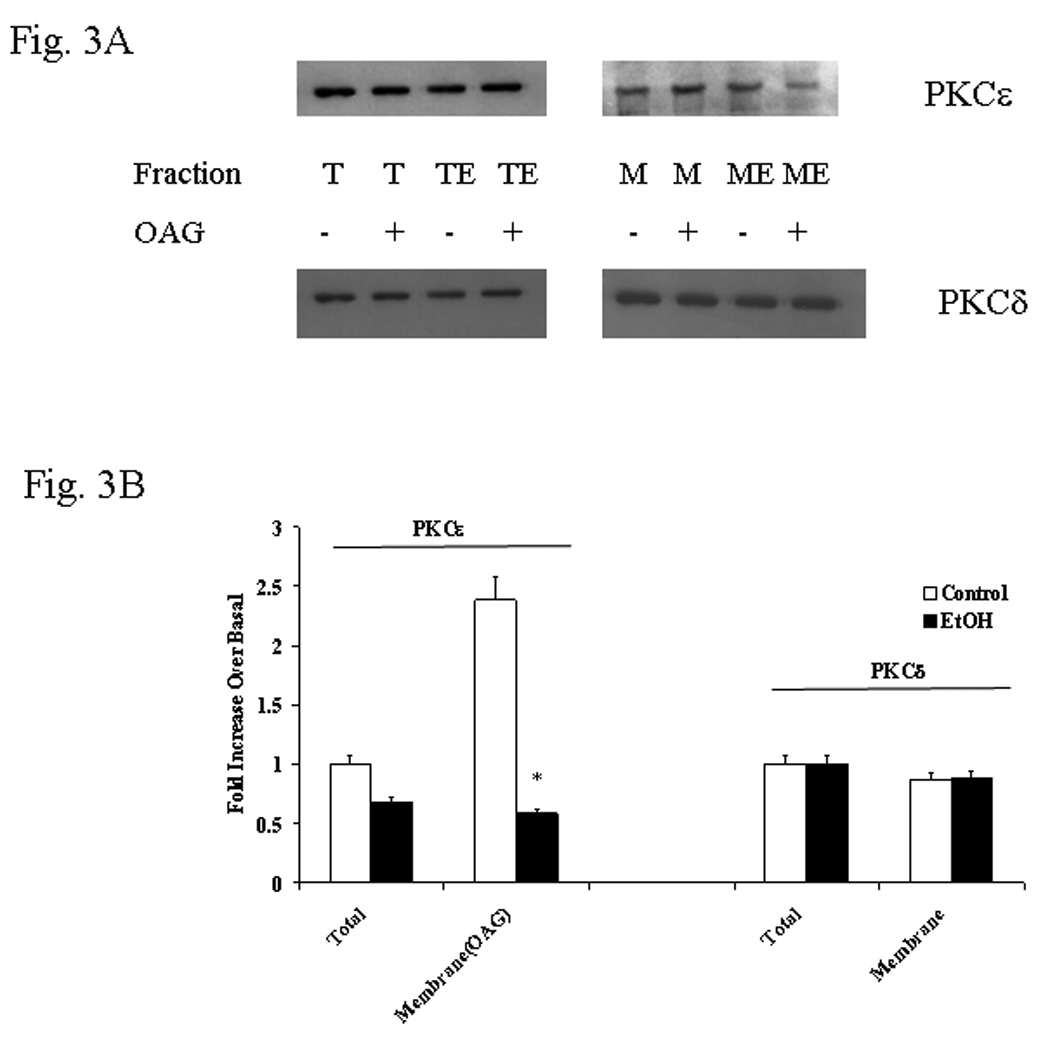
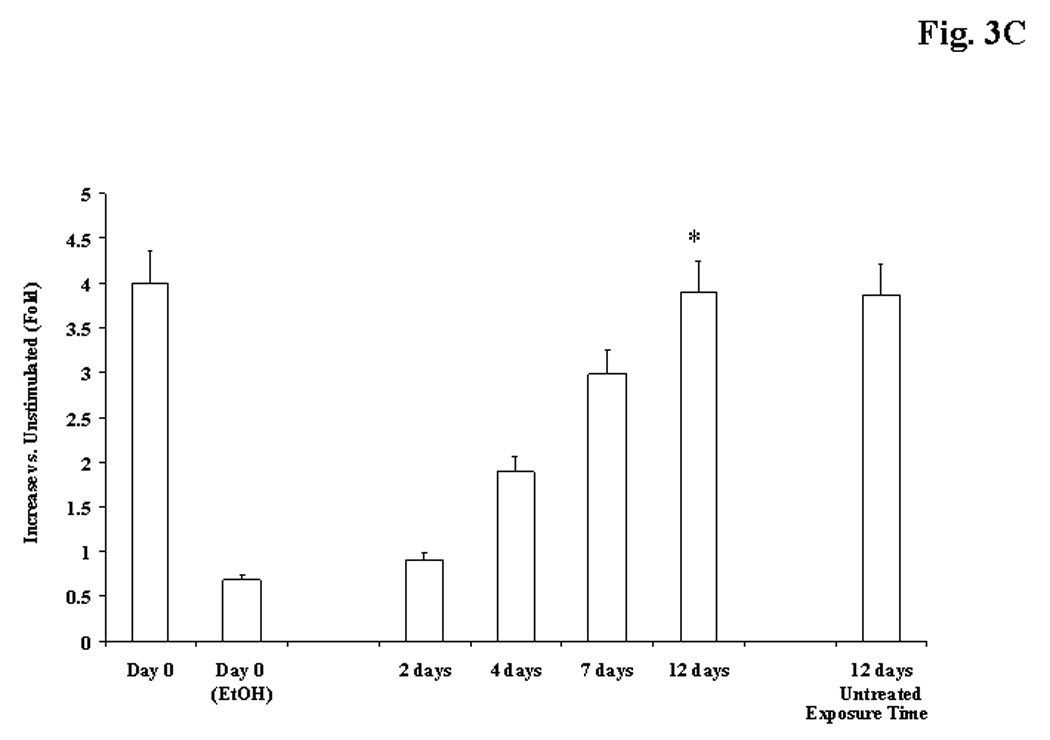
Hepatocytes isolated from EtOH-fed rats prior to or after being switched to control diet for varying periods of time underwent stimulation for Mg2+ accumulation. PKCε and PKCδ distributions were assessed by Western Blot analysis as described in detail under Materials and Methods. Fig. 3A: a typical Western Blot analysis is reported. T=Total homogenate; TE=Total Homogenate, EtOH sample; M =membrane fraction; ME=membrane fraction, ETOH sample. Densitometry of PKC distribution is reported in Fig. 3B. Fig. 3C reports recovery of PKCε and PKCδ distribution in hepatocytes isolated from EtOH-fed rats following change in diet. Data are means±S.E. of 5 different preparations for all the experimental conditions reported in Figs. 3B and 3C, each tested in duplicate. Fig. 3B: *Statistically significant vs. corresponding values in EtOH-untreated samples; Fig. 3C: *Statistically significant vs. corresponding values at day 0, 2 days, 4 days and 7 days.
Mg2+ Accumulation Following Acute EtOH Exposure
To ascertain whether Mg2+ accumulation was inhibited only following a prolonged exposure to EtOH, hepatocytes from control-diet animals were pre-incubated in vitro with varying doses of EtOH (i.e. 0.01%, 0.1% and 1%) for 8 min, according to our published protocol (Young et al., 2007). The hepatocytes were then washed and transferred to a new incubation system containing either contaminant (~10µM) or physiological 1.2mM extracellular Mg2+, and stimulated for Mg2+ uptake by addition of VP, PMA or CCH. We have previously reported that CCH is also able to stimulate Mg2+ accumulation in cardiac and liver cells (Romani et al., 1992). As Fig. 4A shows, exposure of hepatocytes to a dose of EtOH as low as 0.01% (~1.5mM) for 8 min was already sufficient to fully inhibit Mg2+ accumulation. A similar inhibition was observed in hepatocytes pretreated with 0.1% or 1% EtOH (not shown). The inhibitory effect of 0.01% EtOH persisted even in the presence of 50µM 4-MP (Fig. 4B) (Tessman and Romani, 1998; Niemela et al., 1998). Doses of 4-MP larger than 50µM were ineffective at preventing the inhibition of Mg2+ accumulation by EtOH (not shown).
Fig. 4. Mg2+ accumulation in liver cells isolated from control rats and treated in vitro with 0.01% EtOH for 8 min prior to the stimulation for Mg2+ accumulation.
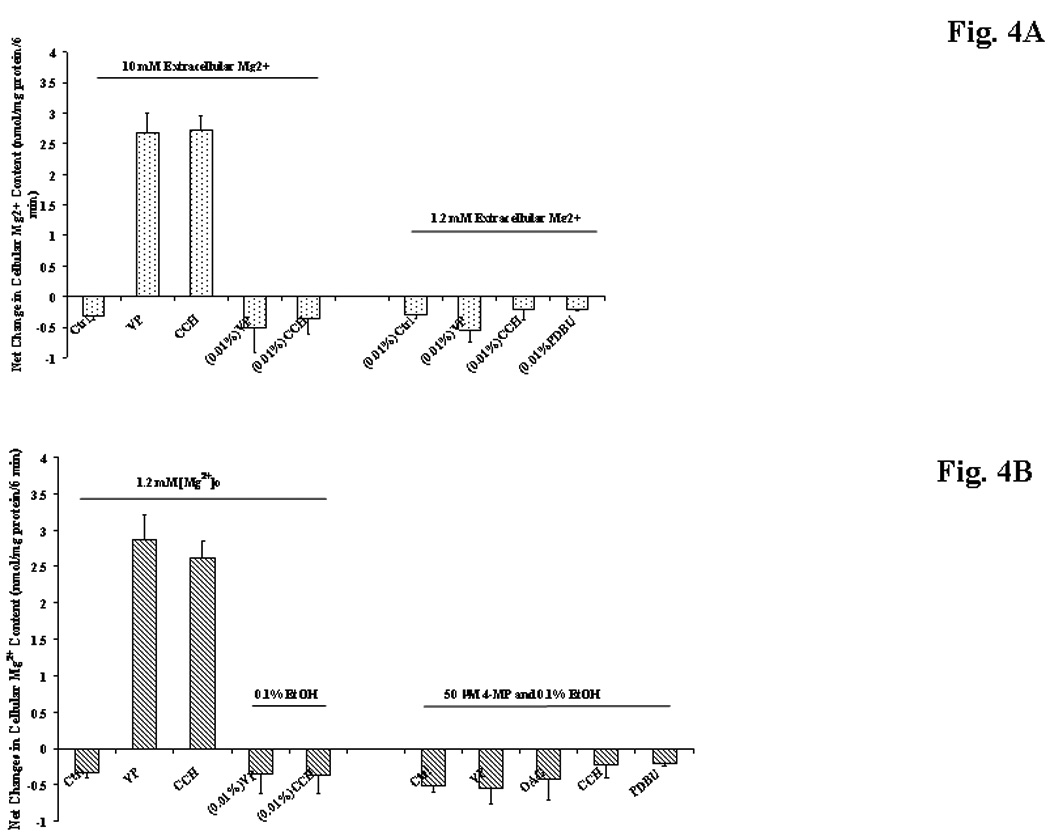
Hepatocytes from control rats were pre-treated with 0.01% EtOH for 8 min. The cells were washed and transferred to an incubation medium containing 10µM or 1.2mM Mg2+, and stimulated for Mg2+ accumulation (Fig. 4A). Alternatively, hepatocytes were exposed to EtOH in the absence or in the presence of 50µM 4-MP prior to be washed and transferred to a new incubation medium containing 1.2mM Mg2+ and stimulated for Mg2+ accumulation (Fig. 4B). Net Mg2+ accumulation at time 6 min after agonist addition for all the experimental conditions is reported in Figs. 4A and 4B. Data are means±S.E. of 6 different preparations for all the experimental conditions reported in Figs. 4A and 4B, each tested in duplicate. *Statistically significant vs. corresponding values in control samples (Ctrl).
In this acute model of EtOH exposure Mg2+ accumulation was fully restored after ~75 min from EtOH removal (Fig. 5). Prolonging the incubation up to 90 min or longer (not shown) did not enhance Mg2+ accumulation, nor the administration of doses of agonists larger than those reported in Fig. 5 increased Mg2+ accumulation or accelerate the recovery (not shown). Also in this model, EtOH administration reduced PKCε translocation by >75% upon administration of OAG (Figs. 6A and 6B), PMA or VP (not shown). Translocation of PKCδ (Fig. 6) and classical PKC isoforms (not shown), instead, remained unaltered. As Fig. 6C shows, PKCε translocation also returned to levels comparable to those observed in EtOH-untreated cells within a time frame similar to that of Mg2+ accumulation (Fig. 5).
Figure 5. Recovery of Mg2+ accumulation in liver cells isolated from control rats upon treatment in vitro with 0.01% EtOH.
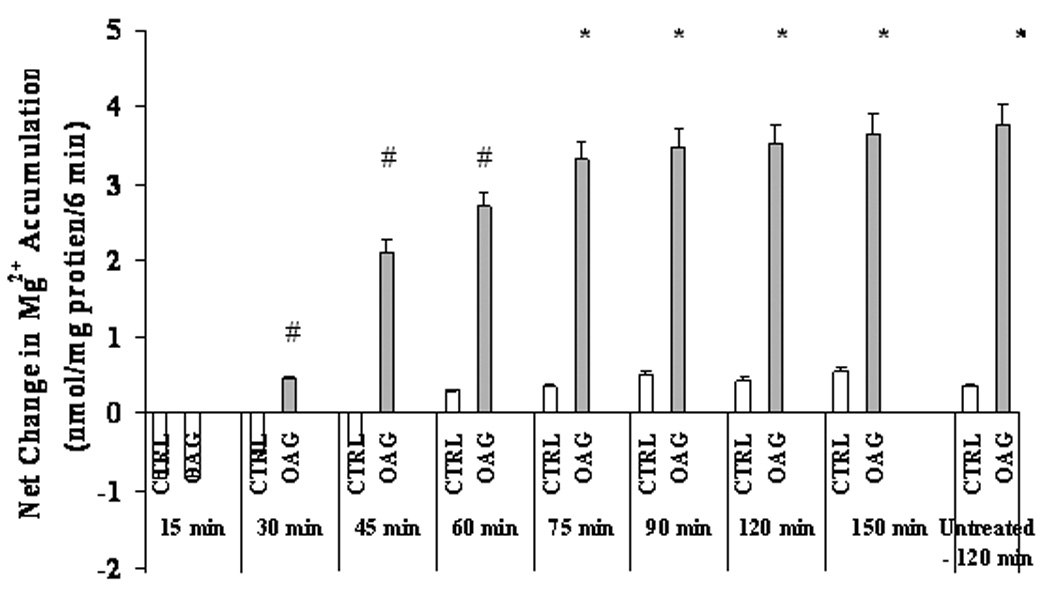
Hepatocytes isolated from control rats were pre-treated with 0.01% EtOH for 8 min prior to undergoing stimulation for Mg2+ accumulation at various time points upon EtOH withdrawal. Net Mg2+ accumulation at time 6 min after agonist additions at various time points upon EtOH removal is reported. Data are means±S.E. of 6 different preparations each tested in duplicate for all experimental conditions. *Statistically significant vs. corresponding values at time 0 min, 15 min, 30 min, 45 min, and 60 min; #Statistically significant vs. corresponding values at time 0 min, 15 min, and 30 min.
Figure 6. PKCε and PKCδ distribution in liver cells isolated from control rats and treated in vitro with 0.01% EtOH for 8 min.
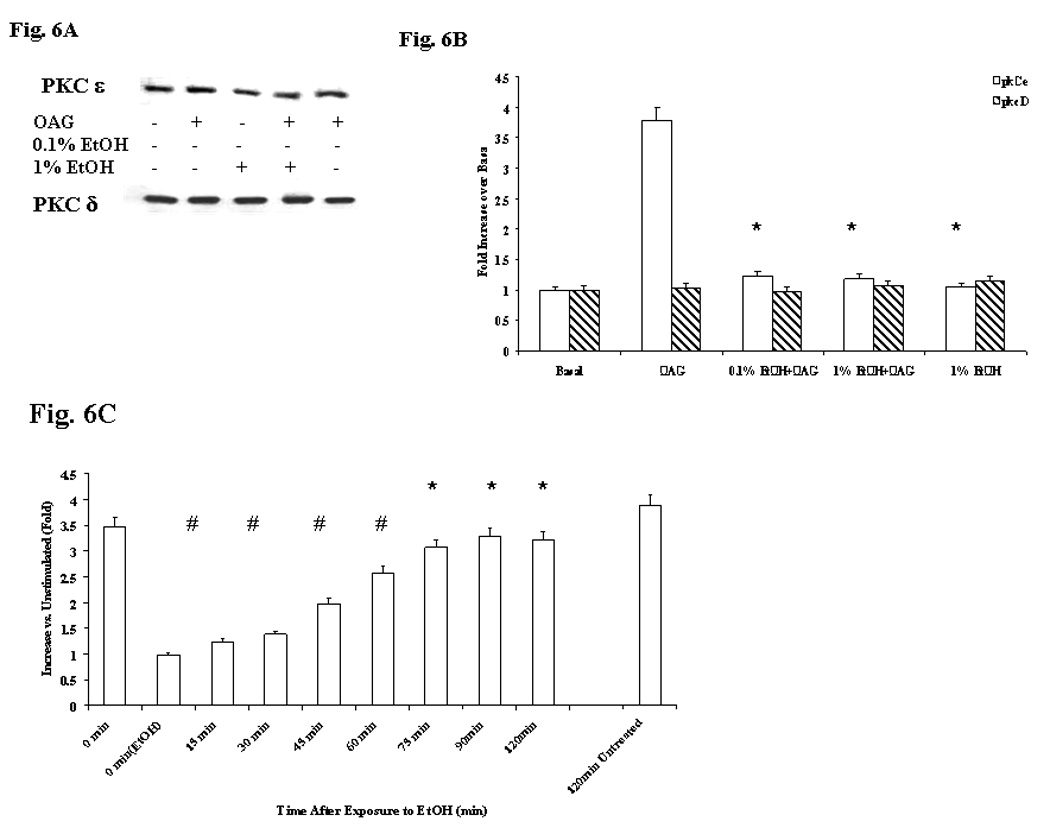
Hepatocytes from control rats were pre-treated with 0.01% or 1% EtOH for 8 min prior to undergoing stimulation with OAG for Mg2+ accumulation at various time points upon EtOH removal. PKCε distribution was assessed by Western Blot analysis (Figs. 6A and 6B). T=Total homogenate; TE=Total Homogenate, EtOH sample; M=membrane fraction; ME=membrane fraction, ETOH sample. Recovery of PKCε and PKCδ distribution in hepatocytes isolated from control rats upon pre-treatment with 0.01% EtOH and stimulation with OAG is reported in Fig. 6C. Data are means±S.E. of 4 different preparations for all the experimental conditions reported in Figs. 6B and 6C. Fig. 6B: *Statistically significant vs. corresponding values in EtOH-untreated samples. Fig. 6C: *Statistically significant vs. corresponding values at time 0 min(EtOH), 15 min, 30 min, 45 min, and 60 min after EtOH-removal; # Statistically significant vs. corresponding values at time 0 min(EtOH).
HepG2 cells and antisense
Because primary cultures of hepatocytes differentiate rapidly, HepG2 cells were used to confirm that PKCε mediated Mg2+ accumulation,. First, we validated that this hepatocyte cell line accumulated Mg2+ in a manner comparable to freshly isolated hepatocytes (Fig. 7A). HepG2 cells stimulated with OAG or PMA accumulated 6.4±0.64 or 5.5±0.73 nmol Mg2+/mg protein within 8 min, respectively, as compared to 0.34+0.08 nmol Mg2+/mg protein within 8 min in non-stimulated cells (n=8 for each experimental condition, p<0.02). Although Mg2+ accumulation was ≥2 fold higher than that observed in freshly isolated hepatocytes under similar experimental conditions (Figs. 1, 4 and 5), its trend in the absence of EtOH and its inhibition upon acute EtOH addition were qualitatively similar (Fig. 7A). HepG2 cells were transfected with PKCε antisense, PKCδ antisense, and scrambled missense as control. Upon 72 hours of treatment with antisense, PKCε or PKCδ level in transfected HepG2 cells was non-detectable (Fig. 7B). In transfected HepG2 cells, the absence of PKCε resulted in a lower basal level of Mg2+, and stimulation with VP, OAG or PMA for 8 min at 37°C did not elicit Mg2+ accumulation (Fig, 7C). In contrast, Mg2+ accumulation persisted in HepG2 cells transfected with PKCδ antisense or scrambled missense (Fig. 7C). Concentrations of antisense or missense larger than 5µM were not used. As additional control for non-specific protein synthesis inhibition, HepG2 cells were exposed to cycloheximide (10µM and 50µM). This treatment decreased basal PKCε expression (Fig. 7D) and total cellular Mg2+ content (Fig. 7E), and inhibited Mg2+ accumulation by OAG (Fig. 7E) or PDBU (not shown) addition, indicating that an active synthesis of PKCe is necessary to favor Mg2+ accumulation.
Figure 7. Mg2+ accumulation in HepG2 cells treated with EtOH, antisense and cycloheximide prior to stimulation for Mg2+ accumulation.
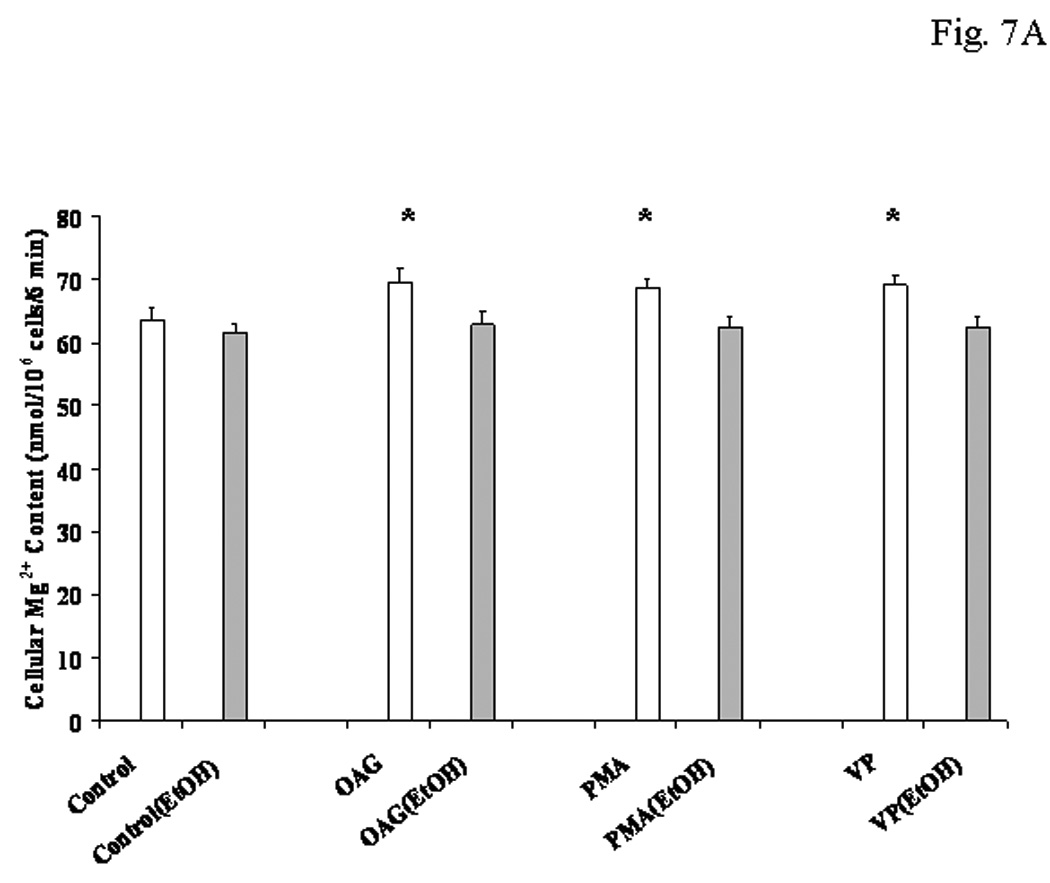
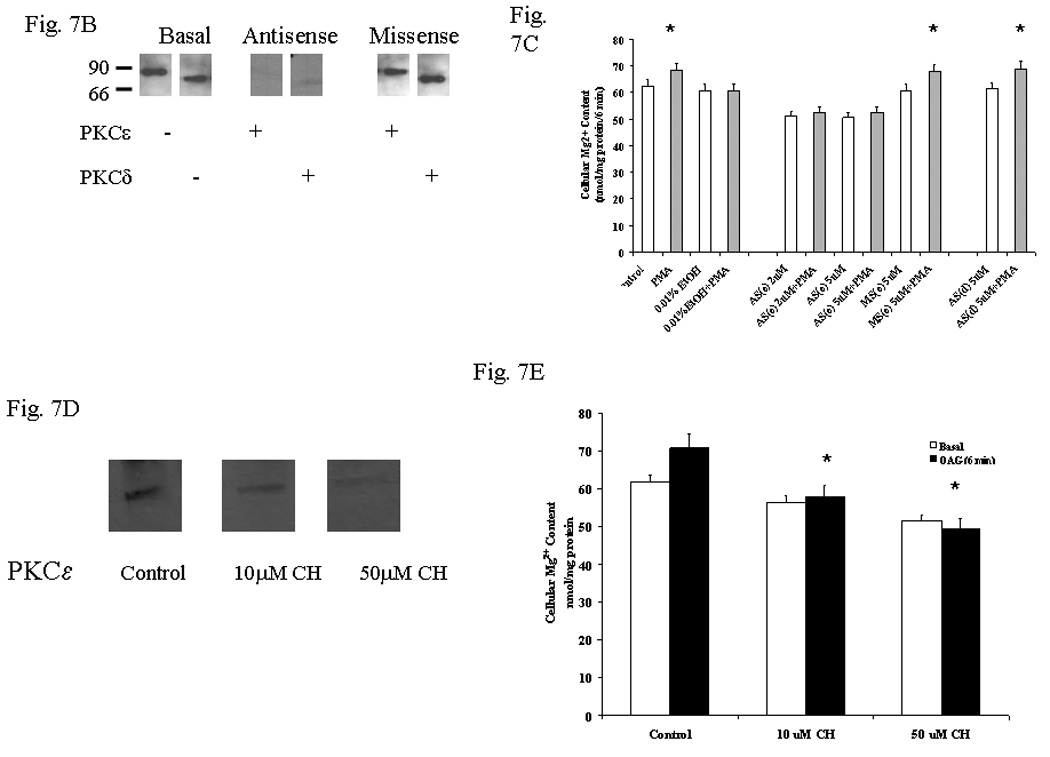
HepG2 cells were pre-treated with 0.01% EtOH for 8 min. The cells were washed and transferred to a new incubation medium containing 1.2mM Mg2+, and stimulated for Mg2+ accumulation. Net Mg2+ accumulation at time 6 min after agonist addition is reported in Fig. 7A. Attenuation of PKCε or PKCδ expression in HepG2 cells treated with the corresponding antisense for 72 hours is reported in Fig. 7B. Net Mg2+ accumulation at time 6 min following OAG or PMA addition to HepG2 cells treated for 72 hours with PKCε or PKCδ antisense is reported in Fig. 7C. HepG2 cells were treated for 72 hours with 10µM or 50µM cycloheximide prior to undergoing OAG stimulation to induced Mg2+ accumulation. Changes in the basal expression of PKCε upon cycloheximide treatment are reported in Fig. 7D. Changes in cellular basal and stimulated Mg2+ accumulation by OAG are reported in Fig. 7E. Data are means±S.E. of 4 different preparations each tested in duplicate for all the experimental conditions reported in Figs. 7A, and 7C. A typical experiment out of three is reported in Figs. 7B and 7D. Data are means±S.E. of 3 different preparations each tested in duplicate for all the experimental conditions reported in Fig. 7E. *Statistically significant vs. corresponding values in control, antisense-treated and cycloheximide-treated samples.
Exposure to EtOH results in the formation of reactive oxygen species (ROS, McCay et al., 1992, Niemela et al., 1998). To determine whether ROS formation and subsequent free radical generation were responsible for preventing PKCε translocation and Mg2+ accumulation, HepG2 cells were pre-incubated for 15 min in the presence of 100µM DTT or 100 µMNAC at 37°C prior to undergoing exposure to 0.01% EtOH for 8 min (Fig. 8). The medium was then replaced with fresh medium, and the cells stimulated for Mg2+ accumulation by addition of PDBU. Pretreatment with DTT or NAC protected PKCε translocation (Fig. 8A) and Mg2+ accumulation (Fig. 8B) from the inhibitory effect of 0.1% EtOH (i.e. a dose 10 fold larger than the one used in many of the experiments reported in this study). The persistence of Mg2+ accumulation and PKCε translocation were associated with reduced levels of oxidative modifications of protein carbonyls (Fig. 8C) and HNE/protein adducts (Fig. 8D). Similar results were obtained in cells stimulated for Mg2+ accumulation by OAG addition (not shown).
Figure 8. Effect of DTT or NAC pre-treatment on Mg2+ accumulation.
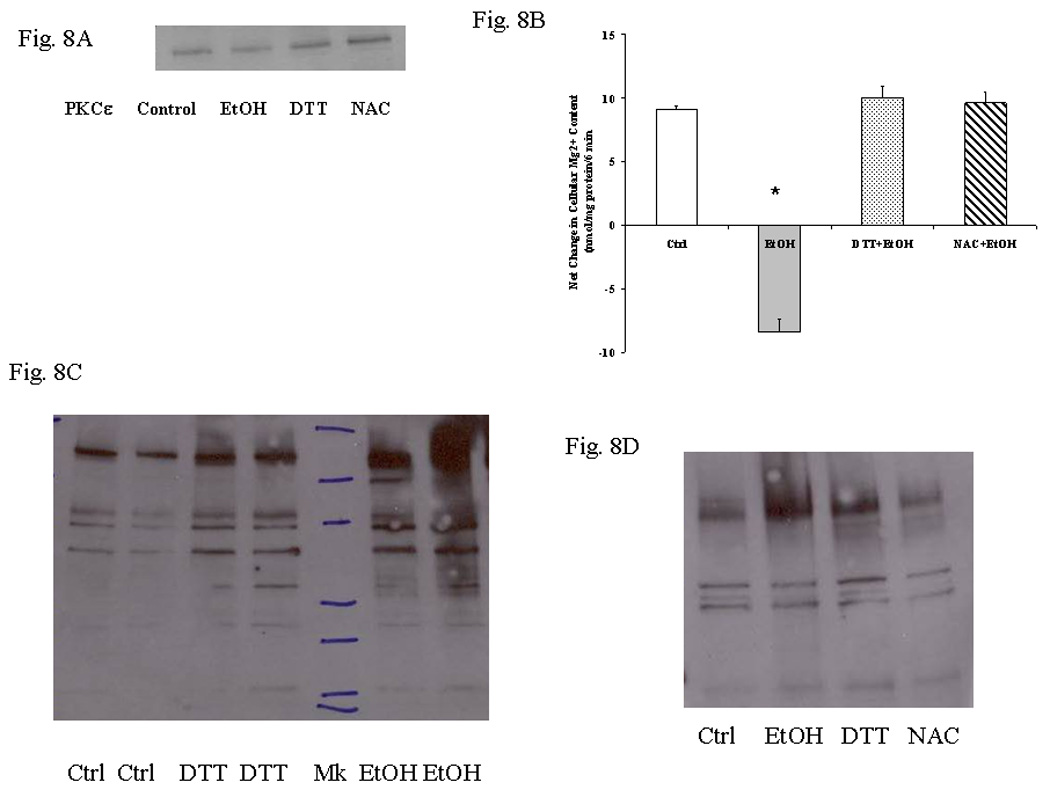
HepG2 cells were pre-treated with 100µM DTT or 100µM NAC for 15 min at 37°C prior to undergoing treatment with 0.01% EtOH for 8 min. Following EtOH exposure the cells were washed and transferred in a medium containing 1.2mM Mg2+ and stimulated for Mg2+ accumulation by addition of 20nM PDBU. PKCε translocation upon PDBU addition is reported in Fig. 8A (one typical experiment out of three is reported). Net Mg2+ accumulation at time=6 min after PDBU addition is reported in Fig. 8B (data are means±S.E. of 4 different preparations for all experimental conditions, each tested in duplicate). Modification of protein carbonyls is reported in Fig. 8C (one typical experiment out of three is reported). Similar results were obtained for NAC-pretreated cells. Formation of HNE/protein adducts is reported in Fig. 8D (one typical experiment out of three is reported). *Statistically significant form Control, DTT and NAC-pretreated samples.
Discussion
Ethanol consumption increases tissue Na+ and Ca2+ content and decreases Mg2+ content within several tissues including liver (Flink, 1986; Gandhi and Ross, 1989; Swann, 1990; Young et al., 2003; Torres et al., 2009). The Mg2+ decrease is associated to a decrease in cellular ATP level (Tessman and Romani, 1998; Young et al., 2003). We have recently reported a delay in the restoration of cellular Mg2+ content upon removal of EtOH from the diet following prolonged exposure (Torres et al., 2009).
The results reported here are the first to indicate that hepatocytes exposed to EtOH in the diet for 3 weeks present a persistent inability to accumulate Mg2+ despite the marked decrease in cellular Mg2+ content. A similar defect can be observed in hepatocytes acutely (8 min) treated with a dose of EtOH as low as 0.01%. This observation and the slow recovery pace (~75 min in the acute model, and more than 10 days in the chronic model) suggest that the Mg2+ entry mechanism and associated signaling pathway are highly sensitive to inhibition by EtOH.
Both EtOH models exhibit a defective translocation of PKCε to the cell membrane upon stimulation with diacylglycerol- analogs, phorbol-myristate derivates, or vasopressin, all agents that induce Mg2+ accumulation in liver cells (Romani et al., 1992; Romani and Scarpa, 2000). The antisense experiments confirmed the specific role of this PKC isoform in modulating Mg2+ accumulation. Interestingly, among all PKC isoforms PKCε is particularly sensitive to cellular Mg2+ level, exhibiting an optimum halfmaximal activation at ~1mM (Konno et al., 1989), the physiological free [Mg2+]i measured in the hepatocyte cytoplasm (Gunther, 1993; Romani and Scarpa, 2000). Ethanol metabolism in liver cells alters the redox state of pyridine nucleotides, which emit at a wavelength a few nanometers away from that of Mag-Fura or Mag-Indo. This has prevented us from measuring a decrease in cytosolic free [Mg2+] in association with the observed decrease in total cellular Mg2+ content, especially in the acute model of EtOH administration. As for the PKC, a defect in this signaling pathway upon EtOH administration has been reported by other groups. Domenicotti et al. (Domenicotti et al., 1996) have reported an inhibitory effect of EtOH on hepatic PKC isoforms including PKCε. While not identifying specific PKC isoforms, Hoek and collaborators (Hoek et al., 1987) have reported that acute treatment of hepatocytes with doses of alcohol in a range consistent with those used in the present study inhibits several PKC-mediated functions for about 60 min, a time frame that is well in agreement with our results. As for the mechanism involved in impairing PKCε signaling several possibilities have to be considered. In the acute model, due to the short time of exposure, the defect most likely lays on a direct effect of EtOH on signaling molecules as opposed to changes in the expression of the protein(s) regulating Mg2+ accumulation. The possibility that the defect depends on EtOH-induced changes in plasma membrane fluidity is not supported by the observation that increasing the temperature of incubation by 1°C, a condition that mimics the change in membrane fluidity induced by 0.7% (~100mM) EtOH (Ingram et al., 1982), does not inhibit Mg2+ accumulation (not shown). Similarly, the persistent decrease in ATP level can play a role in inhibiting Mg2+ uptake in the chronic EtOH model but not in the acute EtOH model in which ATP levels return to pre-EtOH values within 8 min from EtOH addition (Masson et al., 1993; Tessman and Romani, 1998). A likely inhibitory factor could be represented by phosphatidyl-ethanol (PEt), which accumulates within the hepatocyte cell membrane following acute and chronic exposure to ethanol (Omodeo-Sale et al., 1991; Torres et al., 2009), changing membrane composition. While the possibility cannot be excluded that PEt accumulation can have a role in the chronic model of EtOH exposure, the Km of PLD for EtOH (i.e. ~50mM in intact cells, Moehren et al., 1994) cannot be fully reconciled with the acute inhibition observed in the presence of 0.01% (or ~1.5mM) EtOH. The formation of hydroxyl-ethyl radicals (McCay et al., 1992) or adducts between HNE and proteins or phospholipids at the plasma membrane level (Niemela et al., 1998) constitute alternative and not mutually exclusive modalities of EtOH-induced inhibition. The time course for the formation and removal of these radicals is also within the time frame of recovery reported here for Mg2+ accumulation (McCay et al., 1992; Niemela et al., 1998; Torres et al., 2009). As the protective pretreatment with DTT and NAC indicate, the formation of HNE/protein adducts and the modification of protein carbonyls following EtOH exposure appear to be directly or indirectly involved in inhibiting PKCε translocation and Mg2+ accumulation. While it would presently be premature to drawn any conclusion due to the limited information provided here, this observation would be in potential agreement with a role of reactive oxygen species in promoting activation or translocation of specific PKC isoforms. Our assessment of oxidative damage focused on protein modifications. Yet, it has to be kept in mind that modifications of membrane phopholipids are integral part of free radical induced lipid peroxidation and HNE formation, and can contribute significantly to impairing Mg2+ accumulation. Because of the observed modifications of protein carbonyls and formation of HNE/protein adducts, an effect of EtOH on the signaling machinery and the entry mechanism involved in Mg2+ accumulation cannot be excluded. In addition, EtOH has been reported to translocate RACK prior to binding to the related PKC isoform, preventing its translocation and compromising its signaling (Ron et al., 2000). As for the modality of cellular Mg2+ accumulation, several entry mechanisms have recently been identified (reviewed in Romani, 2007). Among these mechanisms, TRPM7, a member of the melastatin subfamily of TRP channels, needs particular mention. This channel is ubiquitous in mammalian cells (Romani, 2007), and its presence and operation have recently been described in hepatocytes (Mishra et al., 2009). TRPM7 is highly homologous to TRPM6, another member of the same TRP subfamily responsible for accumulating Mg2+ specifically in kidney and colon (Romani, 2007). Recent evidence indicates that the activity of TRPM6 and possibly TRPM7 can be inhibited by RACK1 in the absence of PKC activation (Cao et al., 2008). Hence, a defect in PKCε translocation as observed upon EtOH administration may promote the alternative binding of RACK1 to TRPM7 and its inhibition. Work is in progress in our laboratory to test this hypothesis.
Lastly, it should be mentioned that the time-frame necessary for Mg2+ accumulation to return to normal level in the chronic EtOH model would also be consistent with the neo-synthesis and expression of signaling components and/or Mg2+ transport mechanisms to replace protein copies possibly modified by hydroxyl-ethyl radical or HNE.
Conclusions
For the first time, the results reported here: 1) identify PKCε as the isoform involved in Mg2+ accumulation in liver cells; and 2) elucidate the mechanism by which acute and chronic ethanol administration impair Mg2+ accumulation in liver cells. It remains to be determined whether an increase in dietary Mg2+ level can promote a faster recovery of Mg2+ homeostasis upon EtOH administration.
Based upon these results, a complex scenario can be envisioned whereby EtOH impairs hepatic Mg2+ accumulation and homeostasis by dys-regulating PKCε signaling. In turn, the decrease in cellular Mg2+ level would affect the activity of PKCε and other Mg2+-regulated cellular enzymes involved in cell cycle and protein synthesis (Wolf and Trapani, 2008), further disrupting hepatocyte functions and possibly contributing to the onset of alcohol-related liver pathologies. The identification of the PKC isoform mediating Mg2+ accumulation may represent a novel therapeutic target to possibly accelerate the recovery of Mg2+ homeostasis and its beneficial effects, at least at the hepatic level.
Acknowledgments
Grant Support: NIAAA-11593
Footnotes
Disclosure: Authors have nothing to disclose
Abbreviations used in the text
EtOH = ethanol; AAS = atomic absorbance spectrophotometry; OAG = oleyl-acetyl-glycerol; PDBU = phorbol 12, 13-dibutyrate; PMA = phorbol-myristate acetate; CCH = carbachol; VP = vasopressin; FCCP = carbonyl cyanide p-trifluoromethoxyphenylhydrazone; 4-MP = 4-methyl-pyrazole; PEt = phosphatidylethanol; RACK = receptor for activated protein kinase C; HNE = 4-hydroxy-nonenal; DTT = dithiothreitol; NAC = N-acetyl-cisteine.
References
- Cao G, Thebault S, van der Wijst J, van der Kemp A-M, Lasonder E, Bindels RJM. RACK1 inhibits TRPM6 activity via phosphorylation of the fused alpha-kinase domain. Curr Biol. 2008;18:168–178. doi: 10.1016/j.cub.2007.12.058. [DOI] [PubMed] [Google Scholar]
- Cefaratti C, Romani A. Functional characterization of two distinct Mg2+ extrusion mechanisms in cardiac sarcolemmal vesicles. Mol Cell Biochem. 2007;303:63–72. doi: 10.1007/s11010-007-9456-z. [DOI] [PubMed] [Google Scholar]
- Csermely P, Fodor P, Somogyi J. The tumor promoter tetradecanoylphorbol-13 acetate elicits the redistribution of heavy metal in subcellular fractions of rabbit thymocytes as measured by plasma emission spectroscopy. Carcinogenesis. 1987;8:1663–1666. doi: 10.1093/carcin/8.11.1663. [DOI] [PubMed] [Google Scholar]
- Díaz-Guerra MJ, Junco M, Boscá L. Oleic acid promotes changes in the subcellular distribution of protein kinase C in isolated hepatocytes. J Biol Chem. 1991;266:23568–23576. [PubMed] [Google Scholar]
- Domenicotti C, Paola D, Lamedica A, Ricciarelli R, Chiarpotto E, Marinari UM, Poli G, Melloni E, Pronzato MA. Effects of ethanol metabolism on PKC activity in isolated rat hepatocytes. Chem Biol Interact. 1996;100:155–163. doi: 10.1016/0009-2797(96)03696-4. [DOI] [PubMed] [Google Scholar]
- Flatman PW. Mechanisms of magnesium transport. Annu Rev Physiol. 1991;53:259–271. doi: 10.1146/annurev.ph.53.030191.001355. [DOI] [PubMed] [Google Scholar]
- Flink EB. Magnesium deficiency in alcoholism. Alcohol Clin Exp Res. 1986;10:590–594. doi: 10.1111/j.1530-0277.1986.tb05150.x. [DOI] [PubMed] [Google Scholar]
- Gandhi CR, Ross CH. Influence of ethanol on calcium, inositol phospholipids and intracellular signalling mechanisms. Experentia. 1989;45:407–413. doi: 10.1007/BF01952021. [DOI] [PubMed] [Google Scholar]
- Grubbs RD, Maguire ME. Regulation of magnesium but not calcium transport by phorbol ester. J Biol Chem. 1986;261:12550–12554. [PubMed] [Google Scholar]
- Gunther T. Mechanisms and regulation of Mg2+ efflux and Mg2+ influx Miner. Electrol Metab. 1993;19:256–265. [PubMed] [Google Scholar]
- Hoek JB, Thomas AP, Rubin R, Rubin E. Ethanol-induced mobilization of calcium by activation of phosphoinositide-specific phospholipase C in intact hepatocytes. J Biol Chem. 1987;262:682–691. [PubMed] [Google Scholar]
- Ingram LO, Carey VC, Dombek KM. On the relationship between alcohol narcosis and membrane fluidity. Subst Alcohol Actions Misuse. 1982;3:213–224. [PubMed] [Google Scholar]
- Konno Y, Ohno S, Akita Y, Kawasaki H, Suzuki K. Enzymatic properties of a novel phorbol ester receptor/protein kinase, nPKC. J Biochem (Tokyo) 1989;106:673–678. doi: 10.1093/oxfordjournals.jbchem.a122915. [DOI] [PubMed] [Google Scholar]
- Lashin O, Szweda P, Szweda LI, Romani A. Decline in cardiac mitochondrial respiratory function of streptozotocin diabetic rats: 4-HNE modification of FAD containing subunit of succinate dehydrogenase. Free Rad Biol Med. 2006;40:886–896. [Google Scholar]
- Lowry OH, Rosenbrough NJ, Farr AL, Randall RJ. Protein measurement with the Folin phenol reagent. J Biol Chem. 1951;193:265–275. [PubMed] [Google Scholar]
- Masson S, Desmoulin F, Sciaky M, Cozzone PJ. Catabolism of adenine nucleotides and its relation with intracellular phosphorylated metabolite concentration during ethanol oxidation in perfused rat liver. Biochemistry. 1993;32:1025–1031. doi: 10.1021/bi00055a005. [DOI] [PubMed] [Google Scholar]
- McCay PB, Reinke LA, Rau JM. Hydroxyl radicals are generated by hepatic microsomes during NADPH oxidation: relationship to ethanol metabolism. Free Rad Res Commun. 1992;15:335–346. doi: 10.3109/10715769209049149. [DOI] [PubMed] [Google Scholar]
- Mishra R, Rao V, Ta R, Shobehiri N, Hill CE. A Mg2+- and MgATP-inhibited and Ca2+/calmodulin-sensitive TRPM7-like current in hepatoma and hepatocytes. Am J Physiol. 2009 doi: 10.1152/ajpgi.90683.2008. in press. [DOI] [PubMed] [Google Scholar]
- Moehren G, Gustavsson L, Hoek JB. Activation and desensitization of phospholipase D in intact rat hepatocytes. J Biol Chem. 1994;269:838–848. [PubMed] [Google Scholar]
- Niemela O, Parkkila S, Pasanen M, Iimuro Y, Bradford B, Thurman RG. Early alcoholic liver injury: formation of protein adducts with acetaldehyde and lipid peroxidation products, and expression of CYP2E1 and CYP3A. Alcohol Clin Exp Res. 1998;22:2118–2124. doi: 10.1111/j.1530-0277.1998.tb05925.x. [DOI] [PubMed] [Google Scholar]
- Omodeo-Sale F, Lindi C, Palestini P, Masserini M. Role of phosphatidylethanol in membranes. Effects on membrane fluidity, tolerance to ethanol, and activity of membrane-bound enzymes. Biochemistry. 1991;30:2477–2482. doi: 10.1021/bi00223a026. [DOI] [PubMed] [Google Scholar]
- Parada CA, Yeh JJ, Rechling DB, Levine JD. Transient attenuation of protein kinase Cepsilon can terminate a chronic hyperalgesic state in the rat. Neuroscience. 2003;120:219–226. doi: 10.1016/s0306-4522(03)00267-7. [DOI] [PubMed] [Google Scholar]
- Pessino A, Passalacqua M, Sparatore B, Patrone M, Melloni E, Pontremoli S. Antisense oligodeoxynucleotide inhibition of delta protein kinase C expression accelerates induced differentiation of murine erythroleukaemia cells. Biochem J. 1995;312:549–554. doi: 10.1042/bj3120549. [DOI] [PMC free article] [PubMed] [Google Scholar]
- Romani A, Marfella C, Scarpa A. Regulation of Mg2+ uptake in isolated rat myocytes and hepatocytes by protein kinase C. FEBS Lett. 1992;296:135–140. doi: 10.1016/0014-5793(92)80364-m. [DOI] [PubMed] [Google Scholar]
- Romani A. Regulation of magnesium homeostasis and transport in mammalian cells. Arch Biochem Biophys. 2007;458:90–102. doi: 10.1016/j.abb.2006.07.012. [DOI] [PubMed] [Google Scholar]
- Romani A, Scarpa A. Hormonal control of Mg2+ in the heart. Nature. 1990;346:841–844. doi: 10.1038/346841a0. [DOI] [PubMed] [Google Scholar]
- Romani A, Scarpa A. Regulation of cellular magnesium Front. Biosci. 2000;5:d720–d734. doi: 10.2741/romani. [DOI] [PubMed] [Google Scholar]
- Ron D, Vagts AJ, Dohrman DP, Yaka R, Jiang Z, Yao L, Crabbe J, Grisel JE, Diamond I. Uncoupling of betaIIPKC from its targeting protein RACK1 in response to ethanol in cultured cells and mouse brain. FASEB J. 2000;14:2303–2314. doi: 10.1096/fj.00-0143com. [DOI] [PubMed] [Google Scholar]
- Swann AC. Ethanol and Na+/K+-ATPase: alteration of Na+-K+ selectivity. Alcohol Clin Exp Res. 1990;14:922–927. doi: 10.1111/j.1530-0277.1990.tb01839.x. [DOI] [PubMed] [Google Scholar]
- Tang EY, Parker PJ, Beattie J, Houslay MD. Diabetes induces selective alterations in the expression of protein kinase C isoforms in hepatocytes. FEBS Lett. 1993;326:117–123. doi: 10.1016/0014-5793(93)81774-t. [DOI] [PubMed] [Google Scholar]
- Tessman PA, Romani A. Acute effect of EtOH on Mg2+ homeostasis in liver cells: Evidence for the activation of an Na+/Mg2+ exchanger. Am J Physiol. 1998;275:G1106–G1116. doi: 10.1152/ajpgi.1998.275.5.G1106. [DOI] [PubMed] [Google Scholar]
- Torres LM, Cefaratti C, Berti-Mattera LN, Romani A. Delayed restoration of Mg2+ homeostasis and transport in liver cells treated with EtOH. Am J Physiol. 2009 doi: 10.1152/ajpgi.90652.2008. in press. [DOI] [PMC free article] [PubMed] [Google Scholar]
- Wolf FI, Trapani V. Cell (patho)physiology of magnesium. Clin Sci (Lond) 2008;114:27–35. doi: 10.1042/CS20070129. [DOI] [PubMed] [Google Scholar]
- Young A, Berti-Mattera LN, Romani A. Effect of repeated doses of ethanol on hepatic Mg2+ homeostasis and mobilization. Alcohol Clin Exp Res. 2007;31:1240–1251. doi: 10.1111/j.1530-0277.2007.00408.x. [DOI] [PubMed] [Google Scholar]
- Young A, Cefaratti C, Romani A. Chronic EtOH administration alters liver Mg2+ homeostasis. Am J Physiol. 2003;284:G57–G67. doi: 10.1152/ajpgi.00153.2002. [DOI] [PubMed] [Google Scholar]
- Zou LY, Wu L, Altura BT, Barbour RL, Altura BM. Beneficial effect of high magnesium on alcohol-idnuced cardiac failure. Magnes Trace Elem. 1991–1992;10:409–419. [PubMed] [Google Scholar]