

SUMMARY
To understand fine-scale structure and function of single mammalian neuronal networks, we developed and validated a novel strategy to genetically target and trace monosynaptic inputs to a single neuron in vitro and in vivo. The strategy independently targets a neuron and its presynaptic network for specific gene expression and fine-scale labeling, using single-cell electroporation of DNA to target infection and monosynaptic retrograde spread of a genetically modifiable rabies virus. The technique is highly reliable, with transsynaptic labeling occurring in every electroporated neuron infected by the virus. Targeting single neocortical neuronal networks in vivo, we found clusters of both spiny and aspiny neurons surrounding the electroporated neuron in each case, in addition to intricately-labeled distal cortical and subcortical inputs. The broad applicability of this technique to probe and manipulate single neuronal networks with single-cell resolution in vivo may shed new light on fundamental mechanisms underlying circuit development and information processing by neuronal networks throughout the brain.
INTRODUCTION
A single mammalian neuron maintains as many as thousands of input synapses and integrates combinations of activity from these inputs in time to determine the probability that it will fire an action potential at any given moment. This input-dependent computation occurs for every neuron continuously over time, and forms the basis for the diverse and complex computations performed by neuronal networks throughout the brain (Somogyi et al., 1998). Each single neuronal network exists in a tangled web of as many as trillions of connections between billions of neurons spanning the entire brain confounding attempts to identify detailed circuits and relate circuits to function in vivo. We sought to overcome this technological barrier and facilitate the direct analysis of the fine scale structure and function of single neuronal networks by developing and validating a robust and reliable technique to target a single neuron and its monosynaptic inputs for independent gene expression and detailed cell labeling both in vitro and in vivo. Identifying and genetically targeting single neuronal networks in vivo will hasten understanding the link between connectivity and function of neuronal networks with single cell resolution in the intact brain. Targeting a single neuron and its direct inputs for gene expression provides a means to probe and manipulate neuronal spiking behavior and draw cause-effect relationships between pre and postsynaptic activity. Furthermore, it can be used to determine the role of specific proteins in the input-dependent synaptic development and computation of single neurons. Here, we demonstrate a novel strategy for robust and efficient single microcircuit targeting. We exhibit the utility of the technique by mapping monosynaptic inputs to single layer 2/3 pyramidal neurons in mouse neocortex, in vivo. We identify a variety of cell types that directly connect to these neurons, including local inputs predicted by other methods, and more distant inputs described here for the first time.
To date, the most detailed studies of brain microcircuitry have relied on multiunit recordings in brain slice preparations. These studies have begun to forge a map of connectivity distributions between several distinct neuronal cell types in different brain areas, and described fundamental mechanisms of information processing by single neurons (Brown and Hestrin, 2009a; Thomson and Lamy, 2007). Moreover, these studies have revealed that even neighboring neurons connect to each other only in a minority of cases (Markram et al., 1997; Song et al., 2005; Thomson et al., 1993; Yoshimura and Callaway, 2005; Yoshimura et al., 2005). Nevertheless, the connections which are identified are not random; connections differ according to cell type and can form precise subnetworks (Brown and Hestrin, 2009b; Kampa et al., 2006; Kozloski et al., 2001; Lefort et al., 2009; Petreanu et al., 2007; Petreanu et al., 2009; Song et al., 2005; Thomson and Lamy, 2007; Thomson et al., 2002; Wang et al., 2006; Yoshimura and Callaway, 2005; Yoshimura et al., 2005). However, the conclusions that can be drawn from these studies are limited because they do not examine the relationship between connectivity and function in the intact, functioning brain. Furthermore, slicing the brain severs connections with distant structures and between a significant population of nearby neurons (Stepanyants et al., 2009). As a result, characterization of functional properties of synaptic connections or integration of inputs from multiple sources is limited to cell pairs that can be readily sampled, making it impractical to sample large populations of connected neurons, or connections that occur at low probabilities or originate from distant sources (Thomson and Lamy, 2007). Slicing the brain also correlates with a substantial, rapid increase in synapse number compared to tissue fixed in vivo (Kirov et al., 1999), and the effects of this rapid synaptogenesis on single-cell connectivity distributions are unknown.
To overcome these limitations and provide a means for studying the connectivity and function of single neuronal networks in the intact brain, we developed and implemented a novel method for determining the monosynaptic inputs to a single neuron in vivo. The method labels the fine scale morphology of traced neurons permitting detailed anatomical characterization and also allows both a single neuron and its input neuron population to be manipulated genetically. Furthermore, the technique is applicable across neuronal cell types throughout the brain, and across species, and may be compatible with functional analyses of labeled cells. By tracing the inputs to single neurons within and across different neuronal cell classes and brain regions, it will be possible to answer many longstanding questions about fine scale connectivity throughout the nervous system. Genetically targeting a single neuron and its input population should make it possible to study the function of different cell types and specific genes as they relate to connectivity, synaptic development, and information processing. For example, it may provide a means to probe and manipulate the function of neurons within a targeted network in combination with existing genetic technologies in order to understand how single neurons integrate their specific inputs in time to generate their unique output firing pattern. Modulating gene expression patterns of specific proteins in either the postsynaptic neuron or the entire targeted microcircuit makes it possible to test the role of different proteins (e.g., specific ion channels or proteins related to synapse development and maintenance) on the input-specific computation performed by the postsynaptic neuron. Understanding how distinct cell types, particular genes, intrinsic cellular properties, and patterns of synaptic input influence information processing by neurons within identified microcircuits will provide insights into the basic mechanisms employed by the brain to perform the diversity of computations necessary for its function.
Single Cell Tracing Strategy
The single cell tracing strategy we demonstrate here develops upon two foremost genetic technologies to target independent gene expression to a single neuron and its monosynaptic neuronal inputs: in vivo two-photon guided single cell electroporation (Kitamura et al., 2008), and a genetically engineered variant of rabies virus that restricts retrograde tracing to the monosynaptic inputs of a genetically targeted neuronal population (Wickersham et al., 2007b).
Single Cell Electroporation
Within the last decade, single cell electroporation has been developed as an efficient transfection method of single cells in primary cell culture, brain slice culture, and most recently, in the living rodent (Kitamura et al., 2008; Rae and Levis, 2002; Rathenberg et al., 2003). By balancing the parameters necessary to promote efficient gene delivery and optimize cell viability, these studies have demonstrated reliable and effective methods for transfecting single neurons with one or more genes across a variety of cell types, brain regions and species (Haas et al., 2001; Judkewitz et al., 2009; Kitamura et al., 2008; Rathenberg et al., 2003). Using single cell electroporation, it has also been possible to knockdown gene expression via RNA interference in single neurons in neocortical and cerebellar cell cultures (Boudes et al 2008, Tanaka et al 2009), and deliver dyes, calcium indicators and activity modulators (e.g., channelrhodipsin-2 (ChR2)) to study neuronal function in vivo (Judkewitz et al., 2009; Kitamura et al., 2008; Nevian and Helmchen, 2007). The wide applicability of single cell electroporation to manipulate single neurons throughout the nervous system makes it a powerful tool for targeting and studying single neurons. Here, we applied single cell electroporation to transfect a single neuron with genes to target infection and transsynaptic spread of a monosynaptic, retrograde tracing rabies virus so as to isolate a single neuron and its direct presynaptic inputs for anatomical, functional and genetic analyses.
Monosynaptic Tracing Rabies Virus
Wild-type rabies is a neurotropic virus that specifically infects neurons via their axon terminals, and propagates exclusively in the retrograde direction—from a host neuron to its presynaptic inputs, making it a powerful, natural neuronal circuit tracer (Kelly and Strick, 2000; Ugolini, 1995). Wild-type rabies has been used to map connectivity between a variety of cortical and subcortical brain areas in several species (Astic et al., 1993; Kelly and Strick, 2003; Nassi and Callaway, 2006; Ugolini, 1995). In order to more precisely map neuronal connectivity at the microcircuit level, rabies virus has been modified in several ways to provide greater control over the infection and transsynaptic spread of the virus. A genetically modified version of the virus has been produced, deleting the rabies glycoprotein gene (G) from the rabies negative-sense RNA genome and replacing it with the gene for a fluorescent marker protein to limit transsynaptic spread and intricately label infected neurons (Wickersham et al., 2007a). Expression of the glycoprotein gene on the surface of the virus is necessary for the rabies virus to infect other neurons, and confers the virus’ characteristic transsynaptic infection (Mebatsion et al., 1996a; Wickersham et al., 2007a). To restrict initial infection of the virus to a genetically targeted population of neurons, the glycoprotein was replaced on the surface of the G-deleted virus with an envelope protein from an avian virus (Wickersham et al., 2007b). In this study, Wickersham et al., 2007b targeted a population of neurons in vitro for virus infection by biolistics transfection of the highly specific receptor TVA for the avian sarcoma and leukosis virus envelope protein EnvA (Lewis et al., 2001; Young et al., 1993), which had been coated on G-deleted rabies virus by a pseudotyping strategy. Since mammalian neurons do not naturally express the TVA receptor, and thus are not normally infected by EnvA coated virus, the EnvA pseudotyped G-deleted virus (SADΔG-EGFP(EnvA)) only infected the neurons expressing the TVA receptor from biolistics transfection. By co-transfecting the gene for the rabies glycoprotein in the same neurons, the G-deleted virus produced glycoprotein coated virus particles in these neurons that were able to transsynaptically infect presynaptic neurons. Since the G-deleted virus did not carry the glycoprotein gene itself, and the gene was not transfected in the presynaptic neurons by any other means, the virus was trapped in the monosynaptic inputs to the originally infected neuron population, and did not infect further connections. Since the virus also expressed the gene for EGFP, all infected neurons were labeled in great detail. Co-transfecting a red fluorescent marker in the biolistics step labeled the postsynaptic neurons uniquely. Using this labeling to guide paired recordings between nearby pre and postsynaptic neurons proved that the labeled neurons were functionally and monosynaptically connected (Wickersham et al., 2007b).
Single Cell Tracing Strategy - Method Paradigm
Here, we established a method for limiting initial infection of the EnvA pseudotyped G-deleted rabies virus to a single neuron both in vitro and in the living rodent, so as to target a single neuron and its monosynaptic inputs for interrogation in vitro and in vivo. By adapting protocols for single cell electroporation and determining the parameters necessary for efficient in vivo expression of multiple electroporated genes and viral infection of a single neuron, we developed and validated a robust and reliable technique to genetically target and intricately label single neuronal networks in vitro and in vivo.
The single cell tracing strategy relies on three steps (Figure 1). First, a single neuron is targeted for expression of three genes by single cell electroporation of plasmid DNA (Figure 1A). The three genes encode for: 1) a marker fluorescent protein (XFP), 2) an avian virus receptor (TVA), and 3) the rabies glycoprotein (G). Second, one to three days later only the electroporated neuron is infected with a G-deleted rabies virus, pseudotyped with the avian sarcoma and leukosis virus (ASLV-A) glycoprotein, EnvA (Figure 1B). This virus is termed SADΔG-XFP(EnvA), and can be modified to encode a gene of interest in the glycoprotein locus (Wickersham et al., 2007a; Wickersham et al., 2007b; Mebatsion et al., 1996b; unpublished observations, T.M. and E.M.C.). The virus only infects the electroporated neuron and no other cells because the EnvA coated virus requires the TVA receptor to mediate infection, and the electroporated neuron is the only cell expressing this receptor (Wickersham et al., 2007b; Young et al., 1993). The virus replicates in the electroporated host neuron and uses the rabies glycoprotein expressed from the electroporated plasmids to retrogradely infect directly presynaptic neurons and label them with a unique fluorescent marker protein encoded in the rabies genome. The virus does not spread from these neurons to any further connections because these neurons lack the glycoprotein gene, which is necessary for transsynaptic infection. Lastly, after 3–6 days the tissue is fixed in paraformaldehyde and analyzed for fluorescent gene expression (Figure 1C). Here, we developed parameters for single cell electroporation in brain slice culture and in vivo in the living rodent to introduce the three genes into single cortical neurons both in vitro and in vivo. We applied the EnvA pseudotyped G-deleted rabies virus (SADΔG-XFP(EnvA)) to infect these cells and to transsynaptically label their direct, presynaptic inputs. Furthermore, we tested the reliability of the experimental strategy and robustness of cell labeling of proximal and distal inputs of varying cell type.
Figure 1. Single Cell Tracing Strategy.

(A) A single neuron is electroporated with plasmids (colored circles) coding for a fluorescent marker (e.g., pCAG-mCherry), the TVA receptor (pCMMP-TVA800), and the rabies glycoprotein (pHCMV-RabiesG).
(B) After 1–3 days, SADΔG-XFP(EnvA) virus is applied to the tissue, and infects only the electroporated neuron, since no other cells express the EnvA receptor, TVA (red indicates electroporated marker expression; black symbols, TVA and rabies glycoprotein (G)). As the virus replicates in the host neuron, it expresses XFP from the rabies genome, labeling the neuron (green in (C); merge yellow with electroporated marker).
(C) After 3–6 days, the tissue is fixed with paraformaldehyde after time has elapsed for transsynaptic infection (dotted arrow) and expression of the rabies virus and the tissue is visualized with fluorescence microscopy. The virus only transsynaptically infects and labels direct monosynaptic, presynaptic inputs (green) to the original host neuron, and not secondary connections (red crosses) because rabies glycoprotein, which is necessary for transsynaptic spread, is expressed only in the electroporated neuron. The schematic shows the timeline and gene constructs used for the experiment in Figure 4.
RESULTS
Tracing monosynaptic inputs to single neurons in cortical slice culture
We established the single cell tracing strategy in vitro by first targeting several neurons for single cell electroporation in each cortical brain slice culture. A 10–12 MΩ patch pipette containing intracellular solution and plasmid DNA (pCMMP-TVA800 [75–150 ng/μl], pHCMV-RabiesG [50–100 ng/μl] and pCAG-venusYFP [50–100 ng/μl]) was advanced toward a cell body with a small amount of positive pressure applied until the resistance of the electrode increased by 20–30%. At this point, the pressure on the pipette was released and electroporation pulses were delivered with the following parameters: −10 to −12 V square 0.5–1 ms pulses at 100 Hz for 1 s. The single cell electroporation parameters used here were adapted from a combination of parameters used previously for single cell electroporation of plasmid DNA, using a novel set of plasmids (Kitamura et al., 2008; Rae and Levis, 2002; Rathenberg et al., 2003). The pipette was withdrawn and exchanged if necessary, and another cell was targeted for electroporation. Slices were incubated for 24–48 hours after electroporation in order to allow time for gene expression. Then, 200 μl/well of SADΔG-mCherry(EnvA) was applied to the brain slices. The slices were further incubated for 3 to 6 days to permit retrograde labeling by the virus, and then were fixed in 4% paraformaldehyde in phosphate buffer, antibody stained to increase fluorescent signal and mounted on glass slides (See Experimental Procedures).
Visualized under epifluorescence microscopy, several slices contained 1–13 neurons labeled with YFP from the electroporation transfection. In most of these cases, these neurons also expressed mCherry from the rabies genome, and a dense cluster of mCherry expressing neurons surrounded each electroporated neuron (Figure 2A and 2B). The morphology of the traced neurons was labeled in great detail, as can be seen in the higher magnification image in Figure 2B. These results are qualitatively similar to previous results demonstrating the monosynaptic tracing strategy in cortical brain slice culture using biolistics transfection of a sparse population of neurons in each slice (Wickersham et al., 2007b). Unlike the previous report which could not reliably target just one neuron, using single cell electroporation made it possible to target a single neuron in a slice by electroporating only one cell per slice followed by applying the modified rabies virus 2 days later (Figure 2C). The ability to target a single neuron for transsynaptic, retrograde labeling provides a way to unambiguously determine the direct inputs to a single neuron. This is in contrast to the previous report which required a second method to confirm connectivity between labeled neurons (e.g., paired recordings), since it was unclear which of the multiple biolistics transfected neurons was the postsynaptic partner for each transsynaptically labeled neuron. The labeling from electroporation was sufficient to follow the axons of electroporated neurons for several hundreds of microns across the slice, and the virus labeled presynaptic neurons up to several hundreds of microns away from the host neuron (Figure S1). Overall, the transfection rate of single cell electroporation for these experiments, determined by the expression of YFP in the fixed tissue was 18.5% (22/119). Of these successfully transfected 22 neurons, 14 also expressed mCherry (64%) indicating viral infection, and transsynaptic spread occurred in all slices that contained dual labeled neurons. The remaining neurons that expressed YFP but did not express mCherry tended to show dimmer YFP fluorescence than the dual labeled neurons (e.g. white arrow in Figure 2B), suggesting that lower expression of the gene constructs, including TVA, might have reduced the probability of infection by SADΔG-mCherry(EnvA). Slices that showed no expression of the electroporation constructs had no expression of mCherry from the rabies genome in any cells (n = 16 slices, data not shown) further supporting previously published evidence that EnvA pseudotyped virus does not infect cells in the absence of TVA (Lewis et al., 2001; Wickersham et al., 2007b).
Figure 2. Tracing the Monosynaptic Inputs to Single Neurons in Rat Cortical Slice Culture.

(A) Twenty-one neurons were electroporated one by one with plasmids encoding venusYFP, TVA and rabies glycoprotein in a single slice. Two days later, SADΔG-mCherry(EnvA) was applied to the slice. After an additional six days, the slice was fixed in paraformaldehyde. Thirteen neurons expressed venusYFP from the electroporation transfection (green or yellow), and 8 neurons were confirmed to show co-expression of both the electroporated and rabies markers (yellow). Approximately 1000 neurons were infected transsynaptically by the virus and expressed mCherry (red).
(B) Higher magnification of box in (A) showing 5 out of the 13 transfected neurons (green or yellow) surrounded by a dense cluster of mCherry expressing neurons (red). Four of these five neurons also showed mCherry expression (yellow). One neuron (white arrow, green) showed low expression of venusYFP and did not show expression of mCherry.
(C) A different slice in which only one neuron (yellow) was electroporated with plasmids encoding venusYFP, TVA and rabies glycoprotein in a single slice. Two days later, SADΔG-mCherry(EnvA) was applied directly to the slice. After four additional days, the slice was fixed in paraformaldehyde. The electroporated neuron expressed both venusYFP (green) and mCherry (red) indicating successful transfection and virus infection (merged = yellow). Dozens of neurons were infected transsynaptically by the virus and expressed mCherry, displayed in red (n = 36; some not shown here, see supplementary Figure S1 which shows more transsynaptically labeled neurons and the extent of axonal labeling of the same electroporated neuron). Scale bars: 500 μm in (A), 50 μm in (B), 100 μm in (C).
These results show that the infection and monosynaptic retrograde spread of the EnvA pseudotyped, G-deleted rabies virus can be targeted to a single neuron in a cultured brain slice. Tracing the inputs to a single neuron using single cell electroporation in a slice provides a standalone method to identify monosynaptic inputs to a single neuron, and removes the ambiguity present in other methods that transfect a population of neurons with TVA and thus cannot distinguish connectivity relationships at the single cell level. The optimal single cell tracing parameters determined in culture were used to help establish an efficient strategy for targeting the inputs to a single neuron in vivo, described below.
Tracing monosynaptic inputs to single neurons in vivo
To trace monosynaptic inputs to a single neuron in vivo, we used the ‘shadow patching’ technique visualized under two-photon microscopy (Kitamura et al., 2008), to target a single neuron for electroporation with a patch pipette in each anesthetized C57 BL/6 mouse (Figure 3 and Movie S1; see Supplemental Experimental Procedures for animal care). Importantly, only one neuron was electroporated in each animal for tracing experiments. A 10–12 MΩ patch pipette was filled with intracellular solution, 50 μM of Alexa Fluor 488 or 594 dye, and 450 ng/μl of plasmid DNA (either 450 ng/μl of pCAG-YTB, a single plasmid expressing the 3 genes: venusYFP, TVA and RabiesG, or 150 ng/μl of each of the following plasmids: pCMMP-TVA800, pHCMV-RabiesG, and either pCAG-mCherry or pCAG-venusYFP, see Experimental Procedures). The pipette was advanced in the brain until the tip reached layer 2/3 of primary visual cortex (V1), and positive pressure was applied to the back of the pipette to fill the extracellular space with dye. Given that the dye is not actively taken up by neurons and instead accumulates in the extracellular space, the cells appeared as dark shadows on a bright background in the thin optical slice (Figure 3B and Movie S1) (Kitamura et al., 2008; Nevian and Helmchen, 2007). A cell with large round cell body morphology (i.e., likely pyramidal neuron) was selected near the location of the tip. The pipette was advanced toward the cell under visual control until the resistance of the electrode increased by 20–30% (e.g. a total resistance of 13 MΩ for a 10 MΩ pipette), the 20 mmHg of pressure maintained on the pipette was released and the electroporation pulses were delivered (−12 V square wave 500 μs pulses delivered at 50 or 100 Hz for 1 s (Judkewitz et al., 2009; Kitamura et al., 2008)). Electroporation success was verified by immediate filling of the soma with Alexa dye (Figure 3B3 and Movie S1). The pipette was withdrawn promptly with special care not to disturb the cell’s membrane. The location of the cell was documented, in some cases the brain was covered with a silicone elastomer (Kwik-Cast), and the animal was recovered. One to three days later, the animal was re-anesthetized and 0.9–1 μl of concentrated SADΔG-EGFP(EnvA) or SADΔG-mCherry(EnvA) was injected at least 200 μm lateral to the location of the electroporated cell at a depth of approximately 250 μm below the dura to optimize infection probability and cell viability. The virus used in each experiment expressed a fluorescent marker that complemented the color of the marker expressed from electroporation in order to uniquely label the postsynaptic neuron and its presynaptic inputs. The brain was covered with Kwik-Cast in some cases and the animal was recovered. Five days later, or 15 days later in one experiment, the animal was perfused with 4% paraformaldehyde in phosphate buffer, the brain sectioned at 40 μm sagittal sections and processed for histological analysis (See Experimental Procedures).
Figure 3. In Vivo Single Cell Electroporation Visualized by Two-Photon Imaging.
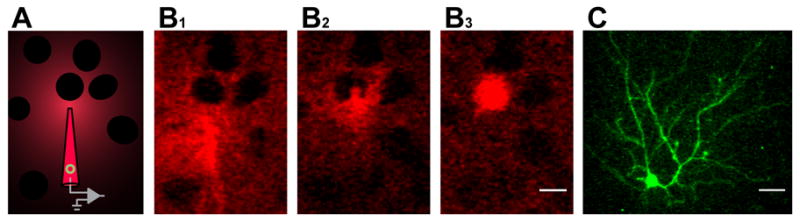
(A) Schematic of shadow imaging using a pipette containing Alexa dye and plasmid DNA (green circle) in intracellular solution. Positive pressure applied to the back of the pipette fills the extracellular space with fluorescent dye but does not fill neurons; they appear as dark shadows in the negative image.
(B1) In vivo two-photon fluorescent images of a pipette containing pCAG-YTB and Alexa dye in intracellular solution approaching a neuron, and dimpling its membrane in (B2).
(B3) The neuron filled with Alexa 594 dye immediately after electroporation (See also Movie S1).
(C) An average z-projection of the same neuron imaged under two-photon microscopy in vivo five days later. The neuron is green due to expression of venusYFP from the electroporated pCAG-YTB plasmid. Scale bars are 15 μm in (B1), (B2), and (B3) (same scale) and 25 μm in (C).
To assess the success of each experiment, the entire hemisphere in which the cell was electroporated was systematically scanned for fluorescent cells indicating viral infection or transfection by electroporation. In all cases in which a neuron was successfully electroporated and infected by the pseudotyped rabies virus (n = 6), dozens to nearly 100 other neurons were transsynaptically labeled by the virus (mean = 48.7, range from 14 to 97), the majority of which formed a cluster surrounding the electroporated neuron (Figure 4 and S2). The most neurons were labeled transsynaptically by the rabies virus when injections were made 3 days after electroporation (n = 3), and the least were observed with a 1 day time interval (n = 1). When electroporation was unsuccessful (n = 8), no neurons were found expressing the fluorescent protein from the rabies genome indicating that there was not any nonspecific infection of the EnvA pseudotyped virus in the absence of TVA. This provides further evidence for the specificity of the EnvA-TVA interaction, and suggests that all of the neurons expressing the fluorescent marker from the rabies genome in these experiments were either directly infected via the EnvA-TVA interaction (electroporated neurons) or infected transsynaptically via rabies glycoprotein complementation of the G-deleted rabies virus in the electroporated neurons. Overall, transsynaptic labeling of inputs to single neurons was achieved in just over one third of all electroporation attempts (6 successes and 11 failures in 17 attempts). When attempts were unsuccessful it was usually due to failure of electroporation transfection (8/17), and sometimes due to failure to infect the electroporated neuron (3/17).
Figure 4. Tracing the Monosynaptic Inputs to a Single Mammalian Neuron In Vivo.

(A) A single layer 2/3 neuron (yellow neuron indicated by white arrow) in mouse visual cortex was targeted for the single cell tracing strategy using the parameters and reagents schematically represented in Figure 1. Transfection of electroporated plasmids was confirmed by expression of mCherry in the neuron (inset) and by infection of the neuron by SADΔG-EGFP(EnvA), and glycoprotein mediated transsynaptic spread of rabies virus to presynaptic neurons, where the virus expressed EGFP (green). A cluster of a variety of interneuron cell types and pyramidal cells was found surrounding the electroporated neuron shown in (A) and extending onto adjacent 40 μm sections (for example (B), some sections not shown). Many other neurons were also found throughout the brain, located several hundred microns to over a centimeter away from the host neuron (C–G). Regardless of distance from the host neuron, the morphology of neurons was labeled in intricate detail, and it was possible to characterize the cell type of labeled neurons based on morphology. A total of 97 neurons were labeled transsynaptically by the virus in this experiment. All panels in this figure are from the same animal. Blue is NeuN staining of neuronal nuclei.
(B) Adjacent medial section to (A). Dendrites from the electroporated neuron (yellow) can be seen extending onto this section, as well as the neuron’s descending axon (indicated by white arrow).
(C) Higher magnification image of the pyramidal neuron indicated by the lower white box in (A). This neuron was located over 400 μm caudal to the host neuron, in the same lateral-medial plane. The detailed morphology of the neuron is clearly visible, with complete filling of the neuron’s dendritic spines and axon. This image only shows a small fraction of the elaboration of the neuron’s processes. Some of these features are visible in (B, similar location to in (A)).
(D) Higher magnification image of the interneuron indicated by the upper white box in (A). This neuron was located over 200 μm caudal to the host neuron, in the same lateral-medial plane. The complete filling of the neuron’s dendritic tree permitted characterization of the neuron as a layer 2/3 multipolar inhibitory neuron (more dendrites visible in (B)). Dozens of other interneurons were found in this experiment, representing a variety of cell types.
(E) A projection neuron found several hundred microns away from the host neuron in retrosplenial cortex.
(F) A neuron transsynaptically labeled in hypothalamus. Despite the over 1 cm distance from the host neuron, the brightness of label in this cell was comparable to the other neurons labeled throughout the brain.
(G) A visual cortical projection neuron labeled in complete detail, located over 200 μm lateral to the host neuron. Scale bars: 100 μm in (A), (B), 25 μm inset in (A) and (C)–(G).
The intricate morphology of labeled neurons was clearly visible in all cases, including details such as dendritic spines and axons (Figure 4B, 4C, 4E, 4G and S2D). This labeling made it possible to classify the cell type of labeled neurons based on morphology, and to omit any labeled glial cells from the analysis (3/6 experiments contained glial cells labeled by the rabies virus near the injection site constituting 10.4% (34/326) of all rabies labeled cells). The mechanism of glial labeling in these experiments is unknown. Several transsynaptically labeled visual-cortical pyramidal neurons were found, locally in layer 2/3 (Figure 4A, 4B and S2A), and in deeper cortical layers more distally (Figure 4A, 4C, 4G, S2A and S2D). It was possible to characterize 22 neurons as putative excitatory neurons labeled transsynaptically by the virus from the host neuron in Figure 4A, based purely on the obvious presence of spiny dendrites. The remaining 75 neurons labeled transsynaptically in this experiment did not clearly show spiny dendrites and the majority of these neurons are likely to represent a diverse interneuron population, including cells with multipolar (Figure 4D) and bipolar (Figure S2C) morphologies. Many neurons were found at distances of over 200 μm lateral to the host neuron. For example, at least 18.6% (18/97) of all labeled neurons had cell bodies located greater than 200 μm lateral to the host neuron in Figure 4A (white boxes in Figure 4A and 4C–4G). This included connections that were detected and intricately labeled by the single cell tracing strategy at distances of up to over a centimeter away from the host neuron in subcortical structures such as the hypothalamus (Figure 4F) and thalamus (Figure S2E). Given that a typical cortical brain slice used for electrophysiology experiments is 300–400 μm thick and does not typically include subcortical structures, these connections would have been entirely missed by in vitro analyses since they would be cut during preparation. The fact that neurons at great distances from the host neuron could be labeled by the rabies virus in such detail exemplifies the ability of the rabies virus to replicate and amplify gene expression in presynaptic neurons.
These results demonstrate the ability to reliably and intricately label monosynaptic inputs to a single neuron in vivo, and target a single postsynaptic neuron and its presynaptic neuronal network for independent gene expression.
DISCUSSION
In the present study, we developed and implemented a novel technique for robust and reliable targeting of single neuronal networks in vitro and in vivo. In every case in which a neuron was electroporated and infected with pseudotyped rabies virus there was successful transsynaptic labeling of the direct inputs to that cell. This led to an overall success rate of more than one third of in vivo attempts. For the first time, it is possible to identify and probe a single microcircuit in vivo, differentiating it from the vast web of connections that comprise the intact brain. We demonstrated the utility of the technique by targeting single layer 2/3 pyramidal neurons in mouse neocortex for infection and monosynaptic, retrograde spread of a modified rabies virus in order to reveal direct proximal and distal inputs from throughout the intact brain, in vivo. Combining single cell electroporation with a genetically modifiable, monosynaptic tracing rabies virus targets a single neuron and its direct inputs for independent gene control, paving the way for functional and genetic dissection of circuit development and information processing with single cell resolution at the molecular-genetic level.
Comparison to in vitro methods
The results presented here demonstrate the ability to target at least dozens of inputs to a single neuron for gene expression and fluorescent labeling both in vitro and in vivo. This offers a far higher yield for determining connectivity of neurons than multiunit recordings in brain slices, even when correlation analyses are used to predict likely connections (Aaron and Yuste, 2006; Kozloski et al., 2001; Peterlin et al., 2000), and provides independent gene control of connected neurons. Furthermore, when applied in vivo, distal and potentially rare connections can be identified that would otherwise be severed or missed by slice recording experiments. Moreover, the in vivo single cell tracing strategy may provide a means to probe the function of single neuronal microcircuits with single cell resolution and genetic control in the intact animal. This should make it possible to probe single neuronal networks in vivo in relation to ongoing sensory information and behavior.
The single cell tracing strategy could also be used to improve the throughput of in vitro paired recording studies by labeling the inputs to a single neuron in slice culture to guide recordings of connected neurons, in a more precise way than what was shown previously (Wickersham et al., 2007b). A similar goal could be achieved by making acute slices from an animal in which the inputs to a single neuron were labeled in vivo. In this case, functional tuning properties of labeled neurons could be determined in the living animal and then related to functional connectivity information gained from paired recordings of the same neurons in acute slices made from the same animal. However, these studies would be limited to pairs that maintained their connection during slicing, despite the fact that many of the connections between neurons would likely be severed during slicing (Stepanyants et al., 2009).
Application to fine scale circuit anatomy
Given high levels of fluorescent gene expression from single cell electroporation transfection and rabies infection, in addition to the ability to amplify labeling using specific antibodies, the detailed morphology of each neuron within a microcircuit is labeled by the single cell tracing technique. This makes it possible to determine the location and characterize the cell type of labeled neurons by morphological analysis in addition to other histological analyses, such as antibody stains to distinguish different interneuron types (Kawaguchi and Kondo, 2002). Determining the detailed cell morphology and cell-type specific connectivity pattern of single neuronal networks will add crucial details to realistic models of circuit computation and help reveal information processing mechanisms used by single neurons and microcircuits in vivo. To aid these analyses, the single cell tracing strategy could be applied in Brainbow transgenic mice (Livet et al., 2007) using a rabies virus expressing Cre recombinase (unpublished observations, T.M. and E.M.C.) so as to label each neuron in the circuit with a unique color. This may help distinguish the dendritic and axonal processes of each neuron in the circuit and provide a way to predict the precise subcellular location of synapses on the postsynaptic neuron from uniquely colored presynaptic neurons, yielding even greater fine scale details about the pattern of connectivity within a single neuronal network (also see Petreanu et al., 2009). Comparing detailed connectivity patterns revealed by the single cell tracing strategy within and across neuronal classes will help determine whether a basic pattern of microcircuitry exists across different brain areas (Douglas et al., 2003; Douglas and Martin, 2004; Silberberg et al., 2005; Thomson and Bannister, 2003). In this way, it will help evaluate the extent to which the billions of neurons that comprise the brain can be meaningfully characterized into one of potentially thousands of neuronal cell types based on connectivity, and how well we can extrapolate knowledge gained from studying single neurons and microcircuits to understanding circuit organization and function throughout different brain regions.
These analyses will be improved by the ability to label a greater fraction of the inputs to a single neuron (Crick, 1979). It is likely that the data presented here are an underestimate of the number of neurons providing input to a single layer 2/3 pyramidal neuron. The total number of neurons that provide input to a single layer 2/3 pyramidal neuron could be estimated by dividing the total number of synapses a single layer 2/3 pyramidal neuron receives by the number of synapses formed between each pair of connected neurons. The literature provides estimates of these numbers for a limited set of neurons, cortical areas and species. Furthermore, several assumptions have been made in these studies, such as extrapolating across age, cell type, brain area, and/or species, and differences in methods of preparation and analysis lead to ambiguities, especially when comparing across studies. The estimates we perform below are guilty of these same caveats. We provide them here only to gain a sense of the potential range of the number of neurons that provide input to a single layer 2/3 pyramidal neuron in rodent visual cortex.
DeFelipe and Farinas, 1992 estimated that the total number of synapses a layer 2/3 pyramidal neuron in rat visual cortex receives is between 10,682 and 14,575, based primarily on spine count data, with corrections made for estimated proportions of synapses formed on dendritic shafts, and onto the same spine as another synapse. The primary data for this estimate are from Larkman, 1991, a study which used dye filling of neurons in acute slice preparations to label neurons for spine distribution analysis. As stated earlier, spine density has been shown to increase dramatically as a result of slice preparation compared to tissue fixed in vivo (Kirov et al., 1999). In hippocampal slices made from postnatal day 21 rats, an age likely to be similar to the age used in the Larkman study, this increase was 90%. Using this increase as an estimate for the increase in spine density induced in the Larkman, 1991 data results in 5,662 to 7,671 estimated synaptic contacts. Interestingly, this correction almost entirely accounts for the difference in spine density of layer 2/3 pyramidal neurons between the Larkman, 1991 study and an earlier study of layer 2/3 pyramidal neurons fixed in vivo (Peters and Kaiserman-Abramof, 1970). For further comparison, Schüz and Palm, 1989 estimated that the average number of synapses per neuron is between 6,700 and 7,000 in area 17 of the mouse based on electron microscopy data and volume estimates, although this study did not take into account differences based on cell type.
The above estimates do not account for the number of synapses a presynaptic neuron makes on a postsynaptic neuron. An explicit estimate of the number of neurons that provide input to a layer 2/3 pyramidal neuron in rodent visual cortex could be calculated by dividing the total number of synapses by the number provided by each connected pair. The best estimates of cortico-cortical connection number are limited to select pairs of neurons, but consistently report approximately 4–5 synapses between a single pre and a single postsynaptic neuron by both anatomically and functionally constrained analyses (Feldmeyer et al., 2002; Markram et al., 1997; Silver et al., 2003; Stepanyants and Chklovskii, 2005; Tamás et al., 2004; Wang et al., 2006). Further studies are necessary to determine how these numbers compare to connections between different types of neurons. Using 4–5 synapses per connected pair results in an estimate of 1,132 to 1,918 neurons that provide input to a single layer 2/3 pyramidal neuron. With respect to age, spine elimination between the assumed time point used for the Larkman, 1991 study (roughly one month old), and the age range used in the current study (2–3 months old), has been shown to be approximately 25% in mouse visual cortex, of pyramidal dendrites in superficial layers (Grutzendler et al., 2002). Applying this factor to be directly proportional to the number of total inputs eliminated leads to an estimate of 849 to 1,439 neurons providing input to a single layer 2/3 pyramidal neuron. Thus, even with all the assumptions and caveats of these estimates used to predict the number of inputs to a single neuron, it is probable that the majority of inputs to the single neurons studied here were not transsynaptically labeled with rabies virus.
The present study is the first of its kind to evaluate the spread of rabies virus from a single neuron and thus no previous estimates exist to compare the efficiency of spread of rabies from single neurons in the single cell tracing strategy to the natural spread of wild-type rabies. The result that the most neurons were labeled transsynaptically by the virus in the experiments with the longest time interval between electroporation and virus injection supports the hypothesis that the timing and expression levels of rabies glycoprotein are key factors in the efficiency of spread of the virus to presynaptic neurons. It is likely that the exogenous introduction of the rabies glycoprotein by electroporation of plasmid DNA does not reliably mimic the precise timing and expression levels of the gene from the wild-type rabies genome. The life-cycle of rabies virus is tightly self-regulated, as has been demonstrated by extremely low recovery rates of rabies virus from cDNA (Schnell et al., 1994). Rabies virus budding efficiency has also been shown to increase by up to 30 fold in culture in the presence versus absence of glycoprotein, indicating a role for the glycoprotein in virus budding efficiency (Mebatsion et al., 1996a). Furthermore, rabies virus particles are only infectious when they are studded with glycoprotein (Etessami et al., 2000; Wickersham et al., 2007b). More precisely controlling the expression of rabies glycoprotein in the targeted neuron may lead to more efficient viral budding and transsynaptic infection. Modulating endogenous regulatory gene expression mechanisms within the rabies virus (i.e., mutations of the M protein to facilitate increased mRNA nuclear export (Faria et al., 2005)), or utilizing conditional gene expression systems to more tightly control the expression pattern of glycoprotein (Banaszynski et al., 2008; Gossen and Bujard, 2002), in future studies may yield more efficient transsynaptic spread of the virus from the electroporated neuron. These approaches may be further facilitated once more is known about the precise pattern of expression of rabies virus proteins over fine time scales, and about the mechanisms underlying the glycoprotein-mediated transsynaptic spread of the virus. Additional studies investigating the distribution of inputs onto the postsynaptic neuron analyzed by electron microscopy may yield fundamental details about the number of inputs labeled by the single cell tracing strategy as a function of cell type and dendritic target domain, as well as the fraction of total synapses labeled by the virus and additional details about the types of synapses labeled and at what rate of efficiency. A combination of improvements of the efficiency of spread of the virus, and additional analyses such as the electron microscopy studies suggested above, may yield an increasingly complete anatomical description of each single targeted neuronal network.
Targeting single neuronal networks for gene expression
To facilitate genetic studies of circuit development and function, the two mechanisms of genetic manipulation provided by the single cell tracing strategy can be utilized. Genes of interest can be included in either the single cell electroporation transfection or in the transsynaptic tracing rabies virus genome (Judkewitz et al., 2009; Wickersham et al., 2007a). In this way, independent gene control of the postsynaptic neuron alone or of the entire targeted microcircuit is possible. By adapting conditional gene expression systems, it should also be possible to target the presynaptic neuron population independently from the postsynaptic neuron. The ability to target a single microcircuit, or some combination of its circuit elements, for genetic manipulation opens the possibility to precisely probe and manipulate neuronal function using genetically encoded activity sensors and modulators (e.g., ChR2, genetically encoded calcium indicators (GECIs), and allatostatin receptor (AlstR), see Luo et al., 2008 for a review), and determine the role of specific genes in circuit development (e.g., specific transcription factors) or information processing (e.g., specific ion channels). By simultaneously measuring the activity of the postsynaptic neuron, while precisely modulating spiking activity of specific presynaptic neurons, or expression of specific genes in the pre or postsynaptic neuron, it should be possible to determine cause-effect relationships between presynaptic activity and/or specific gene expression, and the output activity of the postsynaptic neuron.
Studying information processing by single neuronal networks in vivo
Perhaps the most significant contribution the single cell tracing strategy will make to neuroscience will be in its application to probing the function of single neuronal networks, with single cell resolution and molecular precision in vivo. Future studies will be necessary to combine the single cell tracing strategy with functional assays of neuronal activity. However, previous evidence suggests that these applications of the tracing technique will be possible and may provide unprecedented access to the function of single neuronal networks in vivo.
It has been shown that single neurons transfected by single cell electroporation, or infected by G-deleted rabies virus, in vivo can be recorded from using standard electrophysiology techniques several days or up to weeks later. Furthermore, these neurons show normal physiological properties (Judkewitz et al., 2009; Kitamura et al., 2008; Wickersham et al., 2007a; Wickersham et al., 2007b). In the single cell tracing strategy, since the postsynaptic neuron is labeled by a different fluorescent protein than its presynaptic inputs, it should be possible to target patch recordings to either a postsynaptic neuron or a presynaptic neuron, or potentially both simultaneously, using targeted patch recordings in vivo (Judkewitz et al., 2009; Kitamura et al., 2008; Margrie et al., 2003; Poulet and Petersen, 2008). These recordings could be used to determine the functional influence (i.e., synaptic strength) of presynaptic neurons on the postsynaptic neuron, or to measure the tuning properties of connected neurons in relation to specific types of information. To achieve a similar goal, optical sensors of neuronal activity, such as calcium sensitive dyes (Ohki et al., 2005), could be used to simultaneously characterize the function of a large population of connected neurons labeled by the single cell tracing strategy, compared to unlabeled neighboring neurons in vivo. For example, this strategy could be used in the visual system to investigate whether neurons with similar visual tuning properties are connected. Comparing the activity of connected neurons may inform models of the integration a neuron performs on its specific inputs in time to generate its own unique firing pattern, and help answer many longstanding questions about how information is conveyed and processed throughout a neuronal network.
These applications of the single cell tracing strategy, in addition to the functional, anatomical and genetic applications discussed and validated in the above sections, provide a framework for direct analysis of the fine scale structure and function of single neuronal networks in the living brain. This level of identification, analysis and control of single neuronal networks has not been possible until now, especially in vivo, and may greatly improve our understanding of the mechanisms underlying microcircuit structure, development and computation throughout the intact, functioning brain.
Conclusion
A central hypothesis guiding neuroscience research is that the brain processes information through the combined computation of billions of single neurons organized into precisely connected neuronal networks. In this view, a single neuron is the brain’s most basic computational unit; it transforms its specific inputs in time to generate its unique, discrete output, similarly influencing the output response of postsynaptic neurons. Surviving the lifetime of the organism, a neuron relies on adaptable protein expression patterns (e.g., ion channels), morphological features (e.g., shape of dendrites and dendritic spines) and other intrinsic properties to dynamically filter its specific inputs to determine its output firing pattern. This computation occurs continuously over time for every neuron, and it is through the combined information processing of single neurons organized into ever increasingly large and overlapping neuronal networks that the brain performs the diverse and complex computations that determine perception, cognition and behavior. Unraveling this inapproachably complex process requires a dramatic simplification of the problem. Here, we developed and implemented a robust and reliable method to target a single neuronal microcircuit in vivo for fine scale anatomical and genetic analyses. Applying the technique, we identified monosynaptic inputs to single neocortical pyramidal neurons from across the living mouse brain, isolating them from the millions of connections that surrounded them. We also demonstrated the ability to target cellular components of a single microcircuit for expression of genes of interest. Combining the power of anatomical tracing with genetic manipulation and existing assays of neuronal function, it should be possible to gain greater insights into the mechanisms supporting information processing by single neuronal networks and determine the link between connectivity and function of single neurons throughout the brain.
EXPERIMENTAL PROCEDURES
Brain Slice Culture
All experiments involving living animals were approved by the Salk Institute’s Institutional Animal Care and Use Committee. Cortical brain slices were prepared from 5–7 day old rats and incubated at 37° for 2 days before electroporation, as described previously for ferrets (Dantzker and Callaway, 1998). On the day of electroporation, slices were individually transferred from a CO2 incubator to a slice physiology rig and submerged in culture medium. The experiment was limited in time so that each slice was transferred back to the incubator within ~30 minutes. In some experiments, multiple cells were electroporated per slice to test the reliability of the experiment. In other experiments, a single cell was electroporated in each slice. The electroporation parameters were −10 to −12 V square pulses, 0.5–1 ms duration at 100 Hz for 1 sec, with an increase in resistance of a 10–12 MΩ pipette of 20–30% during patching, based on previous studies of single cell electroporation (Kitamura et al., 2008; Rae and Levis, 2002; Rathenberg et al., 2003). The pipette contained the following plasmids in standard intracellular solution: pCMMP-TVA800 [75–150 ng/μl], pHCMV-RabiesG [50–100 ng/μl] and pCAG-venusYFP [50–100 ng/μl]. After 1–2 days, 200 μL/well of modified rabies virus supernatant (see below) was applied to the surface of the slices. The slices were incubated another 24 hours, and the culture medium was changed. The slices were fixed in 4% paraformaldehyde after 2–5 additional days. The tissue was antibody stained using antibodies against GFP (Aves Labs) and DsRed (Clontech), and secondarily stained to increase signal (Cy2, Jackson Immuno and Alexa Fluor 568, Invitrogen). Images were acquired on an epifluorescence microscope (Olympus).
In vivo Two-Photon Microscopy, Surgery, and Imaging Chamber
These procedures are described as Supplemental Experimental Procedures.
In Vivo Single Cell Electroporation
The in vivo single-cell electroporation protocol was adapted from previous studies (Judkewitz et al., 2009; Kitamura et al., 2008). The most relevant parameters are described here, and a more detailed protocol is available online (See Supplemental Experimental Procedures). For tracing experiments, only one neuron was electroporated in each animal. The artificial cerebrospinal fluid (ACSF) was removed from the imaging chamber and a pipette containing intracellular solution, Alexa Fluor 488 or 594 dye (50 μM, Invitrogen), and plasmid DNA (450 ng/μl total concentration of either pCAG-YTB or 150 ng/μl of each of the following plasmids: pCMMP-TVA800, pHCMV-RabiesG, and either pCAG-mCherry or pCAG-venusYFP), and was placed over the craniotomy within the microscope’s field of view. The pipette was advanced through the dura while positive pressure pulses (>100 mmHg) were applied to the back of the pipette with a syringe until the pipette reached a depth of 175–225 μm below the pial surface of primary visual cortex (V1). Positive pressure was applied to the back of the pipette to fill the extracellular space with dye. The pipette location was optimized to approach a single cell with pyramidal cell body morphology. Once the pipette was in close proximity of the cell, the pressure was lowered to approximately 20 mmHg. The pipette was advanced toward the cell until the resistance increased by 20–30% of the electrode. The patch was also observed under two-photon microscopy and a small dimple in the cell membrane filled with dye was sometimes observed forming around the pipette tip (Figure 3B2 and Movie S1). At this point, the pressure was released on the pipette and the electroporation pulses were delivered. Fifty or 100 square wave voltage pulses were delivered at 50 or 100 Hz respectively with an Axoporator 800A (Molecular Probes). The pulses were 500 μs in duration and −12V in amplitude (Judkewitz et al., 2009; Kitamura et al., 2008). Electroporation success was verified by immediate filling of the cell body with dye. The pipette was then immediately retracted slowly following a 30° diagonal trajectory, as was the case during entry. The craniotomy was covered in some cases with Kwik-Cast silicone elastomer (WPI) and the incision was sutured. The animal was recovered on a water recirculating heating pad and returned to its housing.
Virus Production and Injection
For slice culture experiments, EnvA pseudotyped rabies virus was produced as previously described (Wickersham et al., 2007b). The virus was further concentrated for in vivo injections by ultracentrifugation following a protocol for lenti virus production (Tiscornia et al., 2006). A recent protocol was published that also describes the ultracentrifugation steps as well as further details for production of high-titer EnvA pseudotyped rabies virus (Wickersham et al., 2010). Biological titers on TVA expressing cells were 5.1 × 10⁸/ml and 7.7 or 9.4 × 10⁷/ml for SADΔG-EGFP(EnvA) and SADΔG-mCherry(EnvA) respectively for in vivo injections.
One to three days after electroporation the animal was anesthetized and prepared for surgery, and placed in a small stereotaxic device. The silicone covering was removed and the brain rinsed with ACSF. The location of the cell was estimated using a sketch of the blood vessel pattern and landmarks as a reference. In some experiments, the same region was imaged with two-photon microscopy and the cell location was confirmed based on fluorescent gene expression, but this step was not necessary. A pipette with a 25–30 μm outer diameter tip, cut to a sharp angle, was lowered to directly penetrate the dura perpendicular to the brain surface at least 200 μm lateral to the estimated cell location in an area void of blood vessels and lowered to 250 μm below the pial surface. 0.9–1μl of virus was injected over 10–20 minutes, the pipette was left in place for 5–10 minutes and then the pipette was withdrawn. During injection, 5–10 ms pulses at 1.5 s intervals at 20 PSI or continuous pressure of approximately 0.5–1 PSI was applied to the back of the pipette with a Picospritzer (General Valve) or a syringe respectively. The brain was rinsed with ACSF, Kwik-Cast silicone elastomer was applied directly to the brain in some cases and the skin incision was sutured. The animal was recovered and returned to its housing.
Histology
Five days after viral injection, or 15 days later in one case, the animal was perfused with phosphate buffered saline followed by 4% paraformaldehyde in phosphate buffer. The brain was post-fixed overnight in 4% paraformaldehyde in phosphate buffer and then transferred to 30% sucrose in phosphate buffered saline overnight. The brain was sectioned on a freezing microtome at 40 μm thickness sagittally. The tissue was incubated in blocker solution for 2 hours and then incubated overnight at 4°C with antibodies against GFP (Aves Labs), DsRed (Clontech) and NeuN (Millipore) to amplify endogenous fluorescent gene expression and label neuronal nuclei. The tissue was washed and then incubated in secondary antibodies (Cy2, Rhodamine Red-X, AMCA, Jackson Immuno) for 2–3 hours at room temperature. The tissue sections were washed and then mounted on glass slides and coverslipped with PVA-DABCO. The entire hemisphere in which the experiment took place was scanned on an epifluorescence microscope for fluorescently labeled cells in experimental and control animals and the number of fluorescent neurons was quantified. In some cases, the contralateral hemisphere was also examined. Glial cells were sometimes observed near the injection site (Figure S2A), but these cells were excluded from the analysis based on morphology. Images were acquired on a confocal microscope (Leica) for in vivo data and displayed as maximum z projections, and multiple fields of view were integrated to form the montage images in Figure 4A and 4B. Images were acquired on an epifluorescence microscope (Olympus) for in vitro data.
Supplementary Material
Acknowledgments
We are grateful for support from the National Institutes of Health, the Kavli Institute for Brain and Mind, the Institute for Neural Computation, and the National Science Foundation Bridge to the Doctorate Program. We thank D. Lyon for helpful discussions, I. Wickersham and N. Wall for reagents, M. de la Parra, K. von Bochmann, M. Garrett and T. Lien for technical assistance, and members of the Callaway laboratory for discussions. J.M. and E.C. designed the experiments and prepared the manuscript. E.C. supervised the experiments. J.M. performed all of the experiments and analyzed the data. J.M. and T.M. set up the slice electroporation rig. J.M. and K.N. set up the in vivo electroporation and two-photon imaging rig.
Footnotes
Supplemental Information includes two figures, one movie, and Supplemental Experimental Procedures and can be found with this article online.
Publisher's Disclaimer: This is a PDF file of an unedited manuscript that has been accepted for publication. As a service to our customers we are providing this early version of the manuscript. The manuscript will undergo copyediting, typesetting, and review of the resulting proof before it is published in its final citable form. Please note that during the production process errors may be discovered which could affect the content, and all legal disclaimers that apply to the journal pertain.
References
- Aaron G, Yuste R. Reverse optical probing (ROPING) of neocortical circuits. Synapse. 2006;60:437–440. doi: 10.1002/syn.20316. [DOI] [PubMed] [Google Scholar]
- Astic L, Saucier D, Coulon P, Lafay F, Flamand A. The CVS strain of rabies virus as transneuronal tracer in the olfactory system of mice. Brain Res. 1993;619:146–156. doi: 10.1016/0006-8993(93)91606-s. [DOI] [PubMed] [Google Scholar]
- Banaszynski LA, Sellmyer MA, Contag CH, Wandless TJ, Thorne SH. Chemical control of protein stability and function in living mice. Nat Med. 2008;14:1123–1127. doi: 10.1038/nm.1754. [DOI] [PMC free article] [PubMed] [Google Scholar]
- Brown SP, Hestrin S. Cell-type identity: a key to unlocking the function of neocortical circuits. Curr Opin Neurobiol. 2009a;19:415–421. doi: 10.1016/j.conb.2009.07.011. [DOI] [PMC free article] [PubMed] [Google Scholar]
- Brown SP, Hestrin S. Intracortical circuits of pyramidal neurons reflect their long-range axonal targets. Nature. 2009b;457:1133–1136. doi: 10.1038/nature07658. [DOI] [PMC free article] [PubMed] [Google Scholar]
- Crick FH. Thinking about the brain. Sci Am. 1979;241:219–232. doi: 10.1038/scientificamerican0979-219. [DOI] [PubMed] [Google Scholar]
- Dantzker JL, Callaway EM. The development of local, layer-specific visual cortical axons in the absence of extrinsic influences and intrinsic activity. J Neurosci. 1998;18:4145–4154. doi: 10.1523/JNEUROSCI.18-11-04145.1998. [DOI] [PMC free article] [PubMed] [Google Scholar]
- DeFelipe J, Farinas I. The pyramidal neuron of the cerebral cortex: morphological and chemical characteristics of the synaptic inputs. Prog Neurobiol. 1992;39:563–607. doi: 10.1016/0301-0082(92)90015-7. [DOI] [PubMed] [Google Scholar]
- Douglas R, Markram H, Martin K. The Synaptic Organization of the Brain. 5. Oxford: Oxford University Press; 2003. [Google Scholar]
- Douglas RJ, Martin KA. Neuronal circuits of the neocortex. Annu Rev Neurosci. 2004;27:419–451. doi: 10.1146/annurev.neuro.27.070203.144152. [DOI] [PubMed] [Google Scholar]
- Etessami R, Conzelmann KK, Fadai-Ghotbi B, Natelson B, Tsiang H, Ceccaldi PE. Spread and pathogenic characteristics of a G-deficient rabies virus recombinant: an in vitro and in vivo study. J Gen Virol. 2000;81:2147–2153. doi: 10.1099/0022-1317-81-9-2147. [DOI] [PubMed] [Google Scholar]
- Faria PA, Chakraborty P, Levay A, Barber GN, Ezelle HJ, Enninga J, Arana C, van Deursen J, Fontoura BM. VSV disrupts the Rae1/mrnp41 mRNA nuclear export pathway. Mol Cell. 2005;17:93–102. doi: 10.1016/j.molcel.2004.11.023. [DOI] [PubMed] [Google Scholar]
- Feldmeyer D, Lübke J, Silver RA, Sakmann B. Synaptic connections between layer 4 spiny neurone-layer 2/3 pyramidal cell pairs in juvenile rat barrel cortex: physiology and anatomy of interlaminar signalling within a cortical column. J Physiol. 2002;538:803–822. doi: 10.1113/jphysiol.2001.012959. [DOI] [PMC free article] [PubMed] [Google Scholar]
- Gossen M, Bujard H. Studying gene function in eukaryotes by conditional gene inactivation. Annu Rev Genet. 2002;36:153–173. doi: 10.1146/annurev.genet.36.041002.120114. [DOI] [PubMed] [Google Scholar]
- Haas K, Sin WC, Javaherian A, Li Z, Cline HT. Single-cell electroporation for gene transfer in vivo. Neuron. 2001;29:583–591. doi: 10.1016/s0896-6273(01)00235-5. [DOI] [PubMed] [Google Scholar]
- Judkewitz B, Rizzi M, Kitamura K, Häusser M. Targeted single-cell electroporation of mammalian neurons in vivo. Nat Protoc. 2009;4:862–869. doi: 10.1038/nprot.2009.56. [DOI] [PubMed] [Google Scholar]
- Kampa BM, Letzkus JJ, Stuart GJ. Cortical feed-forward networks for binding different streams of sensory information. Nat Neurosci. 2006;9:1472–1473. doi: 10.1038/nn1798. [DOI] [PubMed] [Google Scholar]
- Kawaguchi Y, Kondo S. Parvalbumin, somatostatin and cholecystokinin as chemical markers for specific GABAergic interneuron types in the rat frontal cortex. J Neurocytol. 2002;31:277–287. doi: 10.1023/a:1024126110356. [DOI] [PubMed] [Google Scholar]
- Kelly RM, Strick PL. Rabies as a transneuronal tracer of circuits in the central nervous system. J Neurosci Methods. 2000;103:63–71. doi: 10.1016/s0165-0270(00)00296-x. [DOI] [PubMed] [Google Scholar]
- Kelly RM, Strick PL. Cerebellar loops with motor cortex and prefrontal cortex of a nonhuman primate. J Neurosci. 2003;23:8432–8444. doi: 10.1523/JNEUROSCI.23-23-08432.2003. [DOI] [PMC free article] [PubMed] [Google Scholar]
- Kirov SA, Sorra KE, Harris KM. Slices have more synapses than perfusion-fixed hippocampus from both young and mature rats. J Neurosci. 1999;19:2876–2886. doi: 10.1523/JNEUROSCI.19-08-02876.1999. [DOI] [PMC free article] [PubMed] [Google Scholar]
- Kitamura K, Judkewitz B, Kano M, Denk W, Häusser M. Targeted patch-clamp recordings and single-cell electroporation of unlabeled neurons in vivo. Nat Methods. 2008;5:61–67. doi: 10.1038/nmeth1150. [DOI] [PubMed] [Google Scholar]
- Kozloski J, Hamzei-Sichani F, Yuste R. Stereotyped position of local synaptic targets in neocortex. Science. 2001;293:868–872. doi: 10.1126/science.293.5531.868. [DOI] [PubMed] [Google Scholar]
- Larkman AU. Dendritic morphology of pyramidal neurones of the visual cortex of the rat: III. Spine distributions. J Comp Neurol. 1991;306:332–343. doi: 10.1002/cne.903060209. [DOI] [PubMed] [Google Scholar]
- Lefort S, Tomm C, Floyd Sarria JC, Petersen CC. The excitatory neuronal network of the C2 barrel column in mouse primary somatosensory cortex. Neuron. 2009;61:301–316. doi: 10.1016/j.neuron.2008.12.020. [DOI] [PubMed] [Google Scholar]
- Lewis BC, Chinnasamy N, Morgan RA, Varmus HE. Development of an avian leukosis-sarcoma virus subgroup A pseudotyped lentiviral vector. J Virol. 2001;75:9339–9344. doi: 10.1128/JVI.75.19.9339-9344.2001. [DOI] [PMC free article] [PubMed] [Google Scholar]
- Livet J, Weissman TA, Kang H, Draft RW, Lu J, Bennis RA, Sanes JR, Lichtman JW. Transgenic strategies for combinatorial expression of fluorescent proteins in the nervous system. Nature. 2007;450:56–62. doi: 10.1038/nature06293. [DOI] [PubMed] [Google Scholar]
- Luo L, Callaway EM, Svoboda K. Genetic dissection of neural circuits. Neuron. 2008;57:634–660. doi: 10.1016/j.neuron.2008.01.002. [DOI] [PMC free article] [PubMed] [Google Scholar]
- Margrie TW, Meyer AH, Caputi A, Monyer H, Hasan MT, Schaefer AT, Denk W, Brecht M. Targeted whole-cell recordings in the mammalian brain in vivo. Neuron. 2003;39:911–918. doi: 10.1016/j.neuron.2003.08.012. [DOI] [PubMed] [Google Scholar]
- Markram H, Lübke J, Frotscher M, Roth A, Sakmann B. Physiology and anatomy of synaptic connections between thick tufted pyramidal neurones in the developing rat neocortex. J Physiol. 1997;500(Pt 2):409–440. doi: 10.1113/jphysiol.1997.sp022031. [DOI] [PMC free article] [PubMed] [Google Scholar]
- Mebatsion T, König M, Conzelmann KK. Budding of rabies virus particles in the absence of the spike glycoprotein. Cell. 1996a;84:941–951. doi: 10.1016/s0092-8674(00)81072-7. [DOI] [PubMed] [Google Scholar]
- Mebatsion T, Schnell MJ, Cox JH, Finke S, Conzelmann KK. Highly stable expression of a foreign gene from rabies virus vectors. Proc Natl Acad Sci U S A. 1996b;93:7310–7314. doi: 10.1073/pnas.93.14.7310. [DOI] [PMC free article] [PubMed] [Google Scholar]
- Nassi JJ, Callaway EM. Multiple circuits relaying primate parallel visual pathways to the middle temporal area. J Neurosci. 2006;26:12789–12798. doi: 10.1523/JNEUROSCI.4044-06.2006. [DOI] [PMC free article] [PubMed] [Google Scholar]
- Nevian T, Helmchen F. Calcium indicator loading of neurons using single-cell electroporation. Pflugers Arch. 2007;454:675–688. doi: 10.1007/s00424-007-0234-2. [DOI] [PubMed] [Google Scholar]
- Ohki K, Chung S, Ch’ng YH, Kara P, Reid RC. Functional imaging with cellular resolution reveals precise micro-architecture in visual cortex. Nature. 2005;433:597–603. doi: 10.1038/nature03274. [DOI] [PubMed] [Google Scholar]
- Peterlin ZA, Kozloski J, Mao BQ, Tsiola A, Yuste R. Optical probing of neuronal circuits with calcium indicators. Proc Natl Acad Sci U S A. 2000;97:3619–3624. doi: 10.1073/pnas.97.7.3619. [DOI] [PMC free article] [PubMed] [Google Scholar]
- Peters A, Kaiserman-Abramof IR. The small pyramidal neuron of the rat cerebral cortex. The perikaryon, dendrites and spines. Am J Anat. 1970;127:321–355. doi: 10.1002/aja.1001270402. [DOI] [PubMed] [Google Scholar]
- Petreanu L, Huber D, Sobczyk A, Svoboda K. Channelrhodopsin-2-assisted circuit mapping of long-range callosal projections. Nat Neurosci. 2007;10:663–668. doi: 10.1038/nn1891. [DOI] [PubMed] [Google Scholar]
- Petreanu L, Mao T, Sternson SM, Svoboda K. The subcellular organization of neocortical excitatory connections. Nature. 2009;457:1142–1145. doi: 10.1038/nature07709. [DOI] [PMC free article] [PubMed] [Google Scholar]
- Poulet JF, Petersen CC. Internal brain state regulates membrane potential synchrony in barrel cortex of behaving mice. Nature. 2008;454:881–885. doi: 10.1038/nature07150. [DOI] [PubMed] [Google Scholar]
- Rae JL, Levis RA. Single-cell electroporation. Pflugers Arch. 2002;443:664–670. doi: 10.1007/s00424-001-0753-1. [DOI] [PubMed] [Google Scholar]
- Rathenberg J, Nevian T, Witzemann V. High-efficiency transfection of individual neurons using modified electrophysiology techniques. J Neurosci Methods. 2003;126:91–98. doi: 10.1016/s0165-0270(03)00069-4. [DOI] [PubMed] [Google Scholar]
- Schnell MJ, Mebatsion T, Conzelmann KK. Infectious rabies viruses from cloned cDNA. EMBO J. 1994;13:4195–4203. doi: 10.1002/j.1460-2075.1994.tb06739.x. [DOI] [PMC free article] [PubMed] [Google Scholar]
- Schüz A, Palm G. Density of neurons and synapses in the cerebral cortex of the mouse. J Comp Neurol. 1989;286:442–455. doi: 10.1002/cne.902860404. [DOI] [PubMed] [Google Scholar]
- Silberberg G, Grillner S, LeBeau FE, Maex R, Markram H. Synaptic pathways in neural microcircuits. Trends Neurosci. 2005;28:541–551. doi: 10.1016/j.tins.2005.08.004. [DOI] [PubMed] [Google Scholar]
- Silver RA, Lübke J, Sakmann B, Feldmeyer D. High-probability uniquantal transmission at excitatory synapses in barrel cortex. Science. 2003;302:1981–1984. doi: 10.1126/science.1087160. [DOI] [PubMed] [Google Scholar]
- Somogyi P, Tamás G, Lujan R, Buhl EH. Salient features of synaptic organisation in the cerebral cortex. Brain Res Brain Res Rev. 1998;26:113–135. doi: 10.1016/s0165-0173(97)00061-1. [DOI] [PubMed] [Google Scholar]
- Song S, Sjöström PJ, Reigl M, Nelson S, Chklovskii DB. Highly nonrandom features of synaptic connectivity in local cortical circuits. PLoS Biol. 2005;3:e68. doi: 10.1371/journal.pbio.0030068. [DOI] [PMC free article] [PubMed] [Google Scholar]
- Stepanyants A, Chklovskii DB. Neurogeometry and potential synaptic connectivity. Trends Neurosci. 2005;28:387–394. doi: 10.1016/j.tins.2005.05.006. [DOI] [PubMed] [Google Scholar]
- Stepanyants A, Martinez LM, Ferecskó AS, Kisvárday ZF. The fractions of short- and long-range connections in the visual cortex. Proc Natl Acad Sci U S A. 2009;106:3555–3560. doi: 10.1073/pnas.0810390106. [DOI] [PMC free article] [PubMed] [Google Scholar]
- Tamás G, Szabadics J, Lörincz A, Somogyi P. Input and frequency-specific entrainment of postsynaptic firing by IPSPs of perisomatic or dendritic origin. Eur J Neurosci. 2004;20:2681–2690. doi: 10.1111/j.1460-9568.2004.03719.x. [DOI] [PubMed] [Google Scholar]
- Thomson AM, Bannister AP. Interlaminar connections in the neocortex. Cereb Cortex. 2003;13:5–14. doi: 10.1093/cercor/13.1.5. [DOI] [PubMed] [Google Scholar]
- Thomson AM, Deuchars J, West DC. Large, deep layer pyramid-pyramid single axon EPSPs in slices of rat motor cortex display paired pulse and frequency-dependent depression, mediated presynaptically and self-facilitation, mediated postsynaptically. J Neurophysiol. 1993;70:2354–2369. doi: 10.1152/jn.1993.70.6.2354. [DOI] [PubMed] [Google Scholar]
- Thomson AM, Lamy C. Functional maps of neocortical local circuitry. Front Neurosci. 2007;1:19–42. doi: 10.3389/neuro.01.1.1.002.2007. [DOI] [PMC free article] [PubMed] [Google Scholar]
- Thomson AM, West DC, Wang Y, Bannister AP. Synaptic connections and small circuits involving excitatory and inhibitory neurons in layers 2–5 of adult rat and cat neocortex: triple intracellular recordings and biocytin labelling in vitro. Cereb Cortex. 2002;12:936–953. doi: 10.1093/cercor/12.9.936. [DOI] [PubMed] [Google Scholar]
- Tiscornia G, Singer O, Verma IM. Production and purification of lentiviral vectors. Nat Protoc. 2006;1:241–245. doi: 10.1038/nprot.2006.37. [DOI] [PubMed] [Google Scholar]
- Ugolini G. Specificity of rabies virus as a transneuronal tracer of motor networks: transfer from hypoglossal motoneurons to connected second-order and higher order central nervous system cell groups. J Comp Neurol. 1995;356:457–480. doi: 10.1002/cne.903560312. [DOI] [PubMed] [Google Scholar]
- Wang Y, Markram H, Goodman PH, Berger TK, Ma J, Goldman-Rakic PS. Heterogeneity in the pyramidal network of the medial prefrontal cortex. Nat Neurosci. 2006;9:534–542. doi: 10.1038/nn1670. [DOI] [PubMed] [Google Scholar]
- Wickersham IR, Finke S, Conzelmann KK, Callaway EM. Retrograde neuronal tracing with a deletion-mutant rabies virus. Nat Methods. 2007a;4:47–49. doi: 10.1038/NMETH999. [DOI] [PMC free article] [PubMed] [Google Scholar]
- Wickersham IR, Lyon DC, Barnard RJ, Mori T, Finke S, Conzelmann KK, Young JA, Callaway EM. Monosynaptic restriction of transsynaptic tracing from single, genetically targeted neurons. Neuron. 2007b;53:639–647. doi: 10.1016/j.neuron.2007.01.033. [DOI] [PMC free article] [PubMed] [Google Scholar]
- Wickersham IR, Sullivan HA, Seung HS. Production of glycoprotein-deleted rabies viruses for monosynaptic tracing and high-level gene expression in neurons. Nat Protoc. 2010;5:595–606. doi: 10.1038/nprot.2009.248. [DOI] [PubMed] [Google Scholar]
- Yoshimura Y, Callaway EM. Fine-scale specificity of cortical networks depends on inhibitory cell type and connectivity. Nat Neurosci. 2005;8:1552–1559. doi: 10.1038/nn1565. [DOI] [PubMed] [Google Scholar]
- Yoshimura Y, Dantzker JL, Callaway EM. Excitatory cortical neurons form fine-scale functional networks. Nature. 2005;433:868–873. doi: 10.1038/nature03252. [DOI] [PubMed] [Google Scholar]
- Young JA, Bates P, Varmus HE. Isolation of a chicken gene that confers susceptibility to infection by subgroup A avian leukosis and sarcoma viruses. J Virol. 1993;67:1811–1816. doi: 10.1128/jvi.67.4.1811-1816.1993. [DOI] [PMC free article] [PubMed] [Google Scholar]
Associated Data
This section collects any data citations, data availability statements, or supplementary materials included in this article.