

Synopsis
The glucose-6-phosphatase catalytic subunit (G6Pase) catalyses the final step in the gluconeogenic and glycogenolytic pathways, the hydrolysis of glucose-6-phosphate to glucose. We show here that, in HepG2 hepatoma cells, epidermal growth factor (EGF) inhibits basal mouse G6Pase fusion gene transcription. Several studies have shown that insulin represses basal mouse G6Pase fusion gene transcription through FOXO1 but Stoffel and colleagues (Proc. Natl. Acad. Sci. 100:11624, 2003) have recently suggested that insulin can also regulate gene transcription through FOXA2. A combined glucocorticoid receptor (GR)-FOXA2 binding site is located between −185 and −174 in the mouse G6Pase promoter overlapping two FOXO1 binding sites located between (−188 and −182) and (−174 and −168). Selective mutation of the FOXO1 binding sites reduced the effect of insulin whereas mutation of the GR/FOXA2 binding site had no effect on the insulin response. In contrast, selective mutation of the FOXO1 and GR/FOXA2 binding sites both reduced the effect of EGF. The effect of these mutations was additive since the combined mutation of both FOXO1 and GR/FOXA2 binding sites reduced the effect of EGF to a greater extent than the individual mutations. These results suggest that, in HepG2 cells, GR and/or FOXA2 are required for the inhibition of basal G6Pase gene transcription by EGF but not insulin. EGF also inhibits hepatic G6Pase gene expression in vivo but in cultured hepatocytes EGF has the opposite effect stimulating expression, an observation that may be explained by a switch in ErbB receptor sub-type expression following hepatocyte isolation.
Keywords: Insulin, transcription, glucose-6-phosphatase, EGF, FOXO1, glucocorticoid
Introduction
In liver, glucose-6-phosphatase catalyses the final step in the gluconeogenic and glycogenolytic pathways, the hydrolysis of glucose-6-phosphate (G6P)1 to glucose and inorganic phosphate [1]. Glucose-6-phosphatase is located in the endoplasmic reticulum (ER) membrane and is thought to exist as a multi-component enzyme system in which a glucose-6-phosphatase catalytic subunit (G6Pase) has its catalytic site directed towards the lumen of the ER with a G6P transporter delivering substrate from the cytosol to the active site of the catalytic subunit and transporters for inorganic phosphate and glucose returning the reaction products back to the cytosol [1]. The glucose transporter remains to be identified but recent data suggest that a single transporter transports both G6P and inorganic phosphate [2].
G6Pase gene transcription is regulated by multiple factors, including some that stimulate gene expression (glucose, glucocorticoids, glucagon, fatty acids) and some that repress (insulin, TNFα and phorbol esters). In human HepG2 hepatoma cells, the inhibitory effect of insulin on basal mouse and human G6Pase gene transcription is mediated through a multi-component insulin response unit that is composed of two regions, designated Regions A and B [3]. In the mouse G6Pase promoter, Region A is located between −231 and −199, while Region B is located between −198 and −158, relative to the transcription start site. Region A binds hepatocyte nuclear factor-1 (HNF-1), which acts as an accessory factor to enhance the effect of insulin that is mediated through Region B [3]. Region B contains three insulin response sequences (IRSs), designated IRS 1, 2 & 3 [3] but only IRS 1 and 2 are required for the suppression of basal G6Pase gene expression by insulin [4]. Detailed mutagenesis experiments and chromatin immunoprecipitation (ChIP) assays have shown that FOXO1 is the transcription factor binding IRS 1 and 2 and mediating the effect of insulin [4, 5]. Insulin inhibits FOXO1-mediated transcriptional activation through the PI 3-kinase dependent activation of PKB, which leads to the phosphorylation and nuclear exclusion of this factor [6].
Overexpression of G6Pase is thought to contribute to the increased hepatic glucose production (HGP) characteristic of both type 1 and type 2 diabetes [7]. Indeed, overexpression of G6Pase in liver [8] is sufficient to stimulate HGP. Understanding how hormones/growth factors repress G6Pase gene expression may therefore be helpful in the design of strategies to treat patients with diabetes. With this goal in mind we have investigated the effect of epidermal growth factor (EGF) on G6Pase gene expression since it inhibits the expression of another gluconeogenic enzyme encoding gene, namely phosphoenolpyruvate carboxykinase (PEPCK) [9]. EGF signaling is extremely complex in that four homologous transmembrane receptors have been identified, designated ErbB1-4. These receptor tyrosine kinases have differing ligand specificities and are able to form both homo- and heterodimers [10, 11]. Adding to the complexity, ErbB2 lacks a ligand-binding domain whereas ErbB3 lacks an active intracellular tyrosine kinase domain [10, 11]. Finally, EGF is but one of a family of ligands for these receptors that also includes epiregulin, β-cellulin, amphiregulin, transforming growth factor-α, heparin binding EGF-like growth factor, and neuregulins; each ligand can bind different combinations of ErbB receptors [10, 11]. Our results show that EGF, like insulin, inhibits G6Pase fusion gene expression in HepG2 cells. However, EGF not only works through FOXO1 but also but through an additional promoter element that binds both FOXA2 and the glucocorticoid receptor. EGF also inhibits hepatic G6Pase gene expression in vivo but in cultured hepatocytes EGF has the opposite effect stimulating G6Pase gene expression, an observation that may be explained by a switch in ErbB receptor sub-type expression following hepatocyte isolation.
Experimental
Materials
The murine EGF used for the tissue culture studies was purchased from EMD Biosciences (San Diego, CA). This product has been discontinued so the murine EGF used for later animal studies was purchased from Santa Cruz Biotechnology, Inc. (Santa Cruz, CA). The selective ErbB1 and ErbB2 inhibitors AG825 and AG1478 were purchased from EMD Biosciences (San Diego, CA). Specific antisera to ErbB1 (sc-03), ErbB2 (sc-284), ErbB3 (sc-285) and ErbB4 (sc-283) and goat anti-rabbit IgG horseradish peroxidase (HRP; sc-2004) were purchased from Santa Cruz Biotechnology, Inc. (Santa Cruz, CA).
Plasmid Construction
The generation of mouse G6Pase-luciferase fusion genes, containing promoter sequence located between −484, −231, −198, −158, −129, −85 or −35 and +66, relative to the transcription start site, in the pGL3 MOD vector have been previously described [12, 13]. Additional mouse G6Pase-luciferase fusion genes, containing promoter sequence located between −2237 or −1188 and +66 in the pGL3 MOD vector, were generated by PCR using a BAC clone (Accession number AL590969; clone RP23-281C18) containing the entire mouse G6Pase gene, as the template. The latter was purchased from BACPAC Resources (Children’s Hospital Oakland Research Institute, Oakland, CA).
G6Pase-luciferase fusion genes containing site-directed block mutations (SDMs) in a hepatocyte nuclear factor-1 (HNF-1) motif (−231 HNF-1 SDM) or two glucocorticoid response elements (GREs), designated GRE A and GRE B (−231 GRE A SDM and −231 GRE B SDM) as well as site-directed point mutations in G6Pase IRS 1 and IRS 2 (−231 IRS 1 + 2 SDM) have also been previously described [13]. A G6Pase-luciferase fusion gene, designated −484 TATA SDM, containing a site-directed block mutation in a TATA motif in the context of the −484 to +66 promoter region, was generated by a previously described 3 step PCR procedure [3] using the following complementary primers 5′-GACTGAATCCAGGGCAgcgcAAACAGGGGCAAGGC-3′ and 5′-GCCTTGCCCCTGTTTgcgcTGCCCTGGATTCAGTC-3′ (mutated nucleotides in lower case letters). All promoter fragments generated by PCR were completely sequenced to verify the absence of polymerase errors. A plasmid encoding human ErbB1 (pEGFP-N1-ErbB1) and the empty pEGFP-N1 vector were generously provided by Dr. Graham Carpenter [14]. A pCDM8 expression vector encoding the human insulin receptor was generously provided by Dr. Jonathan Whittaker [15].
Cell Culture, Transient Transfection and Luciferase Assays
Rat H4IIE and Human HepG2 hepatoma cells were grown and transiently transfected in suspension using the calcium phosphate-DNA co-precipitation method as previously described [16]. Primary cultures of rat hepatocytes were isolated exactly as previously described [17]. After plating, hepatocytes were transiently transfected with the plasmids indicated in the Figure Legends using lipofectamine 2000 with a lipofectamine (μl):DNA (μg) ratio of 1.875:1 according to the manufacturer’s instructions.
Luciferase assays were performed using the Promega Dual-Luciferase Reporter Assay System according to the manufacturer’s instructions. In these experiments we saw no effect of EGF or insulin on Renilla luciferase activity in HepG2 cells. Therefore, for comparisons of EGF- and insulin-regulated gene expression firefly luciferase activity directed by the various fusion gene constructs was expressed relative to SV40-Renilla luciferase activity in the same sample.
Gel Retardation Assay
Gel retardation assays were used to analyze DNA binding by a bacterially expressed GST-FOXO1a fusion protein as previously described [4]. H4IIE nuclear extracts were prepared and FOXA2 binding analyzed in gel retardation assays under conditions previously described [18], except that poly(dG-dC)·poly(dG-dC) was used as the non-specific competitor. For competition experiments, unlabeled competitor DNA was mixed with the labeled oligomer at the indicated molar excess prior to the addition of protein. Where appropriate, the 32P associated with retarded complexes was quantitated through the use of a Packard Instant Imager.
For supershift experiments specific antisera specific for (1 μl) raised against FOXA1, FOXA2 or FOXA3 were pre-incubated with H4IIE nuclear extract (3 μg) for 15 minutes at room temperature prior to the addition of the labeled probe and binding cocktail and incubation for an additional 10 min at room temperature before analysis of protein binding as described above. The antibodies were a generous gift from Dr. James Darnell.
Western blotting
Whole cell lysate prepared from HepG2 cells was separated on 4–15% gradient gels (Bio-Rad Laboratories, Hercules, CA) and transferred to nitrocellulose. The blots were then blocked in 5% powdered milk/Tris-buffered saline with Tween 20 (TBST) (50 mM Tris, pH 7.4, 154 mM NaCl, 0.05% Tween-20) for one hour and incubated in primary antibody (rabbit anti-ErbB1, ErbB2, ErbB3, ErbB4, 1:1000 dilution) overnight at 4°C. Blots were then washed 3X with TBST, incubated with goat anti-rabbit IgG HRP (1:5000) for one hour, washed 3X with TBST, and incubated with pico chemiluminescent substrate (Pierce, Rockford, IL).
Animal Care
The animal facilities at Vanderbilt University meet the standards published by the American Association for the Accreditation of Laboratory Animal Care, and all protocols were approved by the Vanderbilt University Medical Center Animal Care and Use Committees. Mice were fasted overnight and then given intraperitoneal injections of saline or 1.375 mg/kg of a murine EGF fusion protein (mBA-53; Santa Cruz Biotechnology, Inc., Santa Cruz, CA). Animals were sacrificed and liver removed 3 hrs post injection and immediately frozen in liquid nitrogen.
G6Pase mRNA Expression Analysis
RNA isolation and analysis of G6Pase gene expression by RNA blotting was performed exactly as previously described [19].
Statistical Analyses
The transfection data were analyzed for differences from the control values, as specified in the Figure Legends. Statistical comparisons were calculated using an unpaired Student’s t-test. The level of significance was p < 0.05 (two-sided test).
Results
EGF represses basal G6Pase fusion gene transcription in HepG2 cells
To begin to study the regulation of G6Pase gene transcription by EGF, a G6Pase-luciferase fusion gene construct, containing G6Pase promoter sequence from −2237 to +66 was transiently transfected into HepG2 cells (Fig. 1A). There was no effect of EGF on fusion gene expression in native HepG2 cells (Fig. 1A). However, when the G6Pase-luciferase fusion gene was co-transfected with an expression vector encoding the ErbB1 receptor, EGF inhibited G6Pase expression (Fig. 1A). This action of EGF in HepG2 cells was concentration dependent with a maximal effect seen at 10 ng/ml (Fig. 1B). We have previously reported a similar observation with respect to insulin signaling in that co-transfection with an insulin receptor expression vector was required to observe an effect of insulin on the expression of a transiently transfected collagenase fusion gene in HeLa cells [20].
Figure 1. EGF represses basal G6Pase fusion gene expression in HepG2 cells.

HepG2 cells were transiently co-transfected with a G6Pase-firefly luciferase fusion gene (15 μg) containing promoter sequence from −2237 to +66 and expression vectors encoding Renilla luciferase (0.15 μg) and either (Panel A) the empty pEGFP-N1 vector (1 μg) or (Panel A & B) the same vector encoding ErbB1 (1 μg). Following transfection cells were incubated for 18–20 hours in serum-free medium in the presence or absence of 10 ng/ml (Panel A) or the indicated amount of EGF (Panel B). Cells were then harvested and luciferase assayed. In Panel A results are presented as the ratio of firefly:Renilla luciferase activity. In Panel B the ratio of firefly:Renilla luciferase activity in EGF-treated versus control cells is expressed as a percentage of the control value. Results represent the mean ± S.E.M. of 3 (A) or 8 (B) experiments with each sample assayed in duplicate. *, p < 0.05 versus control.
To begin to delineate the cis-acting elements that mediate the action of EGF, the ability of EGF to repress the basal expression of a series of 5′-truncated G6Pase-luciferase fusion genes was assessed. Figure 2 shows that deletion of the G6Pase promoter sequence between −2237 and −484 had no effect on the ability of EGF to repress basal G6Pase-luciferase gene expression, whereas deletion of the G6Pase promoter sequence between (−484 and −232) and (−231 and −199) partially reduced this response. Deletion of additional sequence between −198 and −159 completely abolished the remaining effect of EGF on basal G6Pase-luciferase fusion gene expression (Fig. 2). These results demonstrate that the inhibitory effect of EGF requires three promoter regions located between (−484 and −232), (−231 and −199) and (−198 and −158). The latter two regions, previously designated Region A and Region B, are also required for the inhibitory effect of insulin whereas the (−484 to −232) region is not [3].
Figure 2. Three G6Pase promoter regions are required for the maximal inhibitory effect of EGF on basal G6Pase fusion gene expression in HepG2 cells.

HepG2 cells were transiently co-transfected with G6Pase-firefly luciferase fusion genes (15 μg) containing G6Pase promoter sequence from +66 to the indicated 5′ end-points and expression vectors encoding Renilla luciferase (0.15 μg) and ErbB1 (1 μg). Following transfection cells were incubated for 18–20 hr in the presence or absence of 50 ng/ml EGF. Cells were then harvested and luciferase assayed. Basal data are presented as the ratio of firefly:Renilla luciferase activity, expressed as a percentage of that obtained with the −2237 fusion gene. EGF response data are presented as described in Figure 1B. Results represent the mean ± S.E.M. of 3–7 experiments using three independent preparations of all fusion gene plasmids with each sample assayed in duplicate.
The action of EGF on basal G6Pase fusion gene transcription in HepG2 cells requires HNF-1
We have previously shown using transient transfection and gel retardation assays that HNF-1 binding to Region A acts as an accessory factor to enhance insulin signaling through Region B, rather than acting as a direct target of insulin signaling [3]. To assess whether the HNF-1 binding site in Region A plays a similar role in EGF action, this element was mutated by site-directed mutagenesis within the context of the −231 to +66 G6Pase promoter fragment. Mutation of the HNF-1 binding site reduced the EGF-mediated repression of basal G6Pase-luciferase fusion gene expression compared to the effect seen with the wild-type fusion gene (Fig. 3). Importantly, the inhibitory effect of EGF on basal luciferase expression directed by the −231 HNF-1 SDM construct was equivalent to that seen when Region A was completely deleted, as is the case with the −198 5′ deletion end-point construct (Fig. 3). This result suggests that HNF-1 is the factor that mediates the action of both insulin and EGF through Region A.
Figure 3. The action of EGF on basal G6Pase fusion gene expression in HepG2 cells requires HNF-1.

HepG2 cells were transiently co-transfected with various G6Pase-firefly luciferase fusion genes (15 μg) and expression vectors encoding Renilla luciferase (0.15 μg) and ErbB1 (1 μg). The G6Pase-luciferase fusion genes contained either distinct lengths of wild-type (WT) promoter sequence, as indicated by the 5′ deletion end-point, or a site-directed mutation of the HNF-1 binding site in Region A, designated −231 HNF-1 SDM. Following transfection cells were incubated for 18–20 hr in the presence or absence of 50 ng/ml EGF. Cells were then harvested and luciferase assayed. Results are presented as described in Figure 1B and represent the mean ± S.E.M. of 3–4 experiments using three independent preparations of all fusion gene plasmids with each sample assayed in duplicate. *, p < 0.05 versus −231 WT. Basal fusion gene expression decreased 46 ± 12% when the promoter was truncated from −231 to −198 and by 53 ± 4% when the HNF-1 motif was mutated (n=4; p<0.05).
The action of EGF on basal G6Pase fusion gene transcription in HepG2 cells also requires FOXO1 and either the glucocorticoid receptor or FOXA2
Transient transfection, gel retardation and ChIP experiments have shown that insulin mediates its inhibitory effect on basal G6Pase fusion gene expression by disrupting the binding of FOXO1 to IRS 1 and 2 within Region B [3–5]. Similarly, Jackson et al. [21] have shown that EGF can stimulate the phosphorylation and nuclear exclusion of FOXO1. However, Region B also contains two glucocorticoid response elements (GREs) binding sites, designated GRE A and GRE B (Fig. 4A; Ref. [13]), and previous reports have suggested that both insulin [22] and EGF [23] can directly signal through the glucocorticoid receptor (GR). In addition, Region B contains a FOXA2 binding site (Fig. 4A; Ref. [13, 24]) and recent reports have suggested that insulin can stimulate the phosphorylation and nuclear exclusion of FOXA2 [25, 26]. We therefore compared the roles of FOXO1, GR and FOXA2 in mediating the action of insulin and EGF through Region B.
Figure 4. Mutation of an overlapping GRE and FOXA2 binding site impairs EGF- but not insulin-regulated G6Pase fusion gene expression in HepG2 cells.


Panel A: Region B in the G6Pase promoter contains two overlapping IRSs and GREs and a FOXOA2 binding site. Nucleotide positions are numbered relative to the transcription start site of the mouse G6Pase gene. The various elements are shaded and/or boxed and mutations introduced into the G6Pase-luciferase fusion genes described in Panels B & C are shown in lowercase letters.
Panels B & C: HepG2 cells were transiently co-transfected with various G6Pase-firefly luciferase fusion genes (15 μg) and expression vectors encoding Renilla luciferase (0.15 μg) and either (Panel B) the insulin receptor (1 μg) or (Panel C) ErbB1 (1 μg). The G6Pase-luciferase fusion genes contained either the wild-type (WT) promoter sequence from −231 to +66 or site-directed mutations of the elements indicated in Panel A made in the context of the same promoter fragment. Following transfection cells were incubated for 18–20 hr in the presence or absence of 100 nM insulin or 50 ng/ml EGF. Cells were then harvested and luciferase assayed. Results are presented as described in Figure 1B and represent the mean ± S.E.M. of 4–17 experiments using at least three independent preparations of all fusion gene plasmids with each sample assayed in duplicate. *, p < 0.05 versus −231 WT; **, p<0.05 vs IRS 1 + 2 SDM and GRE B SDM. Basal fusion gene expression decreased 28.1 ± 1.9% (n=26), 26.0 ± 4.8% (n=7) and 32.9 ± 3.1% (n=17) when IRS 1 and 2, GRE A or GRE B were individually mutated and 15.9 ± 4.9% (n=19) when both IRS 1 and IRS 2 and GRE B were mutated in combination (p<0.05).
To address this question we generated mutations within Region B with the goal of selectively impairing FOXO1, GR and FOXA2 binding. The design of such mutants is complicated by the fact that the binding sites for these factors in Region B overlap (Fig. 4A). IRS 1 and IRS 2 were mutated by introducing single point mutations at a site known to inhibit FOXO1 binding (Fig. 5A; Ref. [4]). These mutations leave the FOXA2 binding site and both half sites of GRE B fully intact; the point mutation in IRS 2 is at a variable base in the GR consensus binding sequence that lies in between the two half sites of GRE B (Fig. 4A). Because GRE A completely overlap IRS 1 it is not possible to selectively mutate IRS 1 without affecting GRE A. However, the mutation introduced into IRS 1 only alters a single base pair in GRE A (Fig. 4A). In addition, it is possible to perform the reciprocal experiment by targeting the 5′ half site of GRE A; this allows for selective impairment of glucocorticoid signaling through GRE A without affecting IRS 1. Thus we reasoned that if insulin or EGF signal through FOXO1 bound to IRS 1 and not GR bound to GRE A then mutation of IRS 1 should affect the insulin/EGF response whereas selective mutation of GRE A should not. At that point the effect of mutating IRS 1 could be ascribed to an effect on FOXO1 and not GR binding despite the fact that the IRS 1 point mutation might reduce the affinity of GR binding. We previously identified a mutation that impairs glucocorticoid signaling through GRE A without affecting IRS 1 (Fig. 4A; Ref. [13]). Similarly, we previously identified a mutation that impairs glucocorticoid signaling through GRE B without affecting either IRS 1 or IRS 2 (Fig. 4A; Ref. [13]).
Figure 5. Mutations introduced into the overlapping FOXO1 and FOXA2 binding sites with G6Pase Region B selectively impair FOXO1 and FOXA2 binding.


Panel A: Sense strand sequences of oligonucleotides used in gel retardation studies. Nucleotide positions are numbered relative to the transcription start site of the mouse G6Pase and human IGFBP-1 genes. The various elements are shaded and/or boxed and mutations are shown in lowercase letters. The same mutations were introduced into the G6Pase-luciferase fusion genes described in Fig. 4. Panel B: The labeled WT −197 oligonucleotide was incubated in the absence (−) or presence of a 100- or 250-fold molar excess of the indicated unlabeled competitor DNAs. Bacterial extract from either control (−) or IPTG-treated (+) cells transformed with a plasmid encoding a GST-FOXO1 fusion protein was then added and protein binding analyzed using the gel retardation assay. The specific IPTG-induced FOXO1-DNA complex and a non-specific complex are indicated by arrows. Panel C: The labeled IGFBP-1 oligonucleotide was incubated in the absence (−) or presence of a 100-fold molar excess of the unlabeled oligonucleotide prior to the addition of H4IIE cell nuclear extract (3 μg). Alternatively H4IIE cell nuclear extract was incubated in the absence (−) or presence of the indicated FOXA (FA) antisera prior to the addition of the labeled IGFBP-1 probe and binding cocktail. Protein binding was then analyzed. The arrows point to two complexes that are selectively generated with the FOXA2 antisera. Panel D: Competition experiments were performed as described in Panel C except that a variable molar excess of the indicated unlabeled competitor DNAs was used. Panel E: data from experiments as shown in Panel D were quantitated using a Packard Instant Imager. Results represent the mean ± S.E.M. of 4–6 experiments.
The mutations described above were generated in the context of the −231 to +66 G6Pase promoter fragment and the effect of insulin (Fig. 4B) and EGF (Fig. 4C) on fusion gene expression directed by these constructs was analyzed by transient transfection of HepG2 cells. Mutation of IRS 1 and 2 impaired the ability of insulin to suppress basal G6Pase-luciferase expression whereas the GRE A and GRE B mutations had no effect (Fig. 4B). The combined mutation of IRS 1, 2 and GRE B was no more deleterious to the insulin response than mutation of IRS 1 and 2 alone (Fig. 4B). In contrast, mutation of IRS 1 and 2 as well as GRE B, but not GRE A, impaired the ability of EGF to suppress basal G6Pase-luciferase expression (Fig. 4C). In addition, the combined mutation of IRS 1, 2 and GRE B was more deleterious to the EGF response than either the IRS 1 and 2 or GRE B mutation alone (Fig. 4C). Mutation of a third GR binding site, designated GRE C, which is located 3′ of Region B [13], had no effect on the EGF response (data not shown). These results suggest that insulin repression of basal G6Pase gene transcription required IRS 1 and 2 but not GRE B. In contrast, the data suggest that EGF repression of basal G6Pase gene transcription requires IRS 1 and 2 as well as GRE B.
The GRE B mutation used in this analysis leaves both GR binding to GRE A and FOXO1 binding to IRS 1 and IRS 2 intact but is predicted to simultaneously disrupt GR binding to GRE B as well as FOXA2 binding (Fig. 4A). A key question that we cannot address is whether the effect of EGF through GRE B is mediated by GR or FOXA2. This is because GR and FOXA2 binding cannot be selectively disabled. Only a single base pair of the 12 base pair FOXA2 binding site does not overlap either IRS1, IRS2, GRE A or GRE B (Fig. 4A). We have previously found that mutation of this base pair in addition to the most 5′ base pair of IRS 2, which leaves GRE B intact, had little effect on FOXA2-stimulated G6Pase fusion gene expression [13].
The conclusion that EGF can signal through GR or FOXA2 bound to GRE B is dependent on the GRE B mutation not affecting FOXO1 binding. This appeared likely because otherwise this mutation would have also affected the insulin response. However, gel retardation assays were performed to confirm this point using oligonucleotides that incorporated the same mutations as used in the fusion gene analysis (Fig. 5A). When a labeled oligonucleotide, representing the G6Pase wild-type (WT) sequence between −197 and −159 (Fig. 5A), was incubated with a crude extract, prepared from bacterial cells expressing a GST-FOXO1 fusion protein, a single IPTG-induced protein-DNA complex was detected (Fig. 5B arrow). Competition experiments were performed in which a variable molar excess of various unlabeled oligonucleotides representing wild type or mutated G6Pase sequences were included with the labeled probe. The −197/−159 G6Pase WT and GRE B MUT oligonucleotides (Fig. 5A) competed equally well for complex formation, confirming that the GRE B mutation does not affect FOXO1 binding. In contrast, the −197/−159 IRS 1 + 2 MUT oligonucleotide (Fig. 5A) failed to compete for complex formation, confirming that these mutations abolish FOXO1 binding.
Similarly the conclusion that EGF can signal through FOXA2 or GR bound to GRE B is also dependent on the IRS 1 and 2 mutations not affecting FOXA2 or GR binding. Functional data suggest that GR binding is not affected. Thus, the mutation introduced into IRS 2, which lies within GRE B (Fig. 4A), does not affect glucocorticoid-stimulated G6Pase fusion gene expression [13] whereas the mutation introduced into IRS 1 lies seven base pairs 5′ of GRE B and is highly unlikely to affect GR binding to GRE B.
Gel retardation assays were performed to confirm that the IRS 1 and 2 mutations also do not affect FOXA2 binding. It was necessary to conduct this experiment indirectly since FOXA2 bound very weakly to a labeled oligonucleotide representing the wild-type G6Pase Region B promoter sequence (data not shown). This is consistent with the results of DNase I footprinting assays that show only low affinity FOXA2 binding to Region B [13]. We therefore used a high affinity FOXA2 binding site previously identified in the insulin-like growth factor binding protein-1 (IGFBP-1) promoter [16, 27]. When a labeled oligonucleotide representing the IGFBP-1 promoter sequence from −124 to −96 (Fig. 5A) was incubated with nuclear extract prepared from H4IIE cells a single major protein-DNA complex was detected (Fig. 5C). To demonstrate that this complex represents FOXA2 binding gel retardation assays were performed in which H4IIE cell nuclear extract was pre-incubated with antisera specific for different members of the FOXA class of transcription factors. As can be seen in Figure 5A, addition of antibodies recognizing FOXA2 resulted in the selective disruption of the major complex, whereas antibodies to FOXA1 and FOXA3 had no effect. Concomitant with the disruption of this complex a clear supershift was apparent upon addition of the FOXA2 antisera (Fig. 5C). This result indicates that the specific complex formed with the IGFBP-1 probe contains FOXA2.
Having demonstrated that the major protein-DNA complex represents FOXA2 binding, competition experiments, in which a varying molar excess of unlabeled DNA was included with the labeled probe, were used to compare the affinity of FOXA2 binding to the wild-type G6Pase GRE B sequence and to the same sequence containing the GRE B or IRS 1 + 2 mutations. Figures 5D and 5E show that a wild-type (WT) oligonucleotide, representing the G6Pase GRE B promoter sequence from −188/−171 (Fig. 5A), competed for formation of the FOXA2-DNA complex. The −188/−171 IRS 1 + 2 MUT oligonucleotide (Fig. 5A) competed equally well for complex formation, confirming that the IRS 1 + 2 mutation does not affect FOXA2 binding (Fig. 5D & E). In contrast, the −188/−171 GRE B MUT oligonucleotide (Fig. 5A) failed to compete for complex formation, confirming that this mutation abolishes FOXA2 binding (Fig. 5D & E). The results of these gel retardation assays are therefore consistent with the functional data showing that insulin suppresses G6Pase fusion gene expression through FOXO1 whereas EGF represses basal G6Pase gene transcription through both FOXO1 and either GR and/or FOXA2.
EGF stimulates basal G6Pase fusion gene transcription in cultured hepatocytes
Given the potential for complex EGF signaling through multiple ErbB receptor sub-types [10, 11] we also investigated the regulation of G6Pase fusion gene transcription by EGF in another liver cell model system, namely primary cultures of rat hepatocytes. Since ErbB sub-type expression changes following hepatocyte isolation a G6Pase-luciferase fusion gene construct was transiently expressed in cultured hepatocytes either 2 hrs following isolation, when both ErbB1 and ErbB3 expression are high, or 24 hrs following isolation when only ErbB3 expression is high [17]. There was little effect of EGF on fusion gene expression in native cultured hepatocytes at either time point (Fig. 6). However, when the G6Pase-luciferase fusion gene was co-transfected with an expression vector encoding the ErbB1 receptor, EGF stimulated expression (Fig. 6), the opposite of the effect seen in HepG2 cells (Fig. 1). The magnitude of this stimulation was greater in the cells that were transfected 24 hrs following isolation (Fig. 6).
Figure 6. EGF stimulates basal G6Pase fusion gene expression in rat cultured hepatocytes cells.

Rat cultured hepatocytes were transiently co-transfected either 2 hr (Panel A) or 24 hr (Panel B) after plating with a G6Pase-firefly luciferase fusion gene (2.2 μg) containing promoter sequence from −231 to +66 and expression vectors encoding Renilla luciferase (0.1 μg) and either the empty pEGFP-N1 vector (0.2 μg) or the same vector encoding ErbB1 (0.2 μg). Following transfection cells were incubated for 18–20 hours in serum-free medium in the presence or absence of 50 ng/ml EGF. Cells were then harvested and luciferase assayed. Results are presented as the ratio of firefly:Renilla luciferase activity, expressed as percent control. Results represent the mean ± S.E.M. of 3 experiments using independent preparations of the fusion gene plasmid with each sample assayed in duplicate. *, p < 0.05 versus control.
To begin to delineate the cis-acting elements that mediate this action of EGF, the ability of EGF to stimulate the basal expression of a series of 5′-truncated G6Pase-luciferase fusion genes was analyzed by transient transfection of cultured hepatocytes 24 hrs following isolation. Figure 7 shows that deletion of the G6Pase promoter sequence between −231 and −35 resulted in a decrease in the ability of EGF to stimulate basal G6Pase-luciferase gene expression that did not map to a single promoter region. The shortest fusion gene tested, containing the −35 to +66 G6Pase promoter region, also includes a TATA box motif, an element that has been reported to mediate the EGF-stimulated gene expression [28, 29]. To determine whether the G6Pase TATA box also mediates EGF-stimulated G6Pase gene transcription in cultured hepatocytes we generated a site-direction mutation of this element in the context of the −484 to +66 promoter fragment. This mutation did not abolish the effect of EGF (Fig. 7). The combination of these results suggest that, in cultured hepatocytes, either EGF signals through a specific element in the −35 to +66 G6Pase promoter region or that it targets non-DNA binding factors in the pre-initiation complex.
Figure 7. The stimulatory effect of EGF on basal G6Pase fusion gene expression in rat cultured hepatocytes cells does not map to a specific promoter element.

Rat cultured hepatocytes were transiently co-transfected 24 hr after plating with various G6Pase-firefly luciferase fusion genes (2.2 μg) and expression vectors encoding Renilla luciferase (0.1 μg) and ErbB1 (0.2 μg). The G6Pase-luciferase fusion genes contained either distinct lengths of wild-type (WT) promoter sequence, as indicated by the 5′ deletion end-point, or a site-directed mutation of the TATA box, designated −484 TATA SDM. Following transfection cells were incubated for 18–20 hr in the presence or absence of 50 ng/ml EGF. Cells were then harvested and luciferase assayed. Basal data are presented as the ratio of firefly:Renilla luciferase activity, expressed as a percentage of that obtained with the −231 fusion gene. EGF response data are presented as described in Figure 1B. Results represent the mean ± S.E.M. of 3–5 experiments using three independent preparations of all fusion gene plasmids with each sample assayed in duplicate.
ErbB sub-type expression differs in HepG2 cells and cultured hepatocytes
While there are multiple possible explanations for the opposing effects of EGF on G6Pase-luciferase fusion gene expression in HepG2 cells and cultured hepatocytes, one obvious possibility is that the expression of ErbB sub-types differs. Thus, multiple studies have established that EGF can activate different signaling pathways through different ErbB sub-types [10, 11]. We therefore used Western blotting to determine which ErbB sub-types were expressed in the HepG2 cells used for these studies. Figure 8 shows that ErbB2 and ErbB3 are the predominant ErbB isoforms in our HepG2 cells; ErbB1 and ErbB4 expression was not detected. This contrasts with cultured hepatocytes where ErbB1 and ErbB3 are the predominant isoforms between 0 – 48 hrs after isolation with ErbB2 and ErbB4 expression undetectable [17, 30]. Since the stimulation of G6Pase fusion gene expression in cultured hepatocytes is enhanced by co-expression of ErbB1 (Fig. 6) this suggests that signaling though either ErbB1-ErB1 homodimers or ErbB1-ErbB3 heterodimers mediates this effect; ErbB3 homodimers are unable to signal [10, 11]. Similarly, since strong repression of G6Pase fusion gene expression is only seen in HepG2 cells following co-expression of ErbB1 (Fig. 1) this suggests that signaling though either ErbB1-ErB1 homodimers, ErbB1-ErbB3 heterodimers or ErbB1-ErbB2 heterodimers leads to inhibition of expression (Fig. 1). The latter appeared the most likely explanation for the selective repression of G6Pase expression in HepG2 cells since ErbB1-ErB1 homodimers and ErbB1-ErbB3 heterodimers are also present in cultured hepatocytes in which expression is stimulated.
Figure 8. HepG2 cells predominantly express ErbB2 and ErbB3.
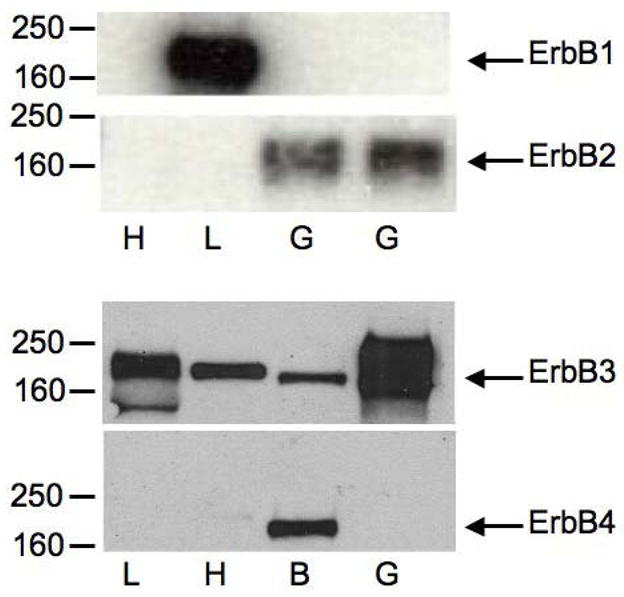
Total cell extracts were prepared from rat heart (H), mouse liver (L), rat brain (B), or HepG2 cells (G). 30 μg (L, H), 60 μg (B), or 50 μg (G) of extract was separated by SDS-PAGE, transferred to nitrocellulose, and immunoblotted with either rabbit ErbB1, ErbB2, ErbB3 or ErbB4 specific antibodies. Antibody binding was detected using chemiluminescence. Representative results are shown.
To explore this hypothesis we made use of two inhibitors, AG825 and AG1478, that selectively block ErbB2 [31] and ErbB1 [32] signaling, respectively. HepG2 cells were transiently co-transfected with a G6Pase-luciferase fusion gene construct and an expression vector encoding the ErbB1 receptor and the ability of EGF to inhibit G6Pase fusion gene expression in the presence or absence of these inhibitors was then assessed (Fig. 9). Surprisingly, the results show that only inhibition of ErbB1 by AG1478 inhibited the effect of EGF with inhibition of ErbB2 by AG825 having no effect (Fig. 9). This suggests that the selective inhibition of G6Pase fusion gene expression in HepG2 cells and not cultured hepatocytes is either (i) dependent on signaling through ErbB1-ErbB2 heterodimers with ErbB2 playing a silent role involving modulation of ErbB1 signaling or (ii) determined by factors other than just the ErbB receptor sub-type, since ErbB1 homodimers and ErbB1-Erb3 heterodimers are presumably present in both cell types.
Figure 9. The repression of basal G6Pase fusion gene expression by EGF in HepG2 cells is selectively blocked by an ErbB2 receptor inhibitor.

HepG2 cells were transiently co-transfected with a G6Pase-firefly luciferase fusion gene (15 μg) containing promoter sequence from −484 to +66 and expression vectors encoding Renilla luciferase (0.15 μg) and ErbB1 (1 μg). Following transfection cells were incubated for 18–20 hours in serum-free medium in the presence or absence of the AG825 (4 μM) and/or AG1478 (4 μM) inhibitors and the presence or absence of 50 ng/ml EGF. The concentration of DMSO, which was used to dissolve the inhibitors, was the same in all samples. Cells were then harvested and luciferase assayed. Results are presented as described in Figure 1B and represent the mean ± S.E.M. of 4 experiments using three independent preparations of the fusion gene plasmid with each sample assayed in duplicate. *, p < 0.05 versus minus inhibitor. Basal fusion gene expression did not change upon addition of AG825 but increased 83.4 ± 18.3% following the addition of AG1478 alone and 89.4 ± 17.1% in combination with AG825 (p<0.05).
EGF inhibits G6Pase fusion gene transcription in mouse liver
While the molecular basis for the opposing effects of EGF on G6Pase-luciferase fusion gene expression in HepG2 cells and cultured hepatocytes is unclear, a key question is which system best reflects the regulation of endogenous G6Pase gene expression by EGF. To address this issue male C57BL/6J mice were fasted overnight and given intraperitoneal injections of either saline or 1.375 mg/kg of murine EGF. Animals were sacrificed and liver removed 3 hrs post injection. Under these conditions plasma glucose levels were unaltered by EGF (68.5 +/− 0.7 mg/dl saline vs. 71.0 +/− 2.8 mg/dl EGF). Figure 10 shows that, like insulin [33], EGF inhibits endogenous hepatic G6Pase gene expression suggesting that while cultured hepatocytes may be a useful model for the analysis of signaling pathways that lead to the stimulation of G6Pase gene expression, HepG2 cells provide a better reflection of the pathways operative in liver.
Figure 10. EGF represses endogenous G6Pase gene expression in mouse liver.
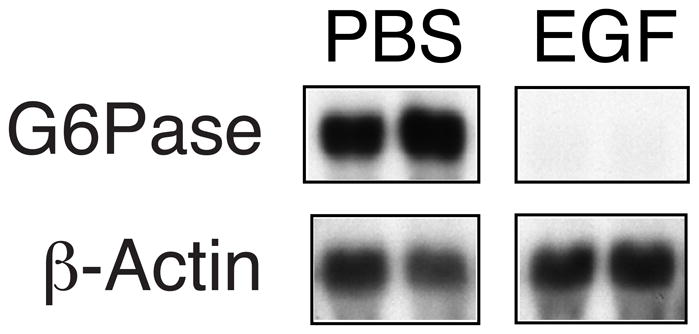
Male mice were fasted overnight and then given intraperitoneal injections of saline or 1.375 mg/kg murine EGF. Animals were sacrificed and liver removed 3 hrs post injection and immediately frozen in liquid nitrogen. G6Pase and β-actin gene expression were then quantitated as described in Experimental.
Discussion
The results presented here show that, while insulin and epidermal growth factor both suppress basal G6Pase fusion gene transcription in HepG2 cells, the mechanisms involved are distinct. Insulin represses G6Pase gene transcription through FOXO1 bound to IRS 1 and 2 (Fig. 4B) and while FOXO1 is also required for the EGF response (Fig. 4C) two other regions are also involved. One is located between −484 and −232; deletion of this region impairs the EGF response (Fig. 2) but not the insulin response [3]. The other is an element located in Region B that binds both FOXA2 and GR; mutation of this element impairs the EGF response (Fig. 4C) but not the insulin response (Fig. 4B).
The observation that FOXA2 is not required for the insulin response is consistent with earlier experiments on the IGFBP-1 promoter in which two IRS motifs that bind FOXO1 [34, 35] overlap an intervening FOXA2 binding site. The overlap between these elements is greater in the IGFBP-1 than G6Pase promoter such that mutation of the IGFBP-1 FOXO1 binding sites also reduces FOXA2 binding though, as with G6Pase, mutation of the FOXA2 binding site core does not affect FOXO1 binding [16, 34, 35]. Moreover, as with G6Pase, the effect of insulin on IGFBP-1 gene expression correlates with FOXO1 and not FOXA2 binding [16, 34, 35]. Thus, mutation of the FOXO1 binding sites impairs both FOXO1 and FOXA2 binding and abolishes the insulin response whereas mutation of the FOXA2 binding site core only affects FOXA2 binding and does not affect the insulin response [16, 34, 35]. However, these observations appear inconsistent with recent data from Wolfrum et al. [25, 26] suggesting that insulin can regulate hepatic gene transcription by stimulating the nuclear exclusion of FOXA2. The reasons for this discrepancy are unclear. There is abundant evidence that FOXO1 regulates G6Pase gene expression. For example, ChIP assays demonstrate that insulin stimulates the dissociation of FOXO1 from the G6Pase promoter [4, 36] and global [37] or liver-specific [38] disruption of the FOXO1 gene impairs the induction of G6Pase gene expression by fasting. However, these data would not preclude the possibility that insulin might regulate G6Pase through both FOXO1 and FOXA2. Indeed, both FOXO1 [13] and FOXA2 [39] can act as positive accessory factors for glucocorticoid-stimulated gene transcription. Moreover, ChIP experiments show that insulin stimulates the dissociation of both FOXO1 and FOXA2 from the PEPCK promoter in rat hepatoma H4IIE cells [36]. Interestingly though, the effect of insulin on FOXO1 binding to the PEPCK promoter precedes that on FOXA2 binding [36]. Other groups have reported somewhat different results in ChIP assays. Zhang et al. [40] also observe FOXA2 binding to the PEPCK promoter in mouse liver, though they report that this binding is not regulated by fasting and re-feeding. In contrast, Wolfrum et al. report no FOXA2 binding to the PEPCK promoter in mouse liver [25], though they do find that overexpression of FOXA2 stimulates PEPCK fusion gene expression in HepG2 cells [26]. The latter observation is easier to reconcile with the reduced PEPCK expression detected in mice with a liver-specific deletion of the FOXA2 gene [40]. Finally, it’s unclear whether the insulin-stimulated inhibition of FOXA2 binding leads to nuclear exclusion since Zhang et al. [40] report that FOXA2 resides solely in the nucleus. Clearly, further studies will be required to resolve the relative roles of FOXO1 and FOXA2 in insulin-regulated gene transcription.
The observation that EGF suppresses endogenous G6Pase gene expression in liver (Fig. 10) is consistent with the observation that insulin has the same effect [33] and that both factors act in part through FOXO1 (Fig. 4). But a key question that remains unresolved is the biological function of hepatic EGF receptors. Previous studies have shown that ErbB1 receptors are abundant in liver [41, 42] and that EGF has multiple effects on cultured hepatocytes including stimulation of glycolysis [43], suppression of PEPCK gene expression [9] and complex, substrate-dependent effects on gluconeogenesis [44]. Under certain conditions the concentrations of plasma EGF would be high enough to manifest such effects [45, 46]. But there is also experimental support for a role of hepatic ErbB receptors in liver regeneration and ligand clearance [41, 42]. Finally, since the liver also produces several ErbB receptor ligands it is possible that ErbB receptors also play an undefined autocrine role in liver function [47]. Future experiments in which ErbB gene expression is selectively disrupted in liver may provide insight into these questions.
Acknowledgments
We thank Graham Carpenter and Jonathan Whittaker for providing the pEGFP-N1-ErbB1 and insulin receptor expression vectors, respectively. We also thank Peter Pedersen and Cindy Zahnow for helpful comments. Research in the laboratory of R.O’B. and W.E.R. was supported by NIH grants DK56374 and DK53804, respectively, and by NIH grant P60 DK20593, which supports the Vanderbilt Diabetes Center Core Laboratory.
Footnotes
Abbreviations Footnote: G6P, glucose-6-phosphate; ER, endoplasmic reticulum; G6Pase, glucose-6-phosphatase catalytic subunit; HNF-1, hepatocyte nuclear factor-1; IRS, insulin response sequence; ChIP, chromatin immunoprecipitation; HGP, hepatic glucose production; EGF, epidermal growth factor; PEPCK, phosphoenolpyruvate carboxykinase; SDM, site-directed mutation; GRE, glucocorticoid response element; IGFBP-1, insulin-like growth factor binding protein-1; GR, glucocorticoid receptor
References
- 1.Van Schaftingen E, Gerin I. The glucose-6-phosphatase system. Biochem J. 2002;362:513–532. doi: 10.1042/0264-6021:3620513. [DOI] [PMC free article] [PubMed] [Google Scholar]
- 2.Chen SY, Pan CJ, Nandigama K, Mansfield BC, Ambudkar SV, Chou JY. The glucose-6-phosphate transporter is a phosphate-linked antiporter deficient in glycogen storage disease type Ib and Ic. Faseb J. 2008 doi: 10.1096/fj.07-104851. [DOI] [PubMed] [Google Scholar]
- 3.Streeper RS, Eaton EM, Ebert DH, Chapman SC, Svitek CA, O’Brien RM. Hepatocyte nuclear factor-1 acts as an accessory factor to enhance the inhibitory action of insulin on mouse glucose-6-phosphatase gene transcription. Proc Natl Acad Sci U S A. 1998;95:9208–9213. doi: 10.1073/pnas.95.16.9208. [DOI] [PMC free article] [PubMed] [Google Scholar]
- 4.Vander Kooi BT, Streeper RS, Svitek CA, Oeser JK, Powell DR, O’Brien RM. The Three insulin response sequences in the glucose-6-phosphatase catalytic subunit gene promoter are functionally distinct. J Biol Chem. 2003;278:11782–11793. doi: 10.1074/jbc.M212570200. [DOI] [PubMed] [Google Scholar]
- 5.Onuma H, Vander Kooi BT, Boustead JN, Oeser JK, O’Brien RM. Correlation between FOXO1a (FKHR) and FOXO3a (FKHRL1) binding and the inhibition of basal glucose-6-phosphatase catalytic subunit gene transcription by insulin. Mol Endocrinol. 2006;20:2831–2847. doi: 10.1210/me.2006-0085. [DOI] [PubMed] [Google Scholar]
- 6.Gross DN, van den Heuvel AP, Birnbaum MJ. The role of FoxO in the regulation of metabolism. Oncogene. 2008;27:2320–2336. doi: 10.1038/onc.2008.25. [DOI] [PubMed] [Google Scholar]
- 7.Barzilai N, Rossetti L. Role of glucokinase and glucose-6-phosphatase in the acute and chronic regulation of hepatic glucose fluxes by insulin. J Biol Chem. 1993;268:25019–25025. [PubMed] [Google Scholar]
- 8.Trinh KY, O’Doherty RM, Anderson P, Lange AJ, Newgard CB. Perturbation of fuel homeostasis caused by overexpression of the glucose-6-phosphatase catalytic subunit in liver of normal rats. J Biol Chem. 1998;273:31615–31620. doi: 10.1074/jbc.273.47.31615. [DOI] [PubMed] [Google Scholar]
- 9.Fillat C, Valera A, Bosch F. Epidermal growth factor inhibits phosphoenolpyruvate carboxykinase gene expression in rat hepatocytes in primary culture. FEBS Lett. 1993;318:287–291. doi: 10.1016/0014-5793(93)80530-8. [DOI] [PubMed] [Google Scholar]
- 10.Linggi B, Carpenter G. ErbB receptors: new insights on mechanisms and biology. Trends Cell Biol. 2006;16:649–656. doi: 10.1016/j.tcb.2006.10.008. [DOI] [PubMed] [Google Scholar]
- 11.Yarden Y, Sliwkowski MX. Untangling the ErbB signalling network. Nat Rev Mol Cell Biol. 2001;2:127–137. doi: 10.1038/35052073. [DOI] [PubMed] [Google Scholar]
- 12.Boustead JN, Stadelmaier BT, Eeds AM, Wiebe PO, Svitek CA, Oeser JK, O’Brien RM. Hepatocyte nuclear factor-4alpha (HNF-4alpha) mediates the stimulatory effect of peroxisome proliferator activated receptor gamma coactivator- 1alpha (PGC-1alpha) on glucose-6-phosphatase catalytic subunit gene transcription in H4IIE cells. Biochem J. 2003;369:17–22. doi: 10.1042/BJ20021382. [DOI] [PMC free article] [PubMed] [Google Scholar]
- 13.Vander Kooi BT, Onuma H, Oeser JK, Svitek CA, Allen SR, Vander Kooi CW, Chazin WJ, O’Brien RM. The Glucose-6-Phosphatase Catalytic Subunit Gene Promoter Contains Both Positive and Negative Glucocorticoid Response Elements. Mol Endocrinol. 2005;19:3001–3022. doi: 10.1210/me.2004-0497. [DOI] [PubMed] [Google Scholar]
- 14.Carter RE, Sorkin A. Endocytosis of functional epidermal growth factor receptor-green fluorescent protein chimera. J Biol Chem. 1998;273:35000–35007. doi: 10.1074/jbc.273.52.35000. [DOI] [PubMed] [Google Scholar]
- 15.Whittaker J, Okamoto AK, Thys R, Bell GI, Steiner DF, Hofmann CA. High-level expression of human insulin receptor cDNA in mouse NIH 3T3 cells. Proc Natl Acad Sci U S A. 1987;84:5237–5241. doi: 10.1073/pnas.84.15.5237. [DOI] [PMC free article] [PubMed] [Google Scholar]
- 16.O’Brien RM, Noisin EL, Suwanichkul A, Yamasaki T, Lucas PC, Wang JC, Powell DR, Granner DK. Hepatic nuclear factor 3- and hormone-regulated expression of the phosphoenolpyruvate carboxykinase and insulin-like growth factor- binding protein 1 genes. Mol Cell Biol. 1995;15:1747–1758. doi: 10.1128/mcb.15.3.1747. [DOI] [PMC free article] [PubMed] [Google Scholar]
- 17.Scheving LA, Zhang L, Stevenson MC, Kwak ES, Russell WE. The emergence of ErbB2 expression in cultured rat hepatocytes correlates with enhanced and diversified EGF-mediated signaling. Am J Physiol Gastrointest Liver Physiol. 2006;291:G16–25. doi: 10.1152/ajpgi.00328.2005. [DOI] [PubMed] [Google Scholar]
- 18.Streeper RS, Chapman SC, Ayala JE, Svitek CA, Goldman JK, Cave A, O’Brien RM. A phorbol ester-insensitive AP-1 motif mediates the stimulatory effect of insulin on rat malic enzyme gene transcription. Mol Endocrinol. 1998;12:1778–1791. doi: 10.1210/mend.12.11.0199. [DOI] [PubMed] [Google Scholar]
- 19.Wang Y, Oeser JK, Yang C, Sarkar S, Hackl SI, Hasty AH, McGuinness OP, Paradee W, Hutton JC, Powell DR, O’Brien RM. Deletion of the gene encoding the ubiquitously expressed glucose-6-phosphatase catalytic subunit-related protein (UGRP)/glucose-6-phosphatase catalytic subunit-beta results in lowered plasma cholesterol and elevated glucagon. J Biol Chem. 2006;281:39982–39989. doi: 10.1074/jbc.M605858200. [DOI] [PubMed] [Google Scholar]
- 20.Chapman SC, Ayala JE, Streeper RS, Culbert AA, Eaton EM, Svitek CA, Goldman JK, Tavare JM, O’Brien RM. Multiple promoter elements are required for the stimulatory effect of insulin on human collagenase-1 gene transcription. Selective effects on activator protein-1 expression may explain the quantitative difference in insulin and phorbol ester action. J Biol Chem. 1999;274:18625–18634. doi: 10.1074/jbc.274.26.18625. [DOI] [PubMed] [Google Scholar]
- 21.Jackson JG, Kreisberg JI, Koterba AP, Yee D, Brattain MG. Phosphorylation and nuclear exclusion of the forkhead transcription factor FKHR after epidermal growth factor treatment in human breast cancer cells. Oncogene. 2000;19:4574–4581. doi: 10.1038/sj.onc.1203825. [DOI] [PubMed] [Google Scholar]
- 22.Pierreux CE, Rousseau GG, Lemaigre FP. Insulin inhibition of glucocorticoid-stimulated gene transcription: requirement for an insulin response element? Mol Cell Endocrinol. 1999;147:1–5. doi: 10.1016/s0303-7207(98)00238-x. [DOI] [PubMed] [Google Scholar]
- 23.Rao KV, Williams RE, Fox CF. Altered glucocorticoid binding and action in response to epidermal growth factor in HBL100 cells. Cancer Res. 1987;47:5888–5893. [PubMed] [Google Scholar]
- 24.Lin B, Morris DW, Chou JY. The role of HNF1alpha, HNF3gamma, and cyclic AMP in glucose-6- phosphatase gene activation. Biochemistry. 1997;36:14096–14106. doi: 10.1021/bi9703249. [DOI] [PubMed] [Google Scholar]
- 25.Wolfrum C, Asilmaz E, Luca E, Friedman JM, Stoffel M. Foxa2 regulates lipid metabolism and ketogenesis in the liver during fasting and in diabetes. Nature. 2004;432:1027–1032. doi: 10.1038/nature03047. [DOI] [PubMed] [Google Scholar]
- 26.Wolfrum C, Besser D, Luca E, Stoffel M. Insulin regulates the activity of forkhead transcription factor Hnf-3beta/Foxa-2 by Akt-mediated phosphorylation and nuclear/cytosolic localization. Proc Natl Acad Sci U S A. 2003;100:11624–11629. doi: 10.1073/pnas.1931483100. [DOI] [PMC free article] [PubMed] [Google Scholar]
- 27.Unterman TG, Fareeduddin A, Harris MA, Goswami RG, Porcella A, Costa RH, Lacson RG. Hepatocyte nuclear factor-3 (HNF-3) binds to the insulin response sequence in the IGF binding protein-1 (IGFBP-1) promoter and enhances promoter function [published erratum appears in Biochem Biophys Res Commun 1994 Dec 15;205(2):1496] Biochem Biophys Res Commun. 1994;203:1835–1841. doi: 10.1006/bbrc.1994.2401. [DOI] [PubMed] [Google Scholar]
- 28.Lim K, Song HJ, Byun SH, Yun KA, Son MY, Park JI, Kweon GR, Yoon WH, Hwang BD. TATA element-binding protein is important to epidermal growth factor-dependent induction of H2B histone gene expression in primary hepatocytes from rat. Biochem Mol Biol Int. 1998;45:575–582. doi: 10.1080/15216549800202972. [DOI] [PubMed] [Google Scholar]
- 29.Zhong S, Zhang C, Johnson DL. Epidermal growth factor enhances cellular TATA binding protein levels and induces RNA polymerase I- and III-dependent gene activity. Mol Cell Biol. 2004;24:5119–5129. doi: 10.1128/MCB.24.12.5119-5129.2004. [DOI] [PMC free article] [PubMed] [Google Scholar]
- 30.Carver RS, Stevenson MC, Scheving LA, Russell WE. Diverse expression of ErbB receptor proteins during rat liver development and regeneration. Gastroenterology. 2002;123:2017–2027. doi: 10.1053/gast.2002.37060. [DOI] [PubMed] [Google Scholar]
- 31.Osherov N, Gazit A, Gilon C, Levitzki A. Selective inhibition of the epidermal growth factor and HER2/neu receptors by tyrphostins. J Biol Chem. 1993;268:11134–11142. [PubMed] [Google Scholar]
- 32.Osherov N, Levitzki A. Epidermal-growth-factor-dependent activation of the src-family kinases. Eur J Biochem. 1994;225:1047–1053. doi: 10.1111/j.1432-1033.1994.1047b.x. [DOI] [PubMed] [Google Scholar]
- 33.Hornbuckle LA, Edgerton DS, Ayala JE, Svitek CA, Oeser JK, Neal DW, Cardin S, Cherrington AD, O’Brien RM. Selective, Tonic Inhibition of G6Pase Catalytic Subunit but not G6P Transporter Gene Expression by Insulin in Vivo. Am J Physiol. 2001;281:E713–725. doi: 10.1152/ajpendo.2001.281.4.E713. [DOI] [PubMed] [Google Scholar]
- 34.Durham SK, Suwanichkul A, Scheimann AO, Yee D, Jackson JG, Barr FG, Powell DR. FKHR binds the insulin response element in the insulin-like growth factor binding protein-1 promoter. Endocrinology. 1999;140:3140–3146. doi: 10.1210/endo.140.7.6856. [DOI] [PubMed] [Google Scholar]
- 35.Guo S, Rena G, Cichy S, He X, Cohen P, Unterman T. Phosphorylation of serine 256 by protein kinase B disrupts transactivation by FKHR and mediates effects of insulin on insulin-like growth factor-binding protein-1 promoter activity through a conserved insulin response sequence. J Biol Chem. 1999;274:17184–17192. doi: 10.1074/jbc.274.24.17184. [DOI] [PubMed] [Google Scholar]
- 36.Hall RK, Wang XL, George L, Koch SR, Granner DK. Insulin represses phosphoenolpyruvate carboxykinase gene transcription by causing the rapid disruption of an active transcription complex: a potential epigenetic effect. Mol Endocrinol. 2007;21:550–563. doi: 10.1210/me.2006-0307. [DOI] [PubMed] [Google Scholar]
- 37.Nakae J, Biggs WH, 3rd, Kitamura T, Cavenee WK, Wright CV, Arden KC, Accili D. Regulation of insulin action and pancreatic beta-cell function by mutated alleles of the gene encoding forkhead transcription factor Foxo1. Nat Genet. 2002;32:245–253. doi: 10.1038/ng890. [DOI] [PubMed] [Google Scholar]
- 38.Matsumoto M, Pocai A, Rossetti L, Depinho RA, Accili D. Impaired regulation of hepatic glucose production in mice lacking the forkhead transcription factor foxo1 in liver. Cell Metab. 2007;6:208–216. doi: 10.1016/j.cmet.2007.08.006. [DOI] [PubMed] [Google Scholar]
- 39.Wang JC, Stafford JM, Scott DK, Sutherland C, Granner DK. The molecular physiology of hepatic nuclear factor 3 in the regulation of gluconeogenesis. J Biol Chem. 2000;275:14717–14721. doi: 10.1074/jbc.275.19.14717. [DOI] [PubMed] [Google Scholar]
- 40.Zhang L, Rubins NE, Ahima RS, Greenbaum LE, Kaestner KH. Foxa2 integrates the transcriptional response of the hepatocyte to fasting. Cell Metab. 2005;2:141–148. doi: 10.1016/j.cmet.2005.07.002. [DOI] [PubMed] [Google Scholar]
- 41.Marti U, Burwen SJ, Jones AL. Biological effects of epidermal growth factor, with emphasis on the gastrointestinal tract and liver: an update. Hepatology. 1989;9:126–138. doi: 10.1002/hep.1840090122. [DOI] [PubMed] [Google Scholar]
- 42.Fisher DA, Lakshmanan J. Metabolism and effects of epidermal growth factor and related growth factors in mammals. Endocr Rev. 1990;11:418–442. doi: 10.1210/edrv-11-3-418. [DOI] [PubMed] [Google Scholar]
- 43.Conricode KM, Ochs RS. Epidermal growth factor and 12-O-tetradecanoylphorbol 13-acetate stimulate lactate production and the pentose phosphate pathway in freshly isolated rat hepatocytes. J Biol Chem. 1990;265:20931–20937. [PubMed] [Google Scholar]
- 44.Soler C, Soley M. Rapid and delayed effects of epidermal growth factor on gluconeogenesis. Biochem J. 1993;294(Pt 3):865–872. doi: 10.1042/bj2940865. [DOI] [PMC free article] [PubMed] [Google Scholar]
- 45.Tebar F, Grau M, Mena MP, Arnau A, Soley M, Ramirez I. Epidermal growth factor secreted from submandibular salivary glands interferes with the lipolytic effect of adrenaline in mice. Endocrinology. 2000;141:876–882. doi: 10.1210/endo.141.3.7384. [DOI] [PubMed] [Google Scholar]
- 46.Tuomela T, Viinikka L, Perheentupa J. Epidermal growth factor in mice: changes during circadian and female reproductive cycles. Acta Endocrinol (Copenh) 1990;123:643–648. doi: 10.1530/acta.0.1230643. [DOI] [PubMed] [Google Scholar]
- 47.Berasain C, Castillo J, Prieto J, Avila MA. New molecular targets for hepatocellular carcinoma: the ErbB1 signaling system. Liver Int. 2007;27:174–185. doi: 10.1111/j.1478-3231.2006.01424.x. [DOI] [PubMed] [Google Scholar]