

Abstract
The interactions of the axial ligands with copper are known to be important in tuning spectroscopic and redox properties of cupredoxins. While conversion of blue copper sites with a weak axial ligand to green copper sites containing a medium strength axial ligand has been demonstrated in cupredoxins, converting blue copper sites to a red copper site with a strong axial ligand has not been reported. Here we show that replacing Met121 in azurin from Pseudomonas aeruginosa with Cys caused an increased ratio (RL) of absorption at 447 nm over that at 621 nm. While no axial Cu-S(Cys121) interaction in Met121Cys was detectable by the extended x-ray absorption fine structure (EXAFS) at pH 5, similar to what was observed in WT azurin with Met121 as the axial ligand, the Cu-S(Cys121) interaction at 2.74 Å is clearly visible at higher pH. Despite the higher RL and stronger axial Cys121 interaction with Cu(II) ion, the Met121Cys variant remains largely a type 1 copper protein at low pH (with hyperfine coupling constant A|| = 54 × 10−4 cm−1 at pH 4 and 5), or distorted type 1 or green copper protein at high pH (A|| = 87 × 10−4 cm−1 at pH 8 and 9), attributable to the relatively long distance between the axial ligand and copper and the constraint placed by the protein scaffold. To shorten the distance between axial ligand and copper, we replaced Met121 with the nonproteinogenic amino acid homocysteine that contains an extra methylene group, resulting in a variant whose spectra (RL= 1.5, and A|| = 180 × 10−4 cm−1) and Cu-S(Cys) distance (2.22 Å) are very similar to those of the red copper protein nitrosocyanin. Replacing Met121 with Cys resulted in lowering of the reduction potential from 222 mV in the native azurin to 95 ± 3 mV for Met121Cys azurin and 113 ± 6 mV for Met121Hcy at pH 7. The results strongly support the “coupled distortion” model that helps explain axial ligand tuning of spectroscopic properties in cupredoxins, and demonstrate the power of using unnatural amino acids to address critical chemical biological questions.
Introduction
Mononuclear copper sites are separated into two distinct classes, type 1 or blue copper proteins and type 2 copper proteins. The blue copper proteins are characterized by their unique strong blue color due to an intense visible absorption around 600 nm (ε ~ 5000 M−1cm−1).1–3 They also exhibit small hyperfine coupling constants (A|| < 100 × 10−4 cm−1) in the electron paramagnetic resonance (EPR) spectrum, which can be either axial (gz>gy≈gx) or rhombic (gz>gy>gx) in nature. The type 1 copper protein spectral features are in direct contrast to the type 2 copper proteins that have much weaker absorption in the visible region (ε ~ 40 M−1cm−1) and larger hyperfine coupling constants. (A|| > 150 × 10−4 cm−1).4,5
Because of these interesting differences, a number of spectroscopic6–16 and x-ray crystallographic studies17–21 have been carried out to better define the structural origin of spectral properties. Recent analysis using nuclear magnetic resonance (NMR) spectroscopy has also helped to assign structural and electrostatic interactions.22–24 Combined, these studies have established that the mononuclear copper bound by type 1 copper proteins is coordinated by one cysteine (Cys112 in azurin) and two histidines (His46 and His117 in azurin) in a trigonal plane (Figure 1). A weak axial ligand, Met121 in azurin, is present at ~ 2.9 Å approximately perpendicular to the plane. The intense absorption at ~ 600 nm has been attributed to the allowed Cys ligand-to-copper charge transfer transition while the weak absorption bands in the same region for the normal type 2 copper proteins have been assigned as parity-forbidden d-d transitions.1–3 In addition, the small A|| and the EPR spectral shape have been ascribed to the a short Cu-Cys bond in type 1 copper sites (~ 2.1 Å). This short bond results in a strong covalent interaction between copper and Cys, allowing the unpaired electron on Cu(II) to be delocalized onto Cys. This delocalization reduces the A|| to be less than that in type 2 copper that has a normal Cu-Cys bond length (2.29 Å).4,5
Figure 1.
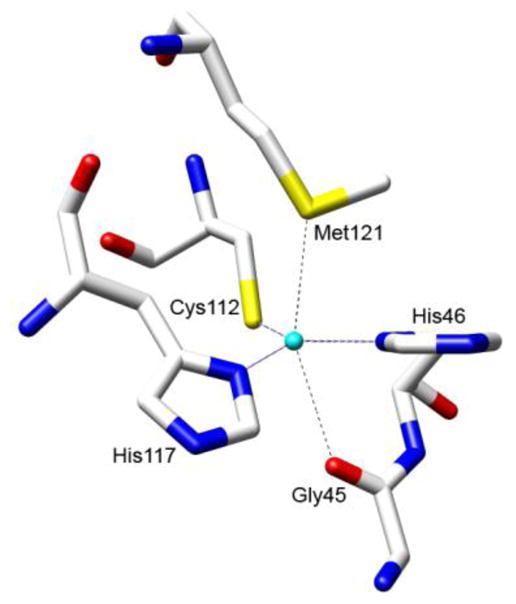
The type 1 copper site in Pseudomonas aeruginosa azurin.
The success in defining the spectroscopic properties of each site has advanced our knowledge in not only biocoordination chemistry but also biological functions of copper proteins. The unique type 1 copper structure is responsible for the interesting spectroscopic features, the high redox potentials, and the efficient electron transfer (ET) rates seen in type 1 proteins in comparison with type 2 copper proteins. As ET proteins, type 1 copper proteins participate in a myriad of biological processes and are, therefore, required to possess tunable redox potentials and ET rates to match those of their partners. A current challenge in the field is to understand how type 1 copper proteins can tune their redox potentials and ET rates without losing their structural identity and functional properties. A major avenue for such tuning is through the interaction between the axial ligand and copper. When the axial ligand is weakly coordinated to the copper ion, such as in azurin from Pseudomonas aeruginosa (Figure 1), the unique trigonal geometry makes it possible for the dx2-y2 ground state of Cu2+ to overlap most favorably with pπ of the Cys ligand, resulting in the short Cu-S bond and giving a strong pπ(Cys)-to-Cu2+ charge transfer band around 600 nm.25,26 However, when the axial ligand becomes stronger, such as in nitrite reductase, a model called “coupled distortion” has been proposed where a strong axial ligand interaction with the copper ion results in a correspondingly longer Cu-Cys bond and rotation of the dx2- y2 ground state of the Cu2+ ion so that it overlaps better with the pσ orbital of Cys.26 Thus a more intense pσ(Cys)-to-Cu2+ charge transfer band at higher energy (~ 400 nm) is observed while the pπ(Cys)-to-Cu2+ charge transfer band around 600 nm becomes less intense. This change results in a strong green color instead of the typical blue color, and therefore these proteins with stronger “coupled distortion” are often called green copper proteins. For different type 1 copper proteins, the relative absorption ratios of 400 nm and 600 nm is a good measure of how strong the axial ligand-copper and Cu-Cys bonds are.27,28 The best manifest of the “coupled distortion” model is a recently discovered red copper protein called nitrosocyanin, which exhibits the most intense pσ(Cys)-to-Cu2+ charge transfer band around 390 nm and the weakest pπ(Cys)-to-Cu2+ charge transfer band around 600 nm among all cupredoxins.29–32 In addition, it also has a longer Cu-S(Cys) bond (2.26 Å) and larger A|| (150 × 10−4 cm−1).
While it is worthwhile to show that the “coupled distortion” model may explain the properties of different copper proteins, an ultimate test of the model and our understanding of the copper proteins is to demonstrate “coupled distortion” in a single protein by transforming one protein into another through axial ligand mutations. Replacement of the weak axial Met121 residue in azurin to stronger coordinating ligands such as His33–36 and Glu,18,37–39 resulted in proteins that displayed spectral similarities to green copper proteins, with small EPR hyperfine couplings (A|| < 100 × 10−4 cm−1), although strong pH dependence of the ratio between the pσ(Cys)-to-Cu2+ charge transfer band around 400 nm and the pπ(Cys)-to-Cu2+ charge transfer band around 600 nm has been observed.18,33 Concurrently, a green copper protein nitrite reductase was converted into a blue copper protein through mutation of Met182 into the much weaker ligand Thr.40 However, examples in which a blue copper protein was transformed into a red copper protein have not been reported, probably because such a transformation requires replacing a weak axial ligand with a stronger ligand while maintaining proper geometry. Such a demonstration of a strong axial ligand interaction that transforms a blue copper into a red copper protein is an important piece of the puzzle in this “coupled distortion” model to explain both structural and functional tuning of this important class of ET proteins.
Herein we report mutation of the axial ligand Met121 in azurin from Pseudomonas aeruginosa (Figure 1) with two stronger ligands, the proteinogenic amino acid Cys using site-directed mutagenesis, and the nonproteinogenic amino acid homocysteine (Hcy) using expressed protein ligation (EPL). In the process, we showed that simple replacement of Met121 with Cys in itself is not sufficient to convert the blue copper into a red copper protein, probably due to the long distance between the sulfur of the axial Cys and copper ion. On the other hand, introducing the longer nonproteinogenic amino acid, Hcy, is sufficient to confer red copper spectral properties. This work demonstrates the power of introducing nonproteinogenic amino acids to address critical chemical and biological questions and to test the “coupled distortion” model in fine-tuning structural and functional properties of copper proteins.
Experimental Section
General
All chemicals were purchased from Sigma-Aldrich with reagent grade or higher purity, and were used without further purification.
Peptide Synthesis
Standard Fmoc-protected amino acids were purchased from Chem Impex International (Wooddale, IL) and Advanced Chemtech (Louisville, KY), and used with the following orthogonal protections, Thr(tBu), Lys(Boc), Ser(tBu), and His(Trt). The terminal Cys residue was coupled as a Boc-protected amine to reduce exposure of Cys to piperidine. Preloaded Fmoc-Lys(Boc)-Wang resin was purchased from Advanced Chemtech and used after swelling for 3 × 8 min in dimethylformamide (DMF).
The 17-mer C-terminus of azurin containing a homocysteine substitution at position 121 (H2N-CTFPGHSALHcyKGTLTLK-OH) was synthesized on a 0.1 mmol scale with a Rainin model PS3 peptide synthesizer (Woburn, MA) using standard Fmoc-based chemistry. Fmoc deprotection for all amino acids except Fmoc-Hcy(Trt)-OH was accomplished using 20% piperidine/DMF (v/v) (3 × 4 min). Fmoc-Hcy(Trt)-OH was deprotected using a reduced exposure time to piperidine (3 × 2 min). All amino acids except Fmoc-Hcy(Trt)-OH and Boc-Cys(Trt)-OH (which was used to reduce exposure to piperidine) were pre-activated with 0.4 M N-methylmorpholine (NMM) for 1.5 min and coupled to the resin with four-fold excess over the resin loading in the presence of 1 equiv. of O-benzotriazole-N,N,N′,N′-tetramethyluronium hexafluorophosphate (HBTU). Both Fmoc-Hcy(Trt)OH (3 equiv) and Boc-Cys(Trt)-OH (3 equiv) were coupled manually in the presence of 2 equiv. of 1-hydroxybenzotriazole hydrate (HOBt) and N,N′-diisopropylcarbodiimide (DIC) in DMF at 25 °C for 2–4 h until full coupling could be observed by qualitative Kaiser tests.
Peptide Cleavage
The resin carrying the fully protected peptide was washed with dichloromethane (3 × 15 mL) and dried under reduced pressure. Peptide cleavage from the resin was achieved by treating the resin with 2% triisopropylsilane (TIPS)/deionized H2O (dH2O)/ethanedithiol (EDT) in 5 mL of neat trifluoroacetic acid (TFA) at 25 °C for 2 h. The cleaved peptide was isolated from the resin by filtration and the residual TFA was removed by rotary evaporation to afford a yellow oil. The peptide was then precipitated by trituration with cold diethyl ether and centrifuged at 2000 × g for 5 min. The peptide was iteratively washed with cold diethyl ether and centrifuged. The crude peptide was then dissolved in a minimal amount (~10–15 mL) of 1:1 dH2O/acetonitrile (MeCN) and lyophilized prior to purification. The crude lyophilized product was purified by preparative RP-HPLC on a Waters Delta Pak C18 column (130 mm × 25 mm) with a water-MeCN solvent system using a gradient of 20–70% of solvent B over 23 min (A: dH2O, 0.1% TFA; B: CH3CN 80% in dH2O v/v, 0.1% TFA). The purified peptide was then lyophilized directly after purification to afford a white solid and analyzed by MALDI-TOF-MS. Met121Hcy Azurin 17-mer (H2N-CTFPGHSALHcyKGTLTLK-OH), calcd: 1791.14, found: 1791.5.
Expressed Protein Ligation
Cultures of E. coli BL21 (DE3) cells containing a plasmid to express the azurin(1–111)-Intein-CBD fusion protein were grown in LB media for 8 h at 37 °C and were used to inoculate eight 2 L flasks of LB media containing 100 μg/mL ampicillin. The cells were grown at 37 °C for 16 h with shaking at 210 rpm. Protein expression was induced at ~16 h with 0.5 mM IPTG and induction was continued for 4 h at 37 °C. The cells were then harvested at 9800 × g, stored at −20 °C and used when needed.
For ligations, the above frozen cell stock was re-suspended in a lysis buffer containing 20 mM HEPES, pH 8.0, 250 mM NaCl, 1 mM EDTA, 1 mM PMSF 0.1% Triton-X-100, and 1 M urea. The suspension was then lysed using sonication (Misonix Sonicator 4000, 0.5 inch diameter probe) for a total work time of 9 min (6 s on, 10 s rest). The lysate was centrifuged at 13250 × g for 30 min at 4 °C. The fusion protein was then bound by batch absorption to 100 mL of chitin resin that had been pre-equilibrated with 20 mM HEPES, pH 8.0, 250 mM NaCl, and 1 mM EDTA (buffer 1) for 1–2 h at 4 °C. The chitin resin was then poured into a column and the column headspace was purged with Ar. The column was then washed with 3 column volumes of buffer 1 under Ar pressure.
Ligation was initiated by the addition of the 17-mer peptide (1.4 mM, 85 mg) and tris-(2-carboxyethyl)phosphine (TCEP) (2 mM, 20 mg) in 35 mL of buffer 1 containing 50 mM 4-mercaptophenylacetic acid (MPAA) under Ar and transferred directly to the column by Ar pressure. The chitin resin was then re-suspended in the column and the entire column was agitated gently at 4 °C for 66 h.
After ligation, the column was eluted under Ar pressure and washed with 1 column volume of buffer 1. The eluent was centrifuged at 13250 × g for 30 min and the supernatant was concentrated using 10,000 MWCO Centricon concentration spin tubes at 2980 rcf to a final volume of ~20 mL. The concentrated protein was then exchanged into 50 mM MOPS buffer, pH 7 via G25 Sephadex.
After exchanging buffers, the protein was then refolded. Dithiothreitol (DTT) (0.9 mM) and guanidinium hydrochloride (GdmHCl) (4 M) were added directly to the protein sample. After full dissolution, the sample was left to sit at 25 °C without disruption for 20 min. The denatured sample was then added dropwise to a 50× volume of 50 mM MOPS buffer, pH 7 at 4 °C containing DTT (0.9 mM). The refolded sample was then exchanged into fresh 50 mM MOPS buffer, pH 7.0 at 4 °C using G25 Sephadex. Following concentration of the sample, the protein was titrated with either Cu(II)SO4 or tetrakis(acetonitrile)copper(I) hexafluorophosphate.
The Cu(II) samples were prepared by titrating with subequivalent additions of Cu(II) to apo-proteins until saturation of the LMCT at 590 nm. The titrated samples were then purified separately using a Pharmacia Q HiTrap HP column (5 mL), which had been washed with 10 column volumes of 1 M NaCl in H2O and then equilibrated with 10 column volumes of 50 mM MOPS, pH 7.
Met121Cys Azurin Preparation
A construct containing a methionine-to-cysteine mutation at position 121 in azurin was created using the Quikchange mutagenesis method (Stratagene, La Jolla, CA). The gene for WT azurin located in a pET9a plasmid was used as the template. The primers used were as follows:
Forward: 5′-CACTCCGCACTGTGCAAAGGTACCCTG-3′
Reverse: 5′-CAGGGTACCTTTGCACAGTGCGGAGTG-3′
The parental DNA was digested with Dpn1 at 37 °C for 2 h following the completion of PCR and E. coli BL21 (DE3) cells were transformed with the plasmid. The mutation was confirmed by sequencing of the insert DNA. The protein was then over-expressed and purified using methods analogous to previous protocols.41,42 The protein was titrated with Cu(II)SO4 as a single batch and exchanged into a Universal Buffer (UB) buffer (100 mM NaCl, 50mM NH4OAc and 40 mM each MES/MOPS/TRIS/CAPS) at pH 5.0 by G25 Sephadex PD10 columns (GE Lifesciences).
Protein pH titrations
The fully exchanged holo-Met121Cys azurin protein in the above listed UB buffer was further exchanged into UB buffer at pH 4.0, 5.0, 6.0, 7.0, 8.0, and 9.0.
UV-Visible, MS, and EPR spectroscopic studies
UV-Vis spectra were taken on an HP Diode Array Spectrometer or a Cary 5000 spectrometer. X-band EPR spectra were collected on a Varian E-122 spectrometer at the Illinois EPR Research Center (IERC). The samples were run at ~30 K using liquid He and an Air Products Helitran cryostat with 50% glycerol. Magnetic fields were calibrated with a Varian NMR gaussmeter and the frequencies were measured with an EIP frequency counter.
EPR spectra were simulated with SIMPOW6.43 The five pH dependent spectra for the Met121Cys azurin mutants were simultaneously fitted so as to minimize the total rms difference between the experimental and simulated spectra. For the spectrum of the Met121Hcy mutant both copper isotopes (69.1% 63Cu and 30.9% 65Cu, A(65Cu/63Cu) =1.07125) were included discretely in the simulation. For the sake of comparison, the parameters reported in Table S2 are the weighted averages for the two isotopes.
Collection and Analysis of XAS Data
Cu K-edge (8.9 keV) extended x-ray absorption fine structure (EXAFS) and x-ray absorption near edge structure (XANES) data were collected at the Stanford Synchrotron Radiation Lightsource operating at 3 GeV with currents between 100 and 80 mA. All samples were measured on beam line 9–3 using a Si[220] monochromator and a Rh-coated mirror upstream of the monochromator with a 13 KeV energy cutoff to reject harmonics. A second Rh mirror downstream of the monochromator was used to focus the beam. Data were collected in fluorescence mode using a high-count-rate Canberra 30-element Ge array detector with maximum count rates below 120 kHz. A 6μ Z-1 Ni oxide filter and Soller slit assembly were placed in front of the detector to reduce the elastic scatter peak. Six scans of a sample containing only sample buffer were collected, averaged, and subtracted from the averaged data for the protein samples to remove Z-1 Kβ fluorescence and produce a flat pre-edge baseline. The samples (80 μL) were measured as aqueous glasses (>20% ethylene glycol) at 8–10 K. Energy calibration was achieved by reference to the first inflection point of a copper foil (8980.3 eV) placed between the second and third ionization chamber. The data were carefully monitored for photoreduction, and where evident, only the first spectrum of a series was included in the final average. In such cases, a new sample spot was chosen for each spectrum included in the average.
Data reduction and background subtraction were performed using the program modules of EXAFSPAK 44. Data from each detector channel were inspected for glitches and spectral anomalies before inclusion in the final average. Spectral simulation was carried out using the program EXCURVE 9.2 45–48 as previously described 49.
EXAFS data were simulated using a mixed-shell model consisting of imidazole and thiolate-S coordination. The imidazole ring geometry was constrained to ideal values of the internal bond lengths and angles, while the first-shell distance (R) and Debye Waller factor for the Cu-N(imid) shell (including the single and multiple scattering contributions for the imidazole rings), the Cu-S shells, and E0 were refined. In these preliminary refinements, the imidazole ring outer shell C and N atoms were constrained to move relative to the first shell Cu-N distance so as to maintain the idealized ring geometry. Later in the refinement, this constraint was lifted, and the outer shells of the imidazole rings were allowed to float within 10 percent of their original idealized positions. In practice final outer shell coordinates for acceptable fits deviated by less than the permitted amount from the idealized position. Parameters refined in the fit included shell occupancy N, Cu-scatterer distance R, and Debye-Waller factor (2σ2) for each shell, and E0 the threshold energy for photoelectron ionization which was constrained to be the same for all shells of scatterers.
Electrochemical Measurements
The reduction potential of each mutant was determined by cyclic voltammetry after verifying the WT azurin reduction potential using a CH Instruments 617A potentiostat equipped with a picoamp booster and a Faraday cage. A pyrolytic graphite edge (PGE) electrode was polished and 2–3 μL protein solution was applied directly to the electrode following previously described methods.50 After a short incubation time, the electrode was immersed in either 20 mM NaOAc, pH 4.0 with 100 mM NaCl, 20 mM NH4OAc, pH 5.0 with 100 mM NaCl, or 25 mM KH2PO3, 100 mM KCl before data collection. Each protein was then sampled at varying scan rates between 10 mV and 500 mV. The reduction potentials were measured against Ag/AgCl and converted to NHE.
Results and Discussions
Preparation of Met121Cys Azurin
Although azurin has been subjected to numerous site-directed mutagenesis studies to investigate the effects of substitution by proteinogenic and nonproteinogenic amino acids on redox and ET properties,8,18,33,35,36,39,51–61 these studies have provided little information regarding how to create red copper sites in blue copper scaffolds to test the “coupled distortion” model. Previous reports of Met121His and Met121Glu variants of azurin show the transformation of blue copper proteins into green copper proteins, but not into red copper proteins.18,33 Here we chose to use another strong ligand, Cys, to help confirm the “coupled distortion” model. Although the Met121Cys mutation has been listed as part of Met121 site-saturated cassette mutagenesis studies,37,53,56 a full report characterizing an azurin containing a free thiolate amino acid in the Met121 axial position is not available. Therefore we replaced Met121 in azurin with cysteine using standard site-directed mutagenesis protocols. Following verification of the correct amino acid change, the protein was expressed analogously to azurin mutants previously reported.41 The yield of recombinant expressed Met121Cys azurin mutant was ~30 mg/L growth media, comparable to that of WT azurin. The protein was then directly titrated with Cu(II)SO4 resulting in a color change from colorless to blue. ESI-MS analysis of the protein showed only a single copper ion bound in the protein (MW: 13982; cal MW: 13982; see supporting information).
UV-Vis Spectral Characterization of Met121Cys Azurin
A comparison between the UV-Vis spectrum of Met121Cys azurin with that of wild type (WT), Met121His and Met121Glu azurin reveals similarities and differences. Like WT azurin, Met121Cys azurin at pH 5 displays a strong absorption band around 621 nm while displaying a weaker band at 447 nm (Figure 2, Table 1). As the more intense peak is closer to the LMCT band found in WT azurin, we assigned the absorbance at 621nm as the pπ (Cys)-to-Cu2+ charge transfer (CT) band, similar to how the bands were assigned for Met121His azurin and Met121Glu azurin at pH 4.18,33 In contrast to WT azurin, but similar to Met121His and Met121Glu azurin at pH 4, the intensity of the absorbance at 447 nm, assignable to the pσ(Cys)-to-Cu2+ charge transfer is higher than that of WT azurin, suggesting that introduction of the stronger axial ligand Cys resulted in more overlap of pσ(Cys) and the dx2-y2 ground state of Cu2+. The ratio of the two peaks, RL [=ε(high energy)/ε(low energy)] can provide a means to measure contributions of each transition, as a lower RL values indicates more pπ(Cys)-to-Cu2+ charge transfer while a higher RL suggests more pσ(Cys)-to-Cu2+ charge transfer.27,28,62,63
Figure 2.
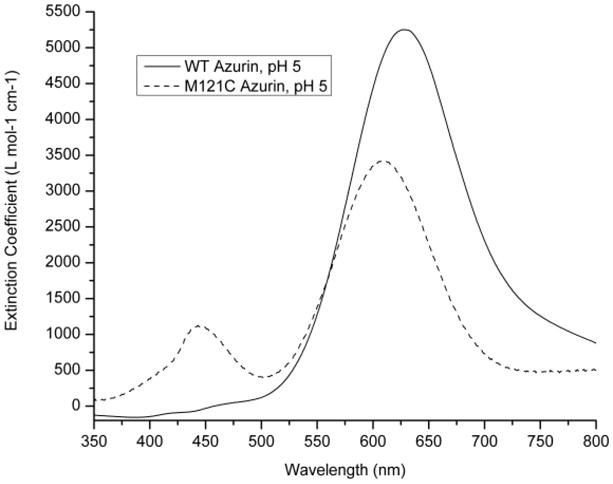
UV-visible spectrum for Met121Cys azurin at pH 5 in UB buffer (see experimental) and comparison with WT azurin.
Table 1.
Spectroscopic and EPR spin parameters for azurin, its variants, and WT nitrosocyanin
| pH | λ max (nm) | RL values (~400nm/~600nm) | Az (10−4 cm−1) | gz | |
|---|---|---|---|---|---|
| WT Azurin | 5 | 628 | NR | 66 | 2.25 |
| Met121His | 7 | 440, 600 | 2 | 102 | 2.24 |
| Met121Glu | 7 | 450, 615 | 2.5 | 83 | 2.3 |
| Met121Cys | 4 | 451, 627 | 0.05 | 54* | 2.26* |
| Met121Cys | 5 | 447, 621 | 0.15 | 54* | 2.26* |
| Met121Cys | 6 | 444, 615 | 0.23 | 18* (65) | 2.29* (2.02) |
| Met121Cys | 7 | 441, 612 | 0.29 | 18* (65) | 2.29* (2.02) |
| Met121Cys | 8 | 434, 608 | 0.55 | 87* | 2.25* |
| Met121Cys | 9 | 430, 591 | 1.47 | 87* | 2.25* |
| Met121Hcy | 7 | 410, 590 | 1.5 | 180 | 2.25 |
| Nitrosocyanin | 7 | 390, 500 | 2.5 | 147 | 2.24 |
The parameters are from the main species observed at the pH.
g value and hyperfine splitting in parenthesis are along the x axis.
While it is interesting to find that a stronger axial ligand (e.g., Cys) resulted in a higher ratio, a trend predicted by the “coupled distortion” model and found in both Met121His and Met121Glu azurin, the magnitude of the ratio is not consistent with the model, as the stronger Cys ligand should result in a much higher RL value than that of nitrite reductase because nitrite reductase has a Met at the axial ligand position.
Therefore the Met121Cys copper site was subjected to a pH titration to determine if at higher pH values, deprotonation Cys121 would result in more interaction with the Cu(II) ion. As shown in Figure 3, adjusting the pH values from 4 to 9 resulted in a decrease of 621 nm band and increase of 420 nm band, and thus the RL value, indicating deprotonation of Cys121 did result in stronger interaction with the Cu(II) ion.
Figure 3.
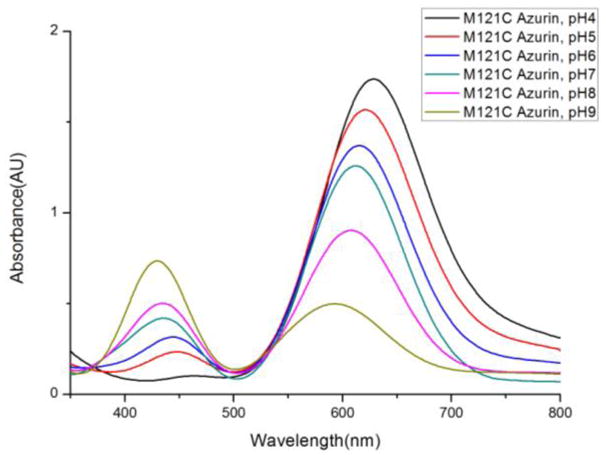
UV-visible spectrum for Met121Cys azurin at varying pH values from 4–9 in UB buffer (see experimental).
X-Band EPR Characterization of Met121Cys Azurin
To probe the effect of the Met121Cys mutation on the geometry and Cu-S(Cys112) covalency, X-band EPR spectroscopy was obtained (Figure 4). Based on EPR simulations (see Table S1 in supplemental information), up to four species are observed at different pH values. At pH 4 the spectrum is dominated by one species (#1) which is characteristic of a Type 1 copper, with a hyperfine splitting of A|| = 54 × 10−4 cm−1 (Table 1), similar to that of WT azurin. As the pH is raised to pH 6 and 7, a second species was observed with Ax > Az which is opposite from what is seen in Azurin and most square-planer copper complexes, and similar to that of stellacyanin. The reversal of the ordering of hyperfine splittings in stellacyanin has been attributed to admixture of dz2 character, resulting from a replacement of the Met121 with a glutamine ligand.64 Similar spectra have also been observed in the low pH forms of the Met121Glu, Met121His, and Met121Lys mutants.33,38 Above pH 7, two species appeared (#3 and #4) (see Table 1). Interestingly, a decrease in gz was observed of species #3 (to gz=2.179), suggesting the two sulfurs might be are on an equatorial plane. However, we do not have other data to support this hypothesis. In particular, species #4 is similar to those of the high pH forms of Met121Glu, Met121His, and Met121Lys mutants.33,37 Therefore, even though the UV-vis spectra at high pH (e.g., pH 9, see Figure 3) resemble that of nitrosocyanin, each of the species display A|| ≤ 87 × 10−4 cm−1 (see Table 1), which is in the range of the type 1.5 or green copper proteins and thus suggest that the Cys121, even at high pH, cannot exert strong enough axial interaction to convert the blue copper into a red copper protein.
Figure 4.

X-band EPR spectra of Met121Cys azurin at different pH values. The EPR spectra are in black while the simulated spectra are in red. X-band experimental conditions: microwave frequency, 9.04 GHz; power, 0.2 mW; modulation amplitude 5 G, time constant, 32 ms; sweep time, 60 s; number of scans, 10; gain, 8000; temperature, 29 K. The spike at g=2.0 signal is an artifact of the EPR tubes used.
Preparation of Met121Hcy Azurin
The presence of different species in the EPR spectrum at different pH for the Met121Cys azurin variant may be attributed to site destabilization. Replacing Met121 with Hcy should provide a more stable copper center than Cys as the extra methylene group in Hcy can provide a shorter bond distance between the thiolate and copper. To incorporate the nonproteinogenic amino acid Hcy, we chose expressed protein ligation (EPL), which uses the natural protein splicing ability of inteins to create recombinant protein thioesters.65,66 In the presence of synthetic peptides containing free thiols in the side chain of the N-terminal residue such as Cys, the protein thioester can undergo a chemoselective transthioesterification to perform native chemical ligation creating a protein that is indistinguishable from recombinantly expressed WT protein.51,52,60 Azurin has been shown to be well suited for this technique and our lab has successfully shown that substitution of Met121 with nonproteinogenic amino acids can be accomplished using EPL.51,52,55,60 Therefore, the synthesis of a 17-mer peptide consisting of the final C-terminal 17 amino acids of azurin containing homocysteine at position 121 in place of Met was completed. The typical yields of the purified peptide were approximately 60–80 mg of peptide for a 0.1 mmol synthesis affording sufficient material for semi-synthesis of Met121Hcy azurin using EPL. The protein yield following EPL using the 17-mer peptide containing Hcy was similar to the standard WT 17-mer sequence (3–5 mg/L growth). In subsequent attempts to increase the yield of the Hcy protein variant, a modified procedure was performed in which an anaerobic environment was maintained for the duration of the ligation. This modification resulted in moderate yield improvements (5–7 mg/L growth) over using aerobic conditions and was used thereafter. The observed molecular weight (13933) matches that of calculated MW (13932, see supplemental information).
UV-Vis Spectral Characterization of Met121Hcy Azurin
UV-Vis spectroscopy was used first to characterize the Met121Hcy protein. Upon addition of Cu(II) to apo-Met121Hcy azurin, a stronger peak was observed around 410 nm, together with a weaker peak around 590 nm (Figure 5). This higher RL ratio is in direct contrast to that of WT azurin and different from the Met121Cys azurin at low pH. Unlike Met121Cys Az, the UV-vis spectrum of Met121Hcy Az shows no dependence on pH. It would be expected that much of the Hcy thiolate would remain protonated at low pH (as the calculated pKa value for Hcy is ~10) and should result in spectra similar to Met121Cys azurin. However, the RL ratio is reversed from Met121Cys azurin, suggesting a strong interaction between the copper ion and Hcy. Most importantly, the spectrum is remarkably similar to that seen in the red copper protein nitrosocyanin even though the molar absorptivities of the peaks are lower.29–32
Figure 5.
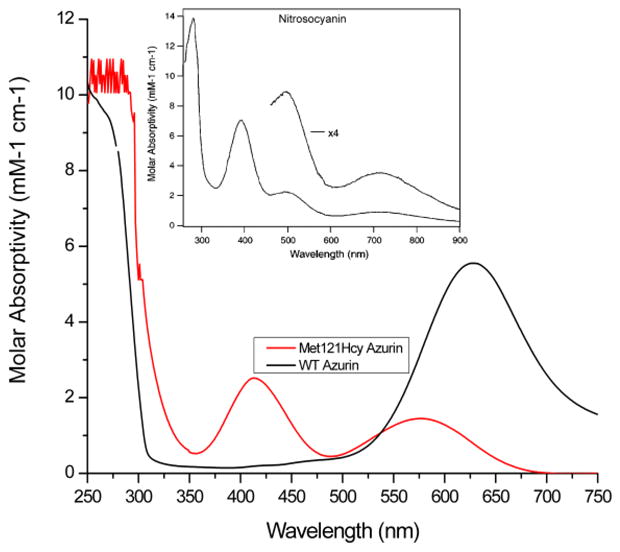
Visible spectra of Met121Hcy and WT azurins in 50 mM MOPS, pH 7. The absorption below 300 nm was off scale due to oversaturation of the detector. Inset, visible spectrum of nitrosocyanin.29
X-band EPR Characterization of Met121Hcy Azurin
The similarity to red copper protein is further supported by EPR spectroscopy. The X-band EPR spectrum shown in Figure 6 displays a much larger parallel hyperfine splitting in the Met121Hcy mutant when compared to both WT azurin, the green copper azurin mutants (Met121His and Met121Glu) as well as the Met121Cys mutant at low pH (see Table 1 and Table S2). Both the shape of the spectrum and the hyperfine splittings are very similar to that of red copper nitrosocyanin (Table 1).29–32 The additional superhyperfine splitting along g⊥ indicates a stronger interaction between the copper and two equivalent nitrogen atoms, a feature also found in native nitrosocyanin.30 The A values of ~15 × 10−4 cm−1 for the hyperfine pattern are also consistent with nitrogen ligands coordinated to a copper. In contrast to the EPR spectrum for Met121Cys, the EPR spectrum for Met121Hcy indicates a single species at multiple pH values, suggesting that the Met121Hcy azurin is a more stable site. However, in contrast to Met121Cys azurin, Met121Hcy azurin is unstable and loses copper at pH values lower than 6 and higher than 8 (data not shown).
Figure 6.
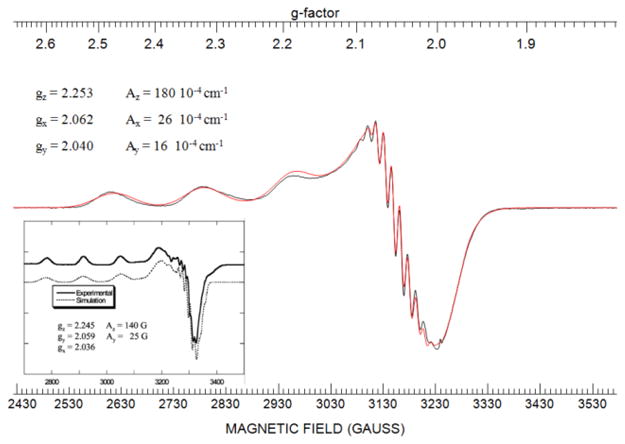
X-band EPR spectrum (in black) and its simulated spectrum (in red) of Met121Hcy azurin. X-band experimental conditions: microwave frequency, 9.05095 GHz; power, 0.2 mW; modulation amplitude 5 G, time constant, 32 ms; sweep time, 60 s; number of scans, 30; gain, 1000; temperature, 29 K. Inset: X-band EPR spectrum of nitrosocyanin from ref 30.
These results strongly suggest that introducing the nonproteinogenic amino acid Hcy has transformed the blue copper protein Az into a red copper protein; the extra methylene group provides sufficient length to allow for a strong Hcy-Cu interaction. Previous demonstrations of the “coupled distortion” model have focused on replacing a medium strength ligand such as Met with weaker ligands, such as Thr. This is the first time that a medium strength ligand has been replaced with a much stronger ligand (thioether vs. thiolate).
EXAFS characterization of Met121Cys and Met121Hcy Azurins
Though Met121Hcy shares spectroscopic similarities with nitrosocyanin, it was imperative to identify the ligand set bound to the Cu ion. Since nitrosocyanin contains a Cu2+ coordinated to one Cys, two His, one Glu and one water in the oxidized state, which is different from the ligands donor set in the azurin variant investigated here, it was necessary to perform EXAFS to provide more structural information. In order to determine the coordination of Cu(II) in the Met121Cys and Met121Hcys derivatives in more details, EXAFS data was collected, calibrating the data against the well studied EXAFS-derived structure of the WT azurin.52 EXAFS data for the WT and Met121 variant proteins are shown in Figs 7 with the EXAFS generated structural parameters listed in Table 2. As expected, the WT protein can be simulated with two histidines and one cysteine coordinated to Cu at distances of 1.95 and 2.18 Å respectively (Figure 7a). The latter distance is 0.04 Å longer than reported previously,52 but is within the range of values typically reported by EXAFS and crystallography for the Cu(II)-Cys112 interaction.9,67
Figure 7.
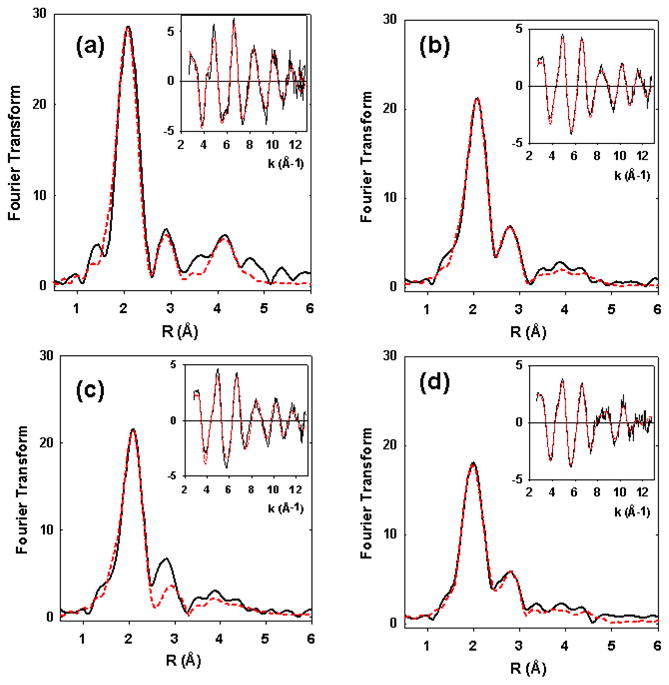
Fourier transform and EXAFS (inset) for the WT azurin and Met121Cys and Met121Hcy variants. Experimental data are shown as solid black lines and the simulation is shown by dashed red lines. Parameters used to fit the data are listed in Table 2. (a) WT azurin at pH 5.0; (b) Best fit of Met121Cys variant at pH 7 (bolded in Table 2) with one short (2.17 Å) and one long (2.74 Å) Cu-S interaction; (c) The best fit of Met121Cys variant at pH 7, obtainable using only the short Cu-S distance; (d) Met121Hcy variant at pH 7.
Table 2.
EXAFS fitting parameters. Best fits are shown in bold
| Sample/Fit | Fa | Cu-S | Cu-N(His)b | E0 | ||||
|---|---|---|---|---|---|---|---|---|
| Noc | R (Å)d | DW (Å2)e | Noc | R (Å)d | DW (Å2)e | |||
| WT | ||||||||
| A | 0.402 | 1 | 2.18 | 0.003 | 2 | 1.95 | 0.009 | −0.763 |
| Met121Cys | ||||||||
| pH5 | ||||||||
| A | 0.285 | 1 | 2.17 | 0.009 | 2 | 1.96 | 0.015 | 0.486 |
| 1 | 2.76 | 0.014 | ||||||
| B | 0.326 | 1 | 2.17 | 0.007 | 2 | 1.93 | 0.014 | 0.326 |
| Met121Cys | ||||||||
| pH7 | ||||||||
| A | 0.165 | 1 | 2.17 | 0.008 | 2 | 1.95 | 0.020 | 0.370 |
| 1 | 2.74 | 0.012 | ||||||
| B | 0.366 | 1 | 2.16 | 0.007 | 2 | 1.93 | 0.020 | 1.846 |
| Met121HCy | ||||||||
| A | 0.388 | 1 | 2.22 | 0.014 | 2 | 1.97 | 0.012 | −2.05 |
| 1 | 2.79 | 0.030 | ||||||
| B | 0.486 | 1 | 2.20 | 0.014 | 2 | 1.96 | 0.012 | −2.00 |
F is a least-squares fitting parameter defined as
Fits modeled histidine coordination by an imidazole ring, which included single and multiple scattering contributions from the second shell (C2/C5) and third shell (C3/N4) atoms respectively. The Cu-N-Cx angles were as follows: Cu-N-C2 126°, Cu-N-C3 -126°, Cu-N-N4 163°, Cu-N-C5 -163°.
Coordination numbers are generally considered accurate to ± 25%
In any one fit, the statistical error in bond-lengths is ±0.005 Å. However, when errors due to imperfect background subtraction, phase-shift calculations, and noise in the data are compounded, the actual error is probably closer to ±0.02 Å.
Debye-Waller factors are quoted as 2σ2
For the Met121Cys variant the data is definitive that only a single cysteine coordinates as a strongly bound (covalent) ligand with Cu-S bond length of 2.17 Å. Inclusion of an additional O/N scatterer modeled on the equatorial water ligand present in nitrosocyanin30 failed to provide any improvement in the goodness of fit, and in all cases refined with a large Debye-Waller factor. We also investigated whether the thiolate at residue 121 could form a longer weaker bond to copper. The presence of contributions from outer shells of the coordinating imidazole ligands around 3 Å could potentially obscure the presence of a single S scatterer between 2.6 and 3.0 Å, and it was therefore necessary to carefully quantify the improvement in least squares residual resulting from the inclusion of the additional Cu-S interaction. At pH 5, a slight improvement (13%) in the goodness of fit parameter was obtained when a additional S was included in the fit refining to 2.76 Å, while at pH 7 the improvement was significant with the F value dropping by 55%. Fig 7c shows the best fit obtained in the absence of the long sulfur ligand, showing inadequate intensity in the FT peak around R=2.7 Å. Therefore the data are unambiguous in defining the presence of an additional Cu-S interaction at 2.7 Å.
Since the pH values were recorded at room temperature and the effective pH of the buffer used for these experiments increased with decreasing temperature (see supplemental data), the actual pH values at 10 K should be higher. In addition, the UV-vis and EPR data suggest mixture of species at both pH 5 and 7. Therefore these results suggests the presence of mostly a mono-thiolate copper at low pH, with the second Cys, most likely Cys121 remaining protonated and interacting weakly with the copper. At high pH, however, deprotonation of the second Cys121 results in coordination of the thiolate of Cys121 to Cu(II) at a distance ~0.2 Å shorter than that of the native Met121 (2.74 vs 2.9 Å), and suggests that protein-folding constraints prevent the thiolate from bonding more strongly to the copper center. This contrasts with other (Cys)2His ligand sets such as that found in Cu(II)-Sco1 where both Cys residues coordinate Cu(II) at an average distance of 2.21 Å.68 Correlation with EPR and UV/vis data on Met121Cys therefore suggests that the axial interaction is strengthened through the increased ligand field strength of the Cys residue even though the bond-length to the axial ligand decreases only slightly.
The best fit for the EXAFS spectrum of Met121Hcy Az also shows two Cu-S interactions (Fig. 7d), presumably arising from Cys112 and Hcy121. Interestingly, the bond lengths of the two Cu-S are similar to those found in Met121Cys at high pH. While this result may appear counterintuitive because the side chain of Hcy is one methylene group longer than that of Cys and thus should have resulted in shorter Cu-S distance, it is possible that the interaction between Hcy121 and copper ion so strong that the axial and equatorial ligands have been interchanged with homocysteine now occupying an equatorial position and cysteine occupying the axial position. While this may appear to require a large reorganization of the Cu(II) center there is ample precedent for significant ligand movement in other variants of azurin. For example, in M121H, the side chain of residue 121 moves so as to allow coordination of the histidine at 2.2 Å from the Cu(II) center,34 suggesting that there is little steric restraint on movement of the native M121 residue. Similarly, recent structures of the C112D variants (called the type zero copper) demonstrate flexibility of the side chain of residue 112.69 Here an O of the carboxylate binds at a short (1.9 Ǻ) distance to Cu(II) with the C atom of the carboxylate (equivalent to the cysteine Sγ) positioned between 2.6 and 3.0 Ǻ from the copper center. This proposal is consistent with the “coupled distortion” model which predicts stronger axial ligand interaction with Cu(II) resulting in tetragonal distortion and corresponding movement and rotation of the Cys and His ligands.26 The enlongation of the Cu-S bond from 2.17 Å in WT and Met121Cys azurin to 2.22 Å in Met121Hcy azurin is also in line with what was predicted by the “coupled distortion” model, and is similar to what has been observed in the red copper protein nitrosocyanin (Cu-S(Cys) bond (2.26 Å)).29–32 An alternative possibility is that the Hcy ligand binds in a similar conformation to the native methionine, but that the absence of the terminal methyl group allows a water molecule to coordinate to the copper center. This would represent a somewhat similar situation to that found in nitrosocyanin, where a water ligand binds in the equatorial plane at 2.25 Ǻ. We were unable to detect the presence of coordinated water using EXAFS analysis, yet this does not preclude its presence since EXAFS also failed to detect the water ligand in nitrosocyanin.30 An additional equatorial ligand, would amplify coupled distortion as already described for nitrosocyanin.
Therefore, the EXAFS spectra, in conjunction with the UV-vis and EPR data, support the model that replacing Met121 with Hcy resulted in a “coupled-distorted” cupredoxin site that is very similar to red copper protein nitrosocyanin. On the other hand, the copper site in Met121Cys azurin mutant remains largely type 1 copper, with a similarly short Cu-S(Cys) bond (2.17 Å) in the equatorial position.
Electrochemical Studies
To probe the effects of stronger ligands on the redox behavior of azurin, we also measured the redox potentials of Met121Cys and Met121Hcy azurins. In comparison with WT azurin, replacing Met121 with Cys resulted in lowering of the reduction potential from 222 mV to 95 ± 3 mV at pH 7. Since four type 1 copper species are detected by EPR spectroscopy (see above), this potential may represent either the reduction potential of the most dominant electrochemically active species, or an average potential of four similarly overlapping potentials of the four species. Replacing Met121 with Hcy resulted in lowering the potential to a similar extent (113 ± 6 mV) at pH 7.0. Interestingly, the potentials of both Met121Cys and Met121Hcy are very similar to that of nitrosocyanin (85 mV) at the same pH.29 In contrast, the Met121His (E1/2 = 200 mV) and Met121Glu (E1/2 = 220 mV) azurins have reduction potentials that are ~100 mV higher than that of nitrosocyanin, and similar to that of WT azurin at the same pH. According to “coupled distortion” model, the stronger ligand should result in a more tetragonal geometry thus lowering the reduction potential.26 While replacing Met121 with Cys did indeed decrease the potential, the stronger Hcy ligand was expected to lower the potential even further. However, the observed potential of Met121Hcy is higher than that of Met121Cys. Previous studies have shown that that a number of factors, including hydrophobicity and geometry, play important roles in tuning the reduction potential of blue copper proteins.52,55,70,71 Since Hcy is more hydrophobic than Cys due to the presence of the extra methylene group, the hydrophobicity may be a contributing factor to the increase in the reduction potential of Met121Hcy azurin. However, other factors may also contribute and this difference may be due to the interchange between the axial and equatorial ligands in Met121Hcy azurin.69,72
Conclusions
In conclusion, we have shown successful incorporation of thiolate functional groups as strong axial ligands into Az. Replacing Met121 with Cys using site-directed mutagenesis resulted in a protein with pH dependence owing to different Cys protonation state. At low pH, protonated Cys gives minimal distortion of the type 1 copper center, due to longer and thus weaker interaction between the protonated Cys and Cu. Interestingly, adding an extra methylene group by introducing the unnatural amino acid Hcy in azurin at the same position using EPL resulted in much stronger interaction and converted the blue to a red copper. The results firmly establish the “coupled distortion” model and demonstrate the power of using nonproteinogenic amino acids to address critical chemical biological questions.
Supplementary Material
Acknowledgments
We would like to thank Furong Sun for assistance with Mass Spectral data collection, and Elena Bobyr and Dr. Britt Hedman, Stanford Synchrotron Radiation Lightsource for partial measurement of XAS data. This material is based upon work supported by the U.S. National Science Foundation and Special Creativity Extension (CHE-05-52008 to Y.L.), and by the National Institutes of Health (GM058822 to W.A.V. and GM54803 to N.J.B.). We thank Dr. Gnana S Siluvai and Dr. Adenike Otoikhian for help with the data collection. We gratefully acknowledge the use of facilities at the Stanford Synchrotron Radiation Lightsource which is funded by the US Department of Energy, Office of Basic Energy Sciences, and of the SSRL Structural Molecular Biology program, supported by the National Institutes of Health, National Center for Research Resources, Biomedical Technology Program (RR001209), and by the US DOE Office of Biological and Environmental Research.
Footnotes
Supporting Information Available:
Mass spectra of Met121Cys and Met121Hcy, simulated EPR parameters of four species of Met121Cys Azurin and their percentage at different pHs, simulated EPR parameter for Met121Hcy Azurin. This information is available free of charge via the Internet at http://pubs.acs.org/.
References
- 1.Malmström BG. Eur J Biochem. 1994;223:711–718. doi: 10.1111/j.1432-1033.1994.tb19044.x. [DOI] [PubMed] [Google Scholar]
- 2.Pierloot K, De Kerpel JOA, Ryde U, Roos BO. J Am Chem Soc. 1997;119:218–226. [Google Scholar]
- 3.Solomon EI, Baldwin MJ, Lowery MD. Chem Rev. 1992;92:521–542. [Google Scholar]
- 4.den Blaauwen T, Hoitink CWG, Canters GW, Han J, Loehr TM, Sanders-Loehr J. Biochemistry. 1993;32:12455–12464. doi: 10.1021/bi00097a025. [DOI] [PubMed] [Google Scholar]
- 5.Han J, Loehr TM, Lu Y, Valentine JS, Averill BA, Sanders-Loehr J. J Am Chem Soc. 1993;115:4256–4263. [Google Scholar]
- 6.Andrew CR, Yeom H, Valentine JS, Karlsson BG, van Pouderoyen G, Canters GW, Loehr TM, Sanders-Loehr J, Bonander N. J Am Chem Soc. 1994;116:11489–98. [Google Scholar]
- 7.DeBeer George S, Basumallick L, Szilagyi RK, Randall DW, Hill MG, Nersissian AM, Valentine JS, Hedman B, Hodgson KO, Solomon EI. J Am Chem Soc. 2003;125:11314–11328. doi: 10.1021/ja035802j. [DOI] [PubMed] [Google Scholar]
- 8.den Blaauwen T, Canters GW. J Am Chem Soc. 1993;115:1121–1129. [Google Scholar]
- 9.Gray HB, Malmström BG, Williams RJP. J Biol Inorg Chem. 2000;5:551–559. doi: 10.1007/s007750000146. [DOI] [PubMed] [Google Scholar]
- 10.Guckert JA, Lowery MD, Solomon EI. J Am Chem Soc. 1995;117:2817–2844. [Google Scholar]
- 11.Kofman V, Farver O, Pecht I, Goldfarb D. J Am Chem Soc. 1996;118:1201–1206. [Google Scholar]
- 12.Murphy LM, Strange RW, Karlsson BG, Lundberg LG, Pascher T, Reinhammar B, Hasnain SS. Biochemistry. 1993;32:1965–1975. doi: 10.1021/bi00059a013. [DOI] [PubMed] [Google Scholar]
- 13.Olsson MHM, Ryde U. J Biol Inorg Chem. 1999;4:654–663. doi: 10.1007/s007750050389. [DOI] [PubMed] [Google Scholar]
- 14.Solomon EI, Hedman B, Hodgson KO, Dey A, Szilagyi RK. Coord Chem Rev. 2005;249:97–129. [Google Scholar]
- 15.Solomon EI, Penfield KW, Gewirth AA, Lowery MD, Shadle SE, Guckert JA, LaCroix LB. Inorg Chim Acta. 1996;243:67–78. [Google Scholar]
- 16.van Pouderoyen G, Andrew CR, Loehr TM, Sanders-Loehr J, Mazumdar S, Hill HAO, Canters GW. Biochemistry. 1996;35:1397–1407. doi: 10.1021/bi951604w. [DOI] [PubMed] [Google Scholar]
- 17.Hough MA, Strange RW, Hasnain SS. J Mol Biol. 2000;304:231–241. doi: 10.1006/jmbi.2000.4186. [DOI] [PubMed] [Google Scholar]
- 18.Karlsson BG, Tsai LC, Nar H, Sanders-Loehr J, Bonander N, Langer V, Sjolin L. Biochemistry. 1997;36:4089–4095. doi: 10.1021/bi962416o. [DOI] [PubMed] [Google Scholar]
- 19.Nar H, Messerschmidt A, Huber R, van de Kamp M, Canters GW. J Mol Biol. 1991;221:765–772. doi: 10.1016/0022-2836(91)80173-r. [DOI] [PubMed] [Google Scholar]
- 20.Romero A, Hoitink CWG, Nar H, Huber R, Messerschmidt A, Canters GW. J Mol BIol. 1993;229:1007–1021. doi: 10.1006/jmbi.1993.1101. [DOI] [PubMed] [Google Scholar]
- 21.Yamakura F, Sugio S, Hiraoka BY, Ohmori D, Yokota T. Biochemistry. 2003;42:10790–10799. doi: 10.1021/bi0349625. [DOI] [PubMed] [Google Scholar]
- 22.Abriata LA, Ledesma GN, Pierattelli R, Vila AJ. J Am Chem Soc. 2009;131:1939–1946. doi: 10.1021/ja8079669. [DOI] [PMC free article] [PubMed] [Google Scholar]
- 23.Bertini I, Fernandez CO, Karlsson BG, Leckner J, Luchinat C, Malmstrom BG, Nersissian AM, Pierattelli R, Shipp E, Valentine JS, Vila AJ. J Am Chem Soc. 2000;122:3701–3707. [Google Scholar]
- 24.Donaire A, Jimenez B, Fernandez CO, Pierattelli R, Niizeki T, Moratal JM, Hall JF, Kohzuma T, Hasnain SS, Vila AJ. j Am Chem Soc. 2002;124:13698–13708. doi: 10.1021/ja0267019. [DOI] [PubMed] [Google Scholar]
- 25.LaCroix LB, Shadle SE, Wang Y, Averill BA, Hedman B, Hodgson KO, Solomon EI. J Am Chem Soc. 1996;118:7755–7768. [Google Scholar]
- 26.Solomon EI. Inorg Chem. 2006;45:8012–8025. doi: 10.1021/ic060450d. [DOI] [PubMed] [Google Scholar]
- 27.Lu Y. In: Comprehensive Coordination Chemistry II: From Biology to Nanotechnology. McCleverty JA, Meyer JJ, editors. Vol. 8. Elsevier; Oxford, UK: 2004. pp. 91–122. [Google Scholar]
- 28.Lu Y, LaCroix LB, Lowery MD, Solomon EI, Bender CJ, Peisach J, Roe JA, Gralla EB, Valentine JS. J Am Chem Soc. 1993;115:5907–5918. [Google Scholar]
- 29.Arciero DM, Pierce BS, Hendrich MP, Hooper AB. Biochemistry. 2002;41:1703–1709. doi: 10.1021/bi015908w. [DOI] [PubMed] [Google Scholar]
- 30.Basumallick L, Sarangi R, DeBeer George S, Elmore B, Hooper AB, Hedman B, Hodgson KO, Solomon EI. J Am Chem Soc. 2005;127:3531–3544. doi: 10.1021/ja044412+. [DOI] [PubMed] [Google Scholar]
- 31.Lieberman RL, Arciero DM, Hooper AB, Rosenzweig AC. Biochemistry. 2001;40:5674–5681. doi: 10.1021/bi0102611. [DOI] [PubMed] [Google Scholar]
- 32.Whittaker M, Bergmann D, Arciero D, Hooper AB. Biochim Biophys Acta. 2000;1459:346–355. doi: 10.1016/s0005-2728(00)00171-7. [DOI] [PubMed] [Google Scholar]
- 33.Kroes SJ, Hoitink CWG, Andrew CR, Sanders-Loehr J, Messerschmid A, Hagen WR, Canters GW. Eur J Biochem. 1996;240:342–351. doi: 10.1111/j.1432-1033.1996.0342h.x. [DOI] [PubMed] [Google Scholar]
- 34.Messerschmidt A, Prade L, Kroes SJ, Sanders-Loehr J, Huber R, Canters GW. Proc Natl Acad Sci USA. 1998;95:3443–3448. doi: 10.1073/pnas.95.7.3443. [DOI] [PMC free article] [PubMed] [Google Scholar]
- 35.van Gestel M, Boulanger MJ, Canters GW, Huber M, Murphy MEP, Verbeet MP, Groenen EJJ. J Phys Chem. 2001;105:2236–2243. [Google Scholar]
- 36.van Gestel M, Canters GW, Krupka H, Messerschmid A, de Waal EC, Warmerdam GCM, Groenen EJJ. J Am Chem Soc. 2000;122:2322–2328. [Google Scholar]
- 37.Pascher T, Karlsson BG, Nordling M, Malmström BG, Vänngård T. Eur J BIochem. 1993;212:289–96. doi: 10.1111/j.1432-1033.1993.tb17661.x. [DOI] [PubMed] [Google Scholar]
- 38.Strange RW, Murphy LM, Karlsson BG, Reinhammar B, Hasnain SS. Biochemistry. 1996;35:16391–16398. doi: 10.1021/bi961682z. [DOI] [PubMed] [Google Scholar]
- 39.Webb MA, Kiser CN, Richards JH, Di Bilio AJ, Gray HB, Winkler JR, Loppnow GR. J Phys Chem. 2000;104:10915–10920. [Google Scholar]
- 40.Basumallick L, Szilagyi RK, Zhao Y, Shapleigh JP, Scholes CP, Solomon EI. J Am Chem Soc. 2003;125:14784–14792. doi: 10.1021/ja037232t. [DOI] [PubMed] [Google Scholar]
- 41.Hay M, Richards JH, Lu Y. Proc Natl Acad Sci USA. 1996;93:461–464. doi: 10.1073/pnas.93.1.461. [DOI] [PMC free article] [PubMed] [Google Scholar]
- 42.Hay MT, Ang MC, Gamelin DR, Solomon EI, Antholine WE, Ralle M, Blackburn NJ, Massey PD, Wang X, Kwon AH, Lu Y. Inorg Chem. 1998;37:191–198. [Google Scholar]
- 43.Nilges MJ, Matteson K, Bedford RL. ESR Spectroscopy in Membrane Biophysics. Vol. 27. Marcus A Hemminga, Berliner, L., Springer; SIMPOW6: A software package for the simulation of ESR powder-type spectra. [Google Scholar]
- 44.George GN. Stanford Synchrotron Radiation Laboratory. Menlo Park, CA: 1990. [Google Scholar]
- 45.Binsted N, Gurman SJ, Campbell JW. 9.2. Daresbury Laboratory; Warrington, England: 1998. [Google Scholar]
- 46.Gurman SJ, Binsted N, Ross I. J Phys C. 1984;17:143–151. [Google Scholar]
- 47.Gurman SJ, Binsted N, Ross I. J Phys C. 1986;19:1845–1861. [Google Scholar]
- 48.Binsted N, Hasnain SS. J Synchrotron Rad. 1996;3:185–196. doi: 10.1107/S0909049596005651. [DOI] [PubMed] [Google Scholar]
- 49.Blackburn NJ, Rhames FC, Ralle M, Jaron S. J Biol Inorg Chem. 2000;5:341–353. doi: 10.1007/pl00010663. [DOI] [PubMed] [Google Scholar]
- 50.Jeuken LJC, Armstrong FA. J Phys Chem B. 2001;105:5271–5282. [Google Scholar]
- 51.Berry SM, Gieselman MD, Nilges MJ, van der Donk WA, Lu Y. J Am Chem Soc. 2002;124:2084–2085. doi: 10.1021/ja0169163. [DOI] [PubMed] [Google Scholar]
- 52.Berry SM, Ralle M, Low DW, Blackburn NJ, Lu Y. J Am Chem Soc. 2003;125:8760–8768. doi: 10.1021/ja029699u. [DOI] [PubMed] [Google Scholar]
- 53.Chang TK, Iverson SA, Rodrigues CG, Kiser CN, Lew AYC, Germanas JP, Richards JH. Proc Natl Acad Sci USA. 1991;88:1325–1329. doi: 10.1073/pnas.88.4.1325. [DOI] [PMC free article] [PubMed] [Google Scholar]
- 54.den Blaauwen T, van de Kamp M, Canters GW. J Am Chem Soc. 1991;113:5050–5052. [Google Scholar]
- 55.Garner DK, Vaughan MD, Hwang HJ, Savelieff MG, Berry SM, Honek JF, Lu Y. J Am Chem Soc. 2006;128:15608–15617. doi: 10.1021/ja062732i. [DOI] [PubMed] [Google Scholar]
- 56.Karlsson BG, Nordling M, Pascher T, Tsai LC, Sjolin L, Lundberg LG. Protein Eng. 1991;4:343–349. doi: 10.1093/protein/4.3.343. [DOI] [PubMed] [Google Scholar]
- 57.Kolczak U, Dennison C, Messerschmid A, Canters GW. In: Handbook of Metalloproteins. Messerschmid A, Huber R, Poulos T, Wieghardt K, editors. Vol. 2. Wiley; Chichester: 2001. pp. 1170–1194. [Google Scholar]
- 58.Lu Y, Roe JA, Bender CJ, Peisach J, Banci L, Bertini I, Gralla EB, Valentine JS. Inorg Chem. 1996;35:1692–700. doi: 10.1021/ic9513189. [DOI] [PubMed] [Google Scholar]
- 59.Mizoguchi TJ, Di Bilio AJ, Gray HB, Richards JH. J Am Chem Soc. 1992;114:10076–10078. [Google Scholar]
- 60.Ralle M, Berry SM, Nilges MJ, Gieselman MD, van der Donk WA, Lu Y, Blackburn NJ. J Am Chem Soc. 2004;126:7244–7256. doi: 10.1021/ja031821h. [DOI] [PubMed] [Google Scholar]
- 61.Van Amsterdam IMC, Ubbink M, Van den Bosch M, Rotsaert F, Sanders-Loehr J, Canters GW. J Biol Chem. 2002;277:44121–44130. doi: 10.1074/jbc.M202977200. [DOI] [PubMed] [Google Scholar]
- 62.Randall DW, Gamelin DR, LaCroix LB, Solomon EI. J Biol Inorg Chem. 2000;5:16–29. doi: 10.1007/s007750050003. [DOI] [PubMed] [Google Scholar]
- 63.Solomon EI, Randall DW, Glaser T. Coord Chem Rev. 2000;200–202:595–632. [Google Scholar]
- 64.Gewirth AA, Cohen SL, Schugar HJ, Solomon EI. Inorg Chem. 1987;26:1133–1146. [Google Scholar]
- 65.David R, Richter MPO, Beck-Sickinger AG. Eur J Biochem. 2004;271:663–677. doi: 10.1111/j.1432-1033.2004.03978.x. [DOI] [PubMed] [Google Scholar]
- 66.Muir TW, Sondhi D, Cole PA. Proc Natl Acad Sci USA. 1998;95:6705–6710. doi: 10.1073/pnas.95.12.6705. [DOI] [PMC free article] [PubMed] [Google Scholar]
- 67.Cheung KC, Strange RW, Hasnain SS. Acta Crystallogr D Biol Crystallogr. 2000;56:697–704. doi: 10.1107/s0907444900003310. [DOI] [PubMed] [Google Scholar]
- 68.Andruzzi L, Nakano M, Nilges MJ, Blackburn NJ. J Am Chem Soc. 2005;127:16548–16558. doi: 10.1021/ja0529539. [DOI] [PubMed] [Google Scholar]
- 69.Lancaster KM, George SD, Yokoyama K, Richards JH, Gray HB. Nat Chem. 2009;1:711–715. doi: 10.1038/nchem.412. [DOI] [PMC free article] [PubMed] [Google Scholar]
- 70.Karlsson BG, Aasa R, Malmström BG, Lundberg LG. FEBS Lett. 1989;253:99–102. [Google Scholar]
- 71.Ryde U, Olsson MH. J Biol Inorg Chem. 1999;4:654–663. doi: 10.1007/s007750050389. [DOI] [PubMed] [Google Scholar]
- 72.Lancaster KM, Yokoyama K, Richards JH, Winkler JR, Gray HB. Inorg Chem. 2008;48:1278–1280. doi: 10.1021/ic802322e. [DOI] [PMC free article] [PubMed] [Google Scholar]
Associated Data
This section collects any data citations, data availability statements, or supplementary materials included in this article.