

Abstract
Head movement during a PET scan (especially, dynamic scan) can affect both the qualitative and quantitative aspects of an image, making it difficult to accurately interpret the results. The primary objective of this study was to develop a retrospective image-based movement correction (MC) method and evaluate its implementation on dynamic [18F]-FDDNP PET images of cognitively intact controls and patients with Alzheimer’s disease (AD).
Methods
Dynamic [18F]-FDDNP PET images, used for in vivo imaging of beta-amyloid plaques and neurofibrillary tangles, were obtained from 12 AD and 9 age-matched controls. For each study, a transmission scan was first acquired for attenuation correction. An accurate retrospective MC method that corrected for transmission-emission misalignment as well as emission-emission misalignment was applied to all studies. No restriction was assumed for zero movement between the transmission scan and first emission scan. Logan analysis with cerebellum as the reference region was used to estimate various regional distribution volume ratio (DVR) values in the brain before and after MC. Discriminant analysis was used to build a predictive model for group membership, using data with and without MC.
Results
MC improved the image quality and quantitative values in [18F]-FDDNP PET images. In this subject population, medial temporal (MTL) did not show a significant difference between controls and AD before MC. However, after MC, significant differences in DVR values were seen in frontal, parietal, posterior cingulate (PCG), MTL, lateral temporal (LTL), and global between the two groups (P < 0.05). In controls and AD, the variability of regional DVR values (as measured by the coefficient of variation) decreased on average by >18% after MC. Mean DVR separation between controls and ADs was higher in frontal, MTL, LTL and global after MC. Group classification by discriminant analysis based on [18F]-FDDNP DVR values was markedly improved after MC.
Conclusion
The streamlined and easy to use MC method presented in this work significantly improves the image quality and the measured tracer kinetics of [18F]-FDDNP PET images. The proposed MC method has the potential to be applied to PET studies on patients having other disorders (e.g., Down syndrome and Parkinson’s disease) and to brain PET scans with other molecular imaging probes.
Keywords: Head movement correction, [18F]-FDDNP, Alzheimer’s disease, discriminant analysis, distribution volume ratio
INTRODUCTION
Head movement in positron emission tomography (PET) is an issue that clinicians and research scientists have to address if they want to accurately quantify the pharmacokinetic analysis of metabolic information contained in a PET image. This is particularly true in the elderly with increased significance in patients with dementia or movement disorders. The development of methods to correct for head movement in PET data is also especially important as the spatial resolution of new PET cameras is improving and movement artifacts become a limiting factor (1).
Typical dynamic PET scans with molecular imaging probes usually last for at least an hour, a lengthy procedure for elderly patients, but one that is necessary for accurate brain pharmacokinetics. Head movement during the scan can not only introduce a loss in spatial resolution in the image, but may also lead to loss of information and even useless data (2). Part of the problem is movement induced misalignment between transmission and emission scans as the subject moves from his or her initial position at the start of the study, which is when the transmission scan is acquired. This will produce an incorrect attenuation correction factor (ACF) matrix to be applied to each uncorrected emission frame of the dynamic image. The integrity of the reconstructed PET data will hence be compromised (3).
Moreover, when acquiring dynamic images, movement within an emission frame and movement between emission frames can cause additional complications. Classical compartmental model analysis along with its linearized or graphical counterparts (4) may give erroneous values for physiological parameters (e.g., distribution volume ratio [DVR] or metabolic flux) derived from such methods, as movement between frames can alter the validity of image-derived blood and tissue time-activity curves (TACs). The motivation to undertake such a continuing problem in PET is thus greatly merited.
One way to reduce head movement during a PET scan is to use a head restraint by way of a stereotactic device or thermoplastic mask. However, these methods are not able to completely eliminate head movement (5) and could produce significant discomfort or claustrophobia in elderly patients which would compromise the studies. A better solution is therefore needed.
The primary purpose of this work was to develop a retrospective image-based head movement correction (MC) method and then evaluate its validity on 2-(1-{6-[(2-[18F]fluoroethyl)(methyl)amino]-2-naphthyl}ethylidene)malononitrile ([18F]-FDDNP) PET images of cognitively intact controls and patients with Alzheimer’s disease (AD). [18F]-FDDNP is a hydrophobic molecular probe used for in vivo imaging of beta-amyloid plaques and neurofibrillary tangles (6, 7), the neuropathological hallmarks of AD. The MC method would not only have to correct for transmission-emission misalignment, but also correct for emission-emission misalignment if present in these PET studies. In addition, the MC method has to be easy to use in order to make it practical for common use. The effects of head movement on tissue TACs and parametric DVR images would also have to be addressed.
MATERIALS AND METHODS
Clinical Assessments
The retrospective MC method was evaluated and validated on 12 AD and 9 normal controls. Table 1 summarizes the clinical characteristics in this subject population. All subjects underwent comprehensive neurologic and psychiatric evaluation as previously reported (6). The Mini-Mental State Examination (MMSE) (8) was used as one of the clinical tools for detecting cognitive impairment and assessing its severity. Subjects with AD met the standard diagnostic criteria for AD (9). Control subjects had normal cognitive functioning for their age and did not meet the diagnostic criteria for AD. In accordance with the procedures of the Human Subjects Protection Committee at UCLA, written informed consent was obtained from all subjects or their legal representatives.
TABLE 1.
Clinical characteristics of patients in control and AD groups.
| Control | AD | |
|---|---|---|
| No. | 9 | 12 |
| Gender (Male/Female) | 6/3 | 6/6 |
| Age (yr) | 69 ± 8 [62–85] | 74 ± 8 [61–85] |
| MMSE* | 29.4 ± 0.7 [28–30] | 17.8 ± 6.8 [4–25] |
| Injected Dose (MBq) | 383.3 ± 24.2 [351.5–418.1] | 382.6 ± 29.9 [318.2–421.8] |
Values are mean ± standard deviation [range].
Scores range from 0 to 30, with higher scores indicating better cognitive functioning.
[18F]-FDDNP PET Imaging Protocol
Dynamic [18F]-FDDNP PET scans were acquired with an ECAT EXACT HR+ scanner (Siemens/CTI). A curved head holder made of carbon fiber was attached to the patient bed. The intrinsic spatial resolution of the scanner was 4.5 mm at FWHM in the center field of view. Using a set of external rotating 68Ge rod sources, a transmission scan was first acquired for 20 minutes in 2-D mode to correct for photon attenuation occurring along each line of response in the emission scan. [18F]-FDDNP (382.95 ± 27.07 MBq), as synthesized by methods previously reported (10), was injected intravenously as a bolus and a dynamic emission scan (6×30 sec, 4×3 min, 5×10 min, 3×20 min) was initiated. Dynamic images were reconstructed using filtered backprojection with a Hann filter at a cutoff frequency of 0.3×Nyquist and a zoom factor of 3.5. The final reconstructed volume had a spatial resolution of 9 mm at FWHM and a matrix size of 128×128 that consisted of 63 planes, resulting in a voxel size of 1.47×1.47×2.43 mm. The same reconstruction parameters were used in the MC method.
Movement Correction Procedure
The head MC method consists of two major parts (Figure 1). The first part properly corrects for the attenuation in each of the emission frames of the dynamic image. The second part then aligns each of the properly attenuation corrected (AC) emission frames to a common reference frame. The MC method involves stepping back and forth between projection space and image space, since the rigid body alignment routine in the freely available SPM2 software (11) must be done in image space. Reslicing of image volumes was also done in SPM2 using trilinear interpolation. Siemens’ Clinical Applications Programming Package (CAPP) was used to perform image reconstructions. The full procedure, which has been streamlined and made easy to use, consists of the following steps:
FIGURE 1.

General illustrated overview of the retrospective MC method proposed in this study.
The first part of the MC method starts out by segmenting out the head holder from the transmission image since the head holder stayed stationary when the patient’s head moved. This is done by manually drawing a contour around the head holder in ImageJ (12) and then masking it out. This is the only user-dependent task within the MC method, although a very easy one.
The original transmission image without the head holder (TXORIGINAL) is then co-registered (as a rigid body) to a pre-selected non-attenuation corrected (non-AC) emission frame, which serves as our reference frame (e.g., frame 11 was used in this study). This will produce a resliced transmission image (TXREF) that is aligned to the reference non-AC emission frame. TXORIGINAL does not undergo any further co-registrations with emission frames other than to the reference frame. The reference non-AC emission frame has to have a relatively high signal-to-noise ratio in order for the normalized mutual information (13) matching criterion in SPM2 to work well. No additional preprocessing (besides removing the head holder) such as filtering or thresholding of the transmission image or the reference non-AC emission frame needs to be done for the registration to work well.
The reference non-AC emission frame is then individually co-registered to the other non-AC emission frames to derive (n-1) transformation matrices, where n is the total number of frames in the dynamic image. Non-AC emission images were used since they are not corrupted by any transmission-emission misalignment. It is also at this step that 3 translational and 3 rotational parameters are extracted from each of the (n-1) transformation matrices.
TXREF is then separately resliced (n-1) times based on the transformation matrices derived in Step 3. It is only after this step, that there is an aligned transmission image that matches each of the non-AC emission frames.
The attenuation due to the head holder, which was taken out in Step 1, is then added back to each frame of the dynamic transmission image obtained in Step 4.
The measured ACF matrix for each emission frame is generated based on the aligned transmission images and is applied to the measured non-AC emission sinogram. The properly AC emission image for each frame is then reconstructed.
The second part of the MC method is now initiated, whereby each of the properly AC emission frames are individually co-registered to the reference frame.
Logan plot and ROI analysis
In order to quantify [18F]-FDDNP binding, Logan graphical analysis (4) was applied to generate DVR parametric images, using the TAC derived from the cerebellar cortex as the reference input for time points between 15 and 125 minutes. The slope of the linear portion of the Logan plot is the DVR, which is equal to the distribution volume of the tracer in a region of interest divided by the distribution volume of the tracer in the reference region (4).
Regions of interest (ROIs) were separately drawn before and after MC on the early summed [18F]-FDDNP image (frames 1–7) which resembled tracer perfusion (14), and then applied to the DVR image to calculate various regional DVR values in the brain. The volume of the ROIs ranged from 0.2–2.0 cm3. Image visualization and ROI analyses were performed using CAPP software. Regions included in the analysis were (left and right) frontal, parietal, posterior cingulate, medial temporal, lateral temporal, subcortical white matter and cerebellum. Furthermore, each regional DVR value was expressed as a volume-weighted average of the left and right regions, and global DVR values were then calculated as straight averages for all these regional values (6), excluding cerebellum and subcortical white matter. Effects of head movement on tracer TACs were also assessed.
Statistical Analysis
All statistical analyses were performed using SPSS 17.0 for Windows (SPSS Inc., Chicago, IL). The results are reported as the mean ± standard deviation (unless otherwise noted) and are regarded as statistically significant if P < 0.05.
Group Comparisons
Group differences in regional DVR values between controls and AD were tested with the Mann-Whitney test (two-tailed). A non-parametric test was chosen due to our small group size and because this type of test makes fewer assumptions about the sample data characteristics (i.e., samples do not have to be drawn from normally distributed populations with equal variance).
Discriminant Analysis
Discriminant analysis was used to build a predictive model for group membership (15). Given a set of independent variables, discriminant analysis attempts to find linear combinations of those variables that best separate the groups of subjects. These combinations are called discriminant functions and have the form displayed in the equation below:
| Eq. 1 |
where D is the discriminant score formed by the discriminant function, bn are the discriminant coefficients, xn are the predictor variables, and C is a constant.
Moreover, the discriminant function is generated from a sample of cases for which group membership is known and can then be applied to new cases that have measurements for the predictor variables, but have unknown group membership (15). In order to assess the predictive performance of the discriminant function, a classification table was generated, which summarized the percent and number of subjects classified correctly and incorrectly. While the classifications based upon the cases used to create the model may be looked upon as “too optimistic,” in the sense that their classification rate is inflated, a cross-validated section of the table attempts to correct this by classifying each subject while leaving it out from the model calculations (15). Cross-validation thus gives an approximately unbiased estimate of the true error rate, although a relatively noisy one (16).
RESULTS
Group Characteristics
The groups were shown to be statistically matched for age (P > 0.05). The mean MMSE scores for the control and AD groups were 29.4 ± 0.7 and 17.8 ± 6.8, respectively (P < 0.05).
Image Processing and Analysis
Figure 2 illustrates how head movement during a dynamic brain PET can cause misalignment between the transmission and emission scans. The first part of the MC procedure described in this paper corrects for this problem. Qualitative differences in [18F]-FDDNP DVR images before and after MC are shown in Figure 3. The DVR image of an AD subject with considerable head movement (ADSubject2; subject 2 in Table 2) before MC was subject to image artifacts (i.e., increased scalp uptake and asymmetrical [18F]-FDDNP binding near the top of the head as seen in the coronal view) due to transmission-emission misalignment. Scalp uptake of [18F]-FDDNP, in general, is patient specific, but it should not be abnormally high and asymmetrical as seen in the DVR image before MC. However, after the MC procedure was applied, the image quality of the DVR image was improved and [18F]-FDDNP signal was more clearly defined in frontal, striatum, thalamus, and temporal regions. For a control subject with minor head movement (ControlSubject1; subject 1 in Table 2), the MC procedure did not introduce any artifacts or image degradation to the DVR image. As a result, the image integrity of the original DVR image was maintained.
FIGURE 2.

Head movement can cause transmission-emission (TX-EM) misalignment during a dynamic brain PET. (A) An early non-AC EM frame is shown to be fused well with the TX image taken at the start of the study. Both images are shown at the same transaxial plane. (B) A late non-AC EM frame is now fused with the original TX image at the same transaxial plane from before. Since the subject’s head moves away from the PET gantry after the acquisition of the early non-AC EM frame, the mismatched TX-EM would cause an incorrect ACF matrix to be applied to the late non-AC EM frame. (C) After applying the first part of the MC method, the original TX image is matched to the late EM image. This produces an accurate ACF matrix that can be used to properly reconstruct the late EM frame.
FIGURE 3.
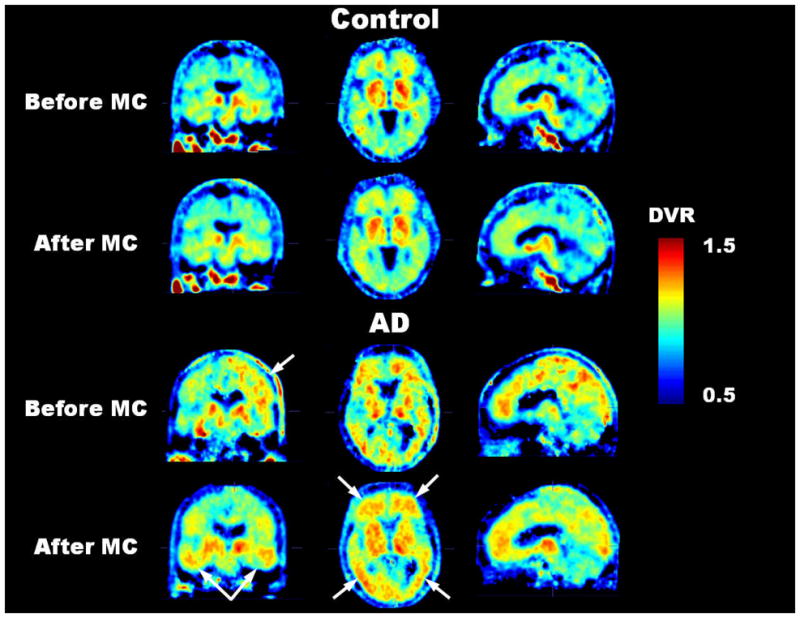
For the control subject with negligible head movement, the MC method did not introduce any apparent image degradation to the [18F]-FDDNP DVR image. Before MC, the DVR image of the AD subject with considerable head movement was subject to image artifacts (i.e., abnormally high scalp uptake and asymmetrical [18F]-FDDNP binding near the top of the head as seen in the coronal view) due to transmission-emission misalignment. However, after MC, the image quality of the DVR image was improved. All images correspond approximately to the same cross-sectional locations in their respective coronal, transaxial and sagittal views.
TABLE 2.
Displacement during dynamic [18F]-FDDNP studies in control and AD patients.
| Control | Displacement (mm) |
|
|---|---|---|
| Max. of Mean* | Max. of Maximum† | |
| 1 | 2.10 (frame 18)‡ | 3.53 (frame 18)‡ |
| 2 | 2.32 (frame 18) | 3.73 (frame 4) |
| 3 | 12.42 (frame 17) | 18.10 (frame 17) |
| 4 | 4.13 (frame 18) | 8.90 (frame 17) |
| 5 | 2.27 (frame 17) | 5.01 (frame 5) |
| 6 | 4.62 (frame 15) | 9.45 (frame 15) |
| 7 | 2.60 (frame 18) | 5.68 (frame 5) |
| 8 | 2.20 (frame 5) | 4.98 (frame 5) |
| 9 | 2.45 (frame 4) | 5.99 (frame 4) |
| AD | Displacement (mm) |
|
| Max. of Mean* | Max. of Maximum† | |
| 1 | 6.29 (frame 3)‡ | 10.80 (frame 3)‡ |
| 2 | 15.30 (frame 18) | 23.59 (frame 18) |
| 3 | 15.89 (frame 18) | 30.58 (frame 18) |
| 4 | 4.73 (frame 13) | 10.97 (frame 15) |
| 5 | 2.66 (frame 15) | 4.54 (frame 15) |
| 6 | 2.60 (frame 17) | 3.70 (frame 3) |
| 7 | 8.68 (frame 18) | 15.73 (frame 18) |
| 8 | 3.66 (frame 18) | 8.03 (frame 18) |
| 9 | 4.60 (frame 18) | 6.63 (frame 18) |
| 10 | 2.98 (frame 18) | 7.09 (frame 18) |
| 11 | 2.44 (frame 18) | 5.42 (frame 17) |
| 12 | 15.11 (frame 18) | 20.18 (frame 18) |
Maximum of the mean displacement (where the mean is taken over all the voxels in the head) between the reference frame and any non-AC emission frame.
Maximum of the maximum displacement (undergone by a single voxel in the head) between the reference frame and any non-AC emission frame.
Non-AC emission frame for which the maximum occurs is shown in parentheses.
Transformation parameters (3 translations, 3 rotations) for ControlSubject1 and ADSubject2 are shown in Supplemental Figure 1. A left-handed coordinate system (11) was used to describe the transformation parameters. The severity of the head movement for all subjects in this study was determined by not only examining the transformation parameters, but also visually looking at the fused images of TXORIGINAL to each of the non-AC emission frames. The primary translational direction affected by head movement for both controls and AD was the longitudinal z-axis (i.e., the patient’s superior-inferior axis).
Displacement maps in Figure 4 show the individual displacement of each voxel in the reference non-AC emission frame as it is co-registered to a late non-AC emission frame. The displacement is defined as:
| Eq. 2 |
where transx, transy, and transz are the absolute translations undergone by a voxel in each directional axis (i.e, a patient’s left-right, anterior-posterior, and superior-inferior axis, respectively) during the registration process. For ControlSubject1 (Figure 4A), the displacements were small (< 4 mm). As a result, regional TACs and Logan plots for this subject showed no noticeable changes before and after MC (Supplemental Figures 2A-D). For ADSubject2 (Figure 4B), the displacements were as large as 24 mm, with increasing regional displacements occurring in the following order: [cerebellum, parietal, and posterior-cingulate] (~12–13 mm) < [striatum, thalamus, medial and lateral temporal] (~14–15 mm) < [frontal] (~17–18 mm). As a result, regional TACs before MC were distorted for this subject, and regional DVR values from the Logan plots differed before and after MC (Supplemental Figures 2E-H). The displacement pattern for each subject in each group was dependent on their individual head movements during the scan and may not necessarily mirror what is shown in Figure 4.
FIGURE 4.

Displacement maps for a control subject with minor head movement (A) and an AD subject with significant head movement (B). Each map shows the displacement undergone by each voxel in the reference non-AC emission frame as it is co-registered to the last non-AC emission frame in the dynamic image. Note the difference in scale for both color bars.
The mean displacement (calculated from all the voxels in the head) of the reference non-AC emission frame as it is co-registered to each of the remaining frames in the dynamic image is plotted in Figure 5 for ControlSubject1 and ADSubject2. The maximum of the mean displacement between the reference frame and any non-AC emission frame is shown in Table 2 for all subjects. The maximum of the maximum displacement (undergone by a single voxel in the head) between the reference frame and any non-AC emission frame is also shown in Table 2 for all subjects.
FIGURE 5.

Mean displacement of the reference non-AC emission frame as it is co-registered to each of the remaining frames in the dynamic image for a control subject with negligible head movement and an AD subject with large head movement. The mean was calculated from the displacements of all the voxels in the head.
Group Comparisons
The results of the group comparisons in regional DVR values before and after MC are summarized in Table 3 and plotted in Supplemental Figure 3. In the subject population studied, significant differences between controls and AD were found in frontal, parietal, posterior cingulate, lateral temporal and global before MC (P < 0.05). Medial temporal and subcortical white matter did not show significant differences before MC. By contrast, all regions showed significant differences between controls and AD after MC (P < 0.05), except for subcortical white matter. Additionally, the P-values from the Mann-Whitney test for frontal, parietal, posterior cingulate, medial temporal, lateral temporal and global DVR values decreased after MC, with the medial temporal region having the most prominent decrease (a decrease of over 90% in P-value).
TABLE 3.
Logan DVR values and CVs for various regions in the control and AD groups before and after MC.
| Regions* | Before MC |
After MC |
||||||||
|---|---|---|---|---|---|---|---|---|---|---|
| Control |
AD |
P-value‡ | Control |
AD |
P-value‡ | |||||
| Mean DVR | % CV† | Mean DVR | % CV† | Mean DVR | % CV† | Mean DVR | % CV† | |||
| FRT | 1.032 | 4.55 | 1.148 | 5.11 | 0.0003 | 1.029 | 3.69 | 1.153 | 3.83 | 0.0001 |
| PAR | 1.078 | 3.90 | 1.173 | 3.13 | 0.0016 | 1.072 | 3.17 | 1.161 | 3.60 | 0.0006 |
| PCG | 1.112 | 5.03 | 1.212 | 3.65 | 0.0012 | 1.088 | 4.18 | 1.185 | 4.04 | 0.0007 |
| MTL | 1.151 | 5.80 | 1.218 | 5.63 | 0.0817 | 1.127 | 4.44 | 1.207 | 4.83 | 0.0077 |
| LTL | 1.100 | 5.60 | 1.177 | 4.42 | 0.0142 | 1.088 | 4.60 | 1.172 | 2.86 | 0.0012 |
| SWM | 1.004 | 3.73 | 0.989 | 11.13 | 0.6441 | 1.010 | 3.64 | 1.008 | 3.25 | 0.9151 |
| GLOBAL | 1.095 | 4.19 | 1.186 | 2.57 | 0.0010 | 1.082 | 3.07 | 1.176 | 2.97 | 0.0002 |
FRT = frontal; PAR = parietal; PCG = posterior cingulate; MTL = medial temporal; LTL = lateral temporal; SWM = subcortical white matter.
CV = coefficient of variation = ratio of the standard deviation to the mean.
P-values from two-tailed Mann-Whitney test.
In control subjects, the variability of DVR values (as measured by the coefficient of variation, CV) in frontal, parietal, posterior cingulate, medial temporal, lateral temporal, subcortical white matter and global decreased on average by 18% after MC. In subjects with AD, the variability of DVR values in frontal, medial temporal, lateral temporal and subcortical white matter decreased on average by 36% after MC. The decrease in the CV for subcortical white matter was especially apparent in the AD group with a decrease of more than 70% from its original value. The DVR separation between controls and AD (as measured by the separation in the means of the two groups) was higher in frontal, medial temporal, lateral temporal and global after MC when compared to before MC.
Discriminant Analysis
Supplemental Figure 4 shows the scatter plots of the discriminant scores (before and after MC) for the control and AD groups using frontal, parietal, posterior cingulate, medial temporal and lateral temporal collectively as predictor regions in the discriminant function. Note the complete separation between the two groups after MC. This leads to zero misclassifications by the discriminant function when cross-validation is not applied.
Table 4 summarizes the overall accuracy, sensitivity, and specificity in group classification performance (with and without cross-validation) for various combinations of predictor regions before and after MC. The overall accuracy in addition to the sensitivity and specificity improved after MC.
TABLE 4.
Overall accuracy (%), sensitivity (%), and specificity (%) in classification performance before and after MC using various combinations of predictor regions.
| Predictor Regions* | Before MC |
After MC |
||||
|---|---|---|---|---|---|---|
| Overall Accuracy | Sensitivity | Specificity | Overall Accuracy | Sensitivity | Specificity | |
| FRT+PAR+PCG+MTL+LTL | 95 (91)† | 92 (92) | 100 (89) | 100 (95) | 100 (92) | 100 (100) |
| FRT+MTL+PAR | 95 (86) | 100 (92) | 89 (78) | 100 (95) | 100 (92) | 100 (100) |
| FRT+MTL+PCG | 95 (91) | 100 (100) | 89 (78) | 100 (95) | 100 (92) | 100 (100) |
| FRT+PAR+PCG | 91 (91) | 92 (92) | 89 (89) | 100 (95) | 100 (92) | 100 (100) |
| FRT+MTL+LTL | 91 (91) | 92 (92) | 89 (89) | 100 (95) | 100 (92) | 100 (100) |
| MTL+LTL | 76 (71) | 83 (75) | 67 (67) | 86 (86) | 92 (92) | 78 (78) |
FRT = frontal; PAR = parietal; PCG = posterior cingulate; MTL = medial temporal; LTL = lateral temporal.
Cross-validated results are shown in parentheses.
DISCUSSION
A retrospective image-based head MC method that corrected for transmission-emission as well as emission-emission misalignments was proposed and investigated in this study. The MC method had to be easy to use and not add tremendous burden to any human brain PET study, so as to make it practical for common use. The shape of a human head changed very little with movement, so rigid body transformations were used to model the relative positions during a dynamic PET scan (11). Matching of two images was performed by finding the translations and rotations that optimize some matching function of the images (11). This type of MC method is of value to those who want to extract the fine details of tracer behavior in a PET image, but are restricted in doing so due to the degradation present in the image caused by patient movement during the scan time. With the proposed MC method presented in this article, valuable data once hidden in a brain PET image can come to light, making otherwise questionable studies useful.
Various strategies have been employed to address the problems of patient head movement in PET (1, 2, 17–22). An attractive method of late has been the acquisition of PET data in list-mode while simultaneously tracking the patient’s head movement with an optical motion-tracking system (1, 22). The optical motion-tracking system emits infrared light and detects the translational and rotational information of the head during image acquisition from the light that is reflected back from markers positioned on a patient’s head. Each detected event in the list-mode data is then corrected for by the movement information provided by the motion-tracking system and the image is reconstructed thereafter (1). A big advantage of this method is its tracer independence (i.e., there is no reliance on the PET data for determining the head movement). However, there are technical issues with this method that still need to be addressed (1). Also, optical-tracking systems are of no help in trying to retrospectively correct for head movement in PET images previously acquired. For these cases, image-based methods would offer a more practical solution.
One of the limitations of image-based methods (besides its susceptibility to the quality of the PET data) is that they do not account for motion within a frame. However, this problem can be minimized by shortening the frame duration in the PET protocol. It must be cautioned, though, that excessive shortening of the frame duration might also increase the noise due to lower counting statistics. Furthermore, in the MC method presented in this paper, there is no assumption or restriction set on having no movement between the transmission scan and the first emission scan, as is required by some other methods (18, 19, 21). This restriction was removed by the alignment of the transmission image to the non-AC emission frames using the mutual information maximization criterion. Although mutual information is a powerful algorithm for the registration of multi-modality images (and which worked well in our study), the optimization of other cost functions may be more appropriate for other tracers where there is too little “mutual information” between the transmission image and the reference emission frame or between the emission frames themselves.
Recently, Costes et al. (20) investigated a co-registration based frame realignment method for dynamic PET images using simulated [11C]-raclopride PET data. Upon optimizing the choice of target volume and similarity criterion, a correction strategy was designed that took into account transmission-emission misalignment as well as realigning the individual time frames. Their optimal method consisted of using non-AC emission images and the cross-correlation criterion. Moreover, Mourik et al. (21) evaluated four different “off-line” frame-by-frame motion correction methods. Their optimal method (based on simulated [11C]-flumazenil and (R)-[11C]-PK11195 studies) consisted of aligning non-AC emission frames to a summed image of the early non-AC frames (0–3 min). They then used a common attenuation map to reconstruct a series of aligned AC emission images. The study assumed there was no patient motion during the early emission frames, nor between the transmission scan and the start of the emission scan. Although both of these studies mirrored our study in certain respects, there were some important differences: (1) our method was derived from real patient data, not simulated data, (2) our method specifically accounts for the attenuation due to the head holder, (3) normalized mutual information was the matching criterion used in our study, (4) our method does not necessarily assume no mismatch between the transmission scan and the early frames of the emission scan, and (5) we worked with [18F] instead of [11C]-radiolabeled probes.
With regard to the results reported in this paper, we saw that in Supplemental Figure 1, the head movements of ControlSubject1 were relatively negligible while the head movements of ADSubject2 could not be ignored, especially along the longitudinal z-axis. The DVR images of ControlSubject1 before and after MC were very similar (Figure 3) and showed no apparent signs of image degradation that might have been introduced by the MC procedure. This should be the case if the MC procedure worked as it should since the subject had relatively little head movement to begin with. However, this does not mean that all control subjects will have negligible head movement. For example, there were control subjects in this study whose head movements were substantial and could not be ignored (e.g., control subject 3 in Table 2). The MC procedure should thus be applied to all subjects in a brain PET study, regardless of whether head movements were apparent during the scan.
Previous PET studies have shown significantly higher [18F]-FDDNP binding in the frontal, parietal, and temporal regions of the brain in patients with AD than in older control subjects without cognitive impairment (6). After MC, the image quality of the [18F]-FDDNP DVR images in subjects that moved was improved and [18F]-FDDNP binding in the aforementioned regions was more clearly defined. Quantitatively, this can be seen in the increased separation of the mean DVR values between controls and AD in frontal, medial temporal, lateral temporal, and global (Table 3 and Supplemental Figure 3). This increased separation explained in part why the discriminant analysis performed better after MC. Another reason for the improved performance was the considerable decrease (ranging from 42% to 91%) in P-values after MC for frontal, parietal, posterior cingulate, medial temporal, lateral temporal, and global. The two reasons above allowed for the calculation of a more refined discriminant function that was used to correctly classify individuals from the sampled population. The resulting discriminant function can thus be of significant help to diagnose new AD cases based on [18F]-FDDNP DVR images.
Additionally, before MC, we saw that medial temporal and subcortical white matter did not show significant differences between controls and AD. Since the medial temporal lobe is the brain region earliest affected in AD (23), these results can be interpreted based on the possibility that elderly control subjects may already have significant pathology present even in the absence of neuropsychiatric symptoms. However, and even though it is possible that control subjects may have elevated medial temporal lobe signal with [18F]-FDDNP PET, we saw that after MC, medial temporal did show a significant difference (P = 0.0077) between controls and AD while subcortical white matter remained to be non-significant between the two groups. Medial temporal region is thus sensitive to head movement. The fact that DVR values in subcortical white matter did not differ significantly between the two groups also offers the possibility of using subcortical white matter as a reference region for [18F]-FDDNP Logan analysis.
Moreover, the variability in regional DVR values decreased after MC. This decrease was most apparent in subcortical white matter in the AD group. MC should be considered if subcortical white matter is used as a reference region for Logan analysis, as its DVR is highly variable without MC in AD. The reduction in within-group CV would impact the design considerations of an experiment as well as the costs involved, since the sample size needed for detecting a given percentage change between means is a function of the CV (16). In addition, regional TACs were distorted in subjects with large head movement when compared to the kinetic data after MC. This is a problem since the Logan plots of distorted TACs would yield less reliable DVR values. The proposed MC method would thus be a significant contributor to the precision of the data.
CONCLUSION
The retrospective image-based MC method described in this paper significantly improves the image quality and the measured tracer kinetics of [18F]-FDDNP PET images. Reliable DVR estimations and increased mean DVR separation in frontal, medial temporal, lateral temporal, and global regions between control and AD subjects are the results of employing such a method. The refined discriminant functions derived from movement corrected data add value to clinicians and researchers who want to use [18F]-FDDNP PET imaging to assist with the early diagnosis of AD and to facilitate its use in the monitoring of the efficacy of new treatments for AD. Although validation of the accuracy will need to be separately performed, the proposed MC method can be applied to PET studies on patients having other disorders (e.g., Down syndrome and Parkinson’s disease) and to brain PET scans with other molecular imaging probes.
Supplementary Material
Acknowledgments
This study was funded in part by the U.S. Department of Energy contract DE-FG02-02ER63420 and NIH grant P01-AG025831. Dr. Jorge R. Barrio gratefully acknowledges the support of the Elizabeth and Thomas Chair Endowment in Gerontology. The authors would also like to thank Dr. Linda Ercoli for performing the neuropsychological tests, David Truong and Dat Vu for their computer and database support, the UCLA Cyclotron staff for help with [18F]-FDDNP preparation, the UCLA Nuclear Medicine staff for assistance with PET acquisition, and Alex Zhou’s help in the early part of this project. We are also grateful to Dr. John Ashburner at the University College London for his expert technical assistance on the use of SPM2.
Financial Support: DOE contract DE-FG02-02ER63420 and NIH grant P01-AG025831
References
- 1.Buhler P, Just U, Will E, Kotzerke J, van den Hoff J. An accurate method for correction of head movement in PET. IEEE Trans Med Imaging. 2004 Sep;23(9):1176–1185. doi: 10.1109/TMI.2004.831214. [DOI] [PubMed] [Google Scholar]
- 2.Herzog H, Tellmann L, Fulton R, et al. Motion artifact reduction on parametric PET images of neuroreceptor binding. J Nucl Med. 2005 Jun;46(6):1059–1065. [PubMed] [Google Scholar]
- 3.Huang S-C, Hoffman EJ, Phelps ME, Kuhl DE. Quantitation in positron emission computed tomography: 2. Effects of inaccurate attenuation correction. J Comput Assist Tomogr. 1979 Dec;3(6):804–814. [PubMed] [Google Scholar]
- 4.Logan J, Fowler JS, Volkow ND, Wang GJ, Ding YS, Alexoff DL. Distribution volume ratios without blood sampling from graphical analysis of PET data. J Cereb Blood Flow Metab. 1996 Sep;16(5):834–840. doi: 10.1097/00004647-199609000-00008. [DOI] [PubMed] [Google Scholar]
- 5.Ruttimann UE, Andreason PJ, Rio D. Head motion during positron emission tomography: Is it significant? Psychiatry Res: Neuroimaging. 1995;61:43–51. doi: 10.1016/0925-4927(95)02565-f. [DOI] [PubMed] [Google Scholar]
- 6.Small GW, Kepe V, Ercoli LM, et al. PET of brain amyloid and tau in mild cognitive impairment. N Engl J Med. 2006 Dec 21;355(25):2652–2663. doi: 10.1056/NEJMoa054625. [DOI] [PubMed] [Google Scholar]
- 7.Shin J, Lee SY, Kim SH, Kim YB, Cho SJ. Multitracer PET imaging of amyloid plaques and neurofibrillary tangles in Alzheimer’s disease. Neuroimage. 2008 Nov 1;43(2):236–244. doi: 10.1016/j.neuroimage.2008.07.022. [DOI] [PubMed] [Google Scholar]
- 8.Folstein MF, Folstein SE, McHugh PR. “Mini-mental state”. A practical method for grading the cognitive state of patients for the clinician. J Psychiatr Res. 1975 Nov;12(3):189–198. doi: 10.1016/0022-3956(75)90026-6. [DOI] [PubMed] [Google Scholar]
- 9.McKhann G, Drachman D, Folstein M, Katzman R, Price D, Stadlan EM. Clinical diagnosis of Alzheimer’s disease: report of the NINCDS-ADRDA Work Group under the auspices of Department of Health and Human Services Task Force on Alzheimer’s Disease. Neurology. 1984 Jul;34(7):939–944. doi: 10.1212/wnl.34.7.939. [DOI] [PubMed] [Google Scholar]
- 10.Liu J, Kepe V, Zabjek A, et al. High-yield, automated radiosynthesis of 2-(1-{6-[(2-[18F]fluoroethyl)(methyl)amino]-2-naphthyl}ethylidene)malononitrile ([18F]FDDNP) ready for animal or human administration. Mol Imaging Biol. 2007 Jan-Feb;9(1):6–16. doi: 10.1007/s11307-006-0061-4. [DOI] [PubMed] [Google Scholar]
- 11.Friston KJ. Statistical Parametric Mapping: The Analysis of Functional Brain Images. 1. Amsterdam; Boston: Elsevier/Academic Press; 2007. [Google Scholar]
- 12.Abramoff M, Magelhaes P, Ram S. Image processing with ImageJ. Biophotonics International. 2004;11(7):36–42. [Google Scholar]
- 13.Bankman IN. Handbook of Medical Image Processing and Analysis. 2. Amsterdam: Elsevier/Academic Press; 2009. [Google Scholar]
- 14.Wong K-P, Wardak M, Shao W, et al. Quantitative analysis of [18F]FDDNP PET using subcortical white matter as reference region. Eur J Nucl Med Mol Imaging. 2009 doi: 10.1007/s00259–009–1293–8. [DOI] [PMC free article] [PubMed] [Google Scholar]
- 15.SPSS. SPSS Base User’s Guide 17.0. Chicago: Prentice Hall; 2007. [Google Scholar]
- 16.Van Belle G, Fisher L. Biostatistics: A Methodology for the Health Sciences. 2. Hoboken, N.J: Wiley-Interscience; 2004. [Google Scholar]
- 17.Tellmann L, Fulton R, Bente K, et al. Motion correction of head movements in PET: realisation for routine usage. IEEE Nuclear Science Symposium Conference Record. 2003;5:3105–3107. [Google Scholar]
- 18.Andersson JL, Vagnhammar BE, Schneider H. Accurate attenuation correction despite movement during PET imaging. J Nucl Med. 1995 Apr;36(4):670–678. [PubMed] [Google Scholar]
- 19.Picard Y, Thompson CJ. Motion correction of PET images using multiple acquisition frames. IEEE Trans Med Imaging. 1997 Apr;16(2):137–144. doi: 10.1109/42.563659. [DOI] [PubMed] [Google Scholar]
- 20.Costes N, Dagher A, Larcher K, Evans AC, Collins DL, Reilhac A. Motion correction of multi-frame PET data in neuroreceptor mapping: Simulation based validation. Neuroimage. 2009 May 27; doi: 10.1016/j.neuroimage.2009.05.052. [DOI] [PubMed] [Google Scholar]
- 21.Mourik JE, Lubberink M, van Velden FH, Lammertsma AA, Boellaard R. Off-line motion correction methods for multi-frame PET data. Eur J Nucl Med Mol Imaging. 2009 Jul 8; doi: 10.1007/s00259-009-1193-y. [DOI] [PMC free article] [PubMed] [Google Scholar]
- 22.Bloomfield PM, Spinks TJ, Reed J, et al. The design and implementation of a motion correction scheme for neurological PET. Phys Med Biol. 2003 Apr 21;48(8):959–978. doi: 10.1088/0031-9155/48/8/301. [DOI] [PubMed] [Google Scholar]
- 23.Mosconi L. Brain glucose metabolism in the early and specific diagnosis of Alzheimer’s disease. Eur J Nucl Med Mol Imaging. 2005 Apr;32(4):486–510. doi: 10.1007/s00259-005-1762-7. [DOI] [PubMed] [Google Scholar]
Associated Data
This section collects any data citations, data availability statements, or supplementary materials included in this article.