

Abstract
Mouse models of human diseases play crucial roles in understanding disease mechanisms and developing therapeutic measures. Huntington’s disease (HD) is characterized by striatal atrophy that begins long before the onset of motor symptoms. In symptomatic HD, striatal volumes decline predictably with disease course. Thus, imaging based volumetric measures have been proposed as outcomes for presymptomatic as well as symptomatic clinical trials of HD. Magnetic resonance imaging of the mouse brain structures is becoming widely available and has been proposed as one of the biomarkers of disease progression and drug efficacy testing. However, three-dimensional and quantitative morphological analyses of the brains are not straightforward. In this paper, we describe a tool for automated segmentation and voxel-based morphological analyses of the mouse brains. This tool was applied to a well-established mouse model of Huntington disease, the R6/2 transgenic mouse strain. Comparison between the automated and manual segmentation results showed excellent agreement in most brain regions. The automated method was able to sensitively detect atrophy as early as 3 weeks of age and accurately follow disease progression. Comparison between ex vivo and in vivo MRI suggests that the ex vivo end-point measurement of brain morphology is also a valid approach except for the morphology of the ventricles. This is the first report of longitudinal characterization of brain atrophy in a mouse model of Huntington’s disease by using automatic morphological analysis.
Keywords: Huntington’s disease, MRI, brain atrophy, biomarker, automated morphological analysis
Introduction
Because many loci of diseases are shared between mouse and human, mouse disease models play essential roles in the understanding of disease mechanisms, progression, and drug efficacy testing. For brain disease models, brain morphology is often an important biomarker to detect and monitor underlying pathology. These include atrophy of specific brain regions as well as ventricle enlargement. For morphological characterization of the phenotype and evaluation of therapeutic interventions, histology has been widely adopted. In recent years, however, in vivo MRI of mouse brains is becoming a promising and widely available technique to examine mouse brain morphology (Bock et al., 2006; Borg and Chereul, 2008; Delatour et al., 2006). MRI allows longitudinal monitoring of disease progression and had been applied to characterize animal models of brain diseases (Bertrand et al., 2009; Filippi et al., 1998; Lau et al., 2008; Maheswaran et al., 2009b; McDaniel et al., 2001; Ward et al., 2008). It has high anatomical fidelity without tissue deformation associated with the embedding and sectioning procedures. In addition, its three-dimensional (3D), quantitative, and digitized format makes it much more efficient at accurate volume measurement than are conventional histological approaches (Badea et al., 2007b; Jacobs et al., 1999; Johnson et al., 2007; Kovacevic et al., 2005; Ma et al., 2005; MacKenzie-Graham et al., 2004).
Quantification of brain morphology (shapes and volumes of specific anatomical areas) is not always straightforward regardless of whether the data modality is histology-based or MRI-based. Manual delineation of structures, although a well accepted and widely used method, is time-consuming and requires well trained operators and reproducibility testing. The definition of anatomical boundaries depends on delineation protocols and may not be compatible among different laboratories. To ameliorate these issues associated with manual structure delineation, voxel and atlas-based automated morphological analyses are increasingly being used in human brain studies (Ashburner and Friston, 1999; Chiang et al., 2008; Good et al., 2001; Mazziotta et al., 2001; Oishi et al., 2009b; Wright et al., 1995), and recently in several studies on mouse disease models (Lau et al., 2008; Sawiak et al., 2009a, b).
Our overall goal is to develop and test automated brain segmentation technologies and provide resource software for quantitative studies of mouse MR images. For a model system, we chose a Huntington’s disease model. Huntington’s disease (HD) is an autosomal dominant neurodegenerative disorder characterized by progressive impairment of motor function accompanied by psychiatric disturbance and dementia; impairment is caused by a CAG trinucleotide repeat in the huntingtin gene (Vonsattel et al., 1985; Myers et al., 1988; Huntington’s collaborative research 1993). HD is associated with reduction in brain volume and neuronal loss initially located in the striatum (Vonsattel et al., 1985). Other brain regions, including the cortex, hippocampus, thalamus, and hypothalamus, are also reported to exhibit atrophy (Mann Et al., 1993; Sieradzan K et al., 1997). In this study, we adopted the R6/2 mouse model, which is the first transgenic mouse model of HD and expresses exon 1 of human huntingtin (htt) with an increased CAG repeat length (Mangiarini et al., 1996). This model recapitulates many features of HD, including a progressive motor function deficit, htt aggregation, and brain atrophy. R6/2 mice are widely used to screen for potential therapeutics (Beal and Ferrante, 2004; Hersch and Ferrante, 2004; Li et al., 2005). The well-established model is ideal for testing our tools.
In the present study, the mouse atlas was generated on the basis of the adult C57Bl mouse brain, one of the background strains of the R6/2 mouse. For the registration method, Large Deformation Diffeomorphic Metric Mapping (LDDMM) was utilized that guarantees preservation of topology even with severe tissue atrophy (Miller et al., 2002). These two resources (atlas and LDDMM-based image transformation) were used for automated brain segmentation and the accuracy was tested by comparing the results with manual delineation. The tool was then applied to the R6/2 mouse model, a widely used model of Huntington’s disease in which cross sectional histology study has indicated progressive brain atrophy in this model (Stack et al., 2005), to test its efficacy in automatically differentiating anatomical features of the transgenic mice from those of the wild type mice by MRI with automated morphological analysis. The same mice were scanned longitudinally to test if the tool can detect not only the cross-sectional but also longitudinal morphological changes. A subset of the mice was also scanned ex vivo to test the usefulness of ex vivo data. Ex vivo imaging, while not suitable for longitudinal study, can be useful for acquiring high resolution high tissue contrast images for more detailed morphological analysis and has been used in several studies (Lerch et al., 2008a; Lerch et al., 2008b). The abnormalities in brain morphology reported by the automated quantitative analysis were then compared to comprehensive analyses by histology and by functional testing of the animals to test the efficacy of the MRI-based automated morphology analysis as a noninvasive and longitudinal biomarker of the disease progression. This is the first report of longitudinal characterization of brain atrophy in a mouse model of Huntington’s disease using automated morphological analysis of MR images with histological confirmation, though cross sectional MRI studies have been successfully applied to characterization of mouse models of Huntington’s disease including the R6/2 mice (Lerch et al., 2008a; Sawiak et al., 2009a, b). The validation of accuracy of automated segmentation of longitudinal in vivo MR data in current study provides us the foundation to further test the potential to use longitudinal brain volume changes to evaluate therapeutic efficacy and translate these findings to human clinical trials of disease with brain structural changes including Huntington’s disease.
Materials and Methods
Animals
Transgenic HD mice of R6/2 line were originally purchased from Jackson laboratories (Bar Harbor, ME) and the colony was maintained by breeding heterozygous R6/2 males with females from their background strain (F1 of CBA × C57Bl/6). DNA was obtained from tails of the offspring for determination of the genotype and CAG repeat size by PCR assay which was performed by Laragen Inc genotyping service (CA, USA). The mice were housed in groups of 3–5 with access to food and water ad libitum and a 12-h light/dark cycle. All experimental mice were housed in cages that included an orange mouse igloo and a green nylabone, and wet mash was provided to all R6/2 mice, starting at weaning. Both male and female mice were used in our study. The CAG repeat size for all experimental R6/2 mice ranged from 103 to 112. In this study, the average survival time in our cohort of R6/2 mice was 84 ± 3.5 days (mean ± SE, n=15). All animal experiments were performed according to procedures approved by the Institutional Animal Care and Use Committee at Johns Hopkins University.
In vivo MRI acquisition
In vivo studies were performed on a horizontal bore 9.4 Tesla MR scanner (Bruker Biospin, Billerica, MA, USA) with a triple-axis gradient and an animal imaging probe. The scanner was also equipped with a physiological monitoring system (EKG, respiration, and body temperature). Fifteen mice (8 transgenic and 7 littermate controls) were used in the MRI study. Mice were first imaged at 3 weeks of age, and then weekly up to 6 weeks old, and then biweekly up to 12 weeks old. Mice were anesthetized with isoflurane (1%) together with oxygen and air at a 1:3 ratio via a vaporizer and a facial mask. We used a 40-mm diameter birdcage coil for the radiofrequency transmitter and receiver. Temperature was maintained by a heating block built into the gradient system. Respiration was monitored throughout the entire scan. Images were acquired using a three dimensional (3D) T2-weighted fast spin echo sequence, with the following parameters: echo time (TE)/repetition time (TR) = 40/700 ms, resolution = 0.1 mm x 0.1 mm x 0.25 mm, echo train length = 4, number of average = 2, flip angle = 40o. The total imaging time was about 40 min per mouse. Mice recovered quickly once the anesthesia was turned off, and all 15 mice survived the repeated 40-min imaging session. Imaging resolution and contrast were sufficient for volumetriccharacterization of mouse brain and substructures.
Ex vivo MRI scans
Following the last scan of in vivo MRI, mice were perfused with 4% ice-cold paraformaldehyde after transcardial perfusion with 1xPBS, and brains were post-fixed in 4% paraformaldehyde at 4°C for 1 week to ensure proper fixation. Before imaging, brain samples were transferred into phosphate-buffered saline (PBS) for 3 days, to wash out paraformaldehyde. To minimize possible morphological differences between in vivo and ex vivo examinations, brains were kept inside the skull during ex vivo imaging, which was performed on an 11.7 Tesla scanner (vertical bore, Bruker Biospin, Billerica, MA). The scanner is equipped with a Micro 2.5 gradient system with a maximum gradient strength of 120 Gauss/cm. Brain specimens were kept in home built plastic tube filled with Fomblin (Fomblin Profludropolyether, Ausimont, Thorofare, NJ, USA) to prevent dehydration. We used a 15 mm diameter birdcage coil for the radio frequency transmitter and receiver. Images were acquired using a 3D T2-weighted fast spin echo sequence, with the following parameters: echo time (TE)/repetition time (TR) = 40/800 ms, resolution = 0.08 mm x 0.08 mm x 0.08 mm, echo train length = 4, number of average = 2, flip angle = 40o. Total imaging time was 4~5 hours. This imaging protocol generated satisfactory resolution and contrast for delineation of mouse brain structures.
Image analysis
Generation of single subject brain atlas
From a set of in vivo T2-weighted MR images of C57Bl/6 mice (n = 10, female, 12 weeks old), a template mouse brain image, which has manually segmented whole brain and ventricular volumes close to the median values of the six mice, was selected. The template mouse brain image was then manually adjusted to the orientation defined in the Paxinos’ atlas with an isotropic resolution of 0.1 mm x 0.1 mm x 0.1 mm per pixel. This atlas contains manual segmentation of 10 brain structures that follow closely to the definition by Paxinos (Paxinos and Franklin, 2003). The brain was segmented from the rostral ends of the olfactory bulbs to the caudal end of the cerebellum; neocortex was defined by the corpus callosum and external capsule, with the ventral boundary by rhinal fissure; striatum was defined by the corpus callosum, external capsule, and anterior commissure; hippocampus was defined by the external capsule, lateral and third ventricle, and thalamus; and the ventricle was defined by intense signal from CSF. The boundary of striatum and accumbens is often difficult to identify even with histology slides, but borders of the corpus callosum, external capsule, anterior commissure, and globus pallidus are clear in MRI. We used clear anatomical landmarks and Paxinos’ atlas to define the boundary as reproducibly as possible.
Initial processing
Both ex vivo and in vivo images were first rigidly aligned to the template image using automated image registration software (http://bishopw.loni.ucla.edu/AIR5/, AIR). After rigid alignment, both ex vivo and in vivo images had the same position and orientation as the template image, and image resolution was also adjusted to an isotropic resolution of 0.1 mm × 0.1 mm × 0.1 mm per pixel. Signals from non-brain tissue were removed manually (skull stripping).
Manual segmentation
After rigid alignment, two operators (Q. Peng and Q. Li) manually segmented the striatum, neocortex, hippocampus, cerebellum, and lateral ventricles to evaluate volume changes. Criteria for volume measurements followed the definition in the atlas. Intra-rater and inter-rater variability were measured by repeating manual segmentation multiple times (3 ~ 4) until the reproducibility reached a plateau. The final intra- and inter-rater variability was measured using another dataset three times, each more than 3 weeks apart. Two double blind technicians performed image analysis for the same samples: the inter-rater variability was 3.1%, and the intra-rater variability was 2.1%, indicating our analysis method is reproducible and reliable. The two operators (QL and QP) processed data independently and we adopted the average of the two measurements.
Computational analysis
The analysis workflow is shown in figure 1. Skullstripped, rigidly aligned mouse brain (subject) images were analyzed using the DiffeoMap software (www.mristudio.org). Intensity values of the gray matter, white matter, and cerebral spinal fluid were normalized to the values in the template images by using a piece-wise linear function. This procedure ensured that subject image and template image have similar intensity histograms. The intensity- normalized subject images and the template images were submitted by the DiffeoMap software to a linux cluster, which runs Large Deformation Diffeomorphic Metric Mapping (LDDMM). Given images from the template and subject images, LDDMM automatically constructs nonlinear transformations between matching anatomical features on the basis of image intensity throughout the entire brain (Miller et al, 2002). The transformations were then used for quantitative measurement of difference in local tissue volume between the template and subject images, by computing the Jacobian values of the transformations. LDDMM generates accurate and topology-preserving transformations between images, and deformation-based morphometry (DBM) (Ashburner and Friston, 2000) can detect regional brain atrophy. By combining MRI, LDDMM, and DBM, we can now investigate volumetric changes in the entire brain longitudinally without the need to explicitly define regions of interest.
Figure 1.
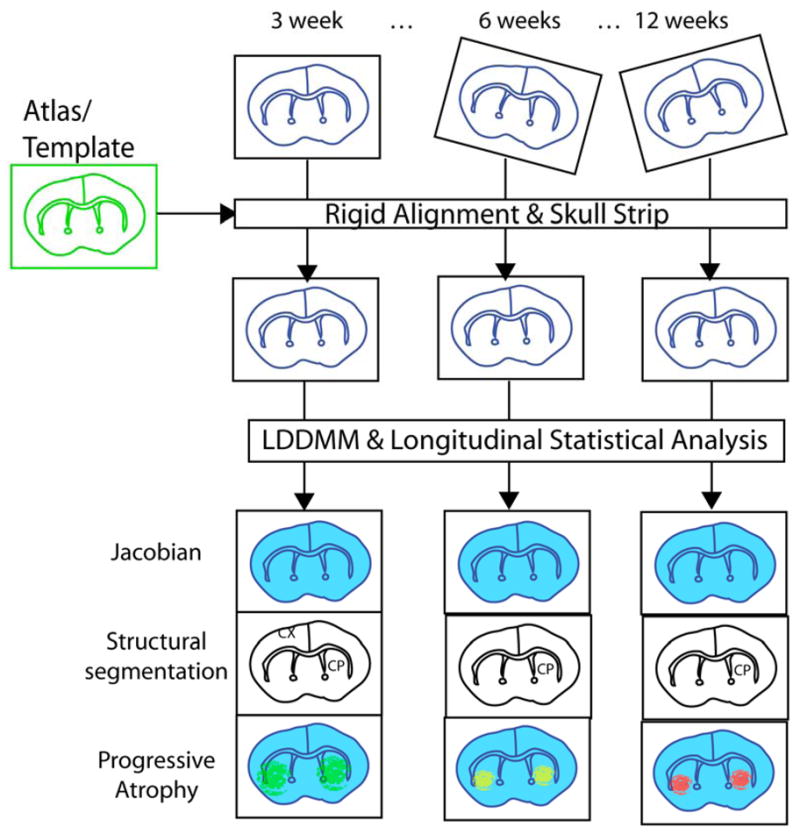
Diagram of the image analysis workflow. In vivo MR images of mouse brains from several time points were first skull stripped and rigidly aligned to the template image. The rigidly aligned images were then normalized to the template using LDDMM. Maps of Jacobian were calculated from the nonlinear transformations generated by LDDMM. Cross-sectional and longitudinal analysis were performed using both voxel based methods and atlas based methods.
Behavioral test and survival study
Thirty mice in a separate cohort were randomly divided into each group. Nontransgenic control mice were wild type littermates. Each group contained 15 mice at the beginning of the survival study and motor behavioral analyses. We used the same set of animals for survival analyses and motor performance tests. Survival was monitored daily by two experienced operators (Q. Peng and Q. Li). The mice were euthanized when HD mice were unable to right themselves after being placed on their backs and to initiate movement after being gently prodded for 30 sec. Motor behavioral performance was assessed with a rotarod apparatus (Columbus Instruments, OH) in which the time the mouse remains on the rod at accelerating speed from 4 to 40 rpm was measured. Each mouse was trained for 5 minutes at the beginning and the training session was followed by a 1-hour rest period in the home cage. Mice were then placed back on the rotarod for three trials of maximal 5 minutes at accelerating speeds (4–40 rpm) separated by a 30-minute rest period. Mice were tested on 3 consecutive days, by which time a steady baseline level of performance was attained.
Silver staining and quantification of neurodegeneration
Mice were perfused by 4% paraformaldehyde, brain sections were processed in a frozen microtome, and 40 μm thickness brain sections were collected. Silver staining for degenerating neurons was performed on free floating sections of 40 μm thickness by using the commercially available FD neurosilver Kit 1 (FD NeuroTechnologies, Ellicott City, MD) according to the manufacturer's instructions. The degenerating neurons were identified by dark silver-positive staining. All photographs used for quantification were taken with a Nikon Eclipse TE 2000 inverted microscope attached to a CCD Digital camera (Hamamatus Photonics K.K., Hamamatus, Japan). The area of interest was measured using the Image-Pro software Version 4.5 (MedicaCybernetics, Silver Spring, MD). The average value of three 40 μm-thick sections from each mouse was calculated for comparison between control mice and R6/2 mice.
Statistics
Two-way (genotype and age) repeated measurement analysis of variance (ANOVA) was first performed to evaluate the overall significance of the changes in the volumes of the lateral ventricles, neocortex, striatum, hippocampus, cerebellum, and whole. Post-hoc tests were performed using Student’s t-tests with Bonferroni correction for multiple comparisons. Group comparison on the logarithm of the Jacobian values between the R6/2 and control mice at each age was performed at each pixel inside the brain by using two-way (genotype and age) repeated measurement ANOVA with post hoc test with false discovery rate set at 0.05 to control for possible false positives (Genovese et al., 2002) using SPM 99 (http://www.fil.ion.ucl.ac.uk/spm). Because the template image has orientation and position similar to that defined in the Paxino’s atlas, regions with significant atrophy were labeled according to the atlas. One-way ANOVA with post hoc analysis was used to compare rotarod data and histology data between R6/2 mice and age-matched littermate control mice. Survival data were analyzed by Kaplan-Meier analysis. Correlations between brain regional atrophy and motor behavioral performance were modeled using Pearsonian correlation analysis. All statistical analysis except for the voxel based analysis on the logarithm of the Jacobina values were performed using SYSTAT (Systat software, Inc, Chicago, IL, USA).
Results
Time course of tissue atrophy in R6/2 mice
In vivo longitudinal MRI scans of the R6/2 mice (n = 8) and their littermate control (n = 7) were performed at 3, 4, 5, 6, 8, 10, 12 weeks of age to monitor the onset and progression of brain atrophy. Figure 2 shows representative MR images of a control mouse and a R6/2 mouse at four time points. To visualize the morphological difference, major structures in the wild type brain are delineated by dotted lines and superimposed on the R6/2 brain. Progressive enlargement of the lateral ventricles and atrophy in the striatum, cortex, and hippocampus are evident.
Figure 2.
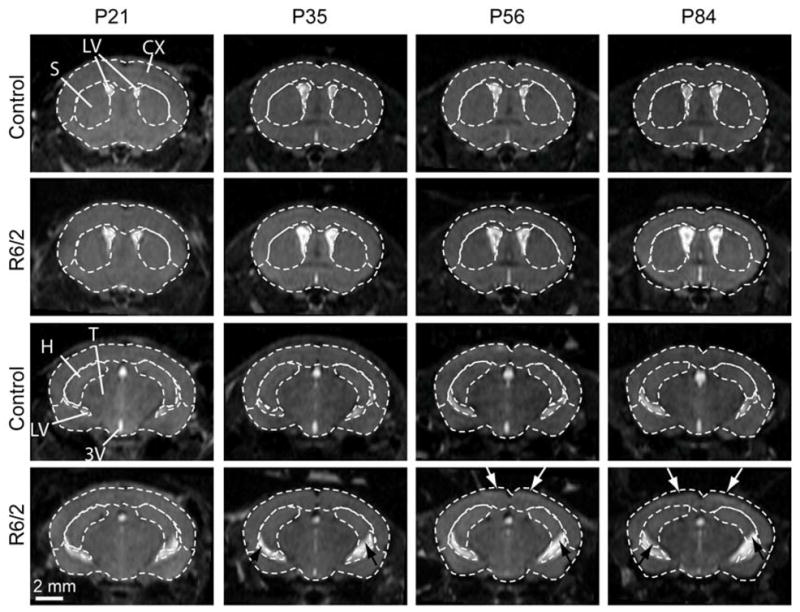
Representative longitudinal in vivo MRI images of a control and an R6/2 mouse at two coronal levels. Boundaries of major brain structures were defined in the control mouse brain images and displayed as dotted lines in both control and R6/2 mouse brain images. Potential atrophy in the cortex and hippocampus are indicated by white and black arrows, respectively. Structural abbreviations are: 3V, third ventricle; CX, neocortex; H, hippocampus; LV, lateral ventricles; S, striatum; and T, thalamus.
Accuracy level of automated tissue segmentation
Using manual segmentation results as the gold standard, we compared the level of accuracy of LDDMM-based image segmentation to that of affine-based image segmentation in the T2 MRI data of adult mouse brains. The mismatches between the automated (Affine or LDDMM) and manual segmentation results were measured by the minimal distance at each point between the 3D surfaces reconstructed from the segmented volumes. The distance measurements were then rendered on the surfaces reconstructed from the manual segmentation results (Figure 3). Overall, LDDMM-based segmentation results approximated the manual results more closely than did the affine-based segmentation results. In most areas on the surfaces, the mismatch between the LDDMM-based results and manual results were within 0.1 mm, the size of an individual pixel. The region near the posterior horn of the lateral ventricles, including the neighboring hippocampal region, however, showed a large degree of mismatch even with LDDMM-based segmentation. Table 1 shows the average distances between manually and automatically reconstructed surfaces and their standard deviations. For the adult wild type mice, the average surface distances between affine-based and manual segmentation results were 0.125 ± 0.040 mm, 0.124 ± 0.051 mm, and 0.098 ± 0.030 mm for the ventricle, the hippocampus, and the striatum, respectively. In comparison, the LDDMM-based segmentation was able to reduce the average surface distances to 0.029 ± 0.040 mm, 0.018 ± 0.037 mm, and 0.012 ± 0.016 mm, respectively. A similar improvement of LDDMM-based segmentation over affine-based segmentation was also observed in the adult R6/2 mice. Although the performance of affine-based segmentation in the R6/2 mice is not as good as its performance in the adult wild type mice, probably due to the large morphological changes present in the adult R6/2 mice, the LDDMM-based segmentation performed equally well in both R6/2 and wild type mice.
Figure 3.

Accuracy of affine and nonlinear registration on the surfaces of ventricles, hippocampus, and striatum by using manual segmentation as standard. In vivo MRI images from six 12-week-old R6/2 mouse brains were normalized to our atlas image by using affine and nonlinear transformation (Miller et al., 2002). The segmentation in the atlas image was transformed into each subject image by affine or LDDMM transformations. The distances between the structural boundaries reconstructed from automated segmentation and surfaces reconstructed from manual segmentation results are visualized on the structural surfaces.
Table 1.
Average distances and standard deviations between manual and automated segmented mouse brain structure surfaces based on MRI data. Automated segmentation was first performed using affine transformation followed by LDDMM. Data from both the wild-type (n = 6) and R6/2 (n=6, in parenthesis) mice are shown.
| Brain region | Affine ( mm) | LDDMM (mm) |
|---|---|---|
| striatum | 0.098 ± 0.030 (0.143 ± 0.050) | 0.012 ± 0.016 (0.007 ± 0.008) |
| Hippocampus | 0.124 ± 0.051 (0.191 ± 0.051) | 0.018 ± 0.037 (0.007 ± 0.013) |
| Cortex | 0.089 ± 0.040 (0.147 ± 0.083) | 0.008 ± 0.023 (0.007 ± 0.019) |
| Cerebellum | 0.144 ± 0.064 (0.208 ± 0.064) | 0.004 ± 0.019 (0.013 ± 0.028) |
| Lateral ventricle | 0.125 ± 0.040 (0.179 ± 0.059) | 0.029 ± 0.040 (0.008 ± 0.013) |
Figure 4 shows correlation plots between volume measurements based on the manual and LDDMM based segmentation results at 4 weeks, 6 weeks, and 12 weeks of age. They demonstrate strong correlations between the manual and LDDMM results for all brain regions measured in this study with R2 higher than 0.6, except for the striatum at 12 weeks old (R2 = 0.571) (Table S1 in supplementary materials). Table 2 further shows the average difference and standard deviation of the differences between manual and LDDMM-based volume measurements at the three stages. The LDDMM results have similar or lower variability than the intra rater variability (2.1%) for all structures except for the lateral ventricles.
Figure 4.

Correlation plots between automated segmentation based on LDDMM (vertical axis) and results of manual segmentation (horizontal axis). They demonstrates high correlation for all brain regions measured in this study. Open circles, wild type mice; closed circles, R6/2 mice.
Table 2.
Average difference between manual and LDDMM based automated volume segmentation results (LDDMM minus manual results) at 4, 6, and 12 weeks of age in both the wildtype and R6/2 mice. The difference was measured as percentage of the manual segmentation results.
| Structures | 4 weeks (%) | 6 weeks (%) | 12 weeks (%) |
|---|---|---|---|
| Striatum | 0.65 ± 2.58 | −0.83 ± 0.90 | −0.65 ± 2.25 |
| Hippocampus | −0.52 ± 0.85 | −0.65 ± 2.25 | −0.52 ± 2.05 |
| Lateral ventricles | 7.59 ± 9.49 | −0.24 ± 8.12 | −4.06 ± 10.23 |
| Cortex | 1.97 ± 1.04 | 2.59 ± 1.54 | 3.37 ± 1.97 |
Longitudinal data analyses
By using the automated method, the longitudinal morphological changes were quantified over a 9-week period in R6/2 mice as shown in Figure 5. At 3 weeks of age, the whole brain and the cerebellar volumes were not significantly different, but the tendency of small internal structures and the larger ventricles can already be appreciated in R6/2 mice compared to these in littermate control mice. These differences reach statistical differences between R6/2 mice and control mice at the 4 to 5 weeks of age.
Figure 5.

Time course of volumetric changes in several brain regions including striatum (a), neocortex (b), hippocampus (c), lateral ventricle (d), cerebellum (e), and whole brain (f) and. Significant atrophy was detected in the striatum, neocortex, hippocampus, and whole brain by MRI in 4-week-old R6/2 mice and regional atrophy progressed with age. Enlarged lateral ventricle was detected at 3 weeks in R6/2 mice and it did not progress with age. There is no significant change of cerebellum volume. *p<0.01 compared to the values of age-matched nontransgenic littermate controls (WT) mice. Data were from 8 WT and 7 R6/2 mice. Two-way (genotype and age) repeated measurement analysis of variance was first performed to evaluate the overall significance of changes in the volumes of the lateral ventricles, neocortex, striatum, hippocampus, cerebellum, and whole brain. Post-hoc tests were performed using Students' t-tests with Bonferroni correction for multiple comparisons.
A voxel-based analysis of local atrophy (Jacobian map) in R6/2 mice was also performed and the results are shown in Figure 6. These images clearly show atrophy progresses at each location. Namely, at 5 weeks of age, atrophy in the striatum (yellow arrow) and cortex (white arrow) reached significant levels and the atrophied areas gradually progressed into the hippocampus (red arrow), the thalamus (orange arrow), the piriform cortex (magenta arrow), and the amygdala (cyan arrow).
Figure 6.
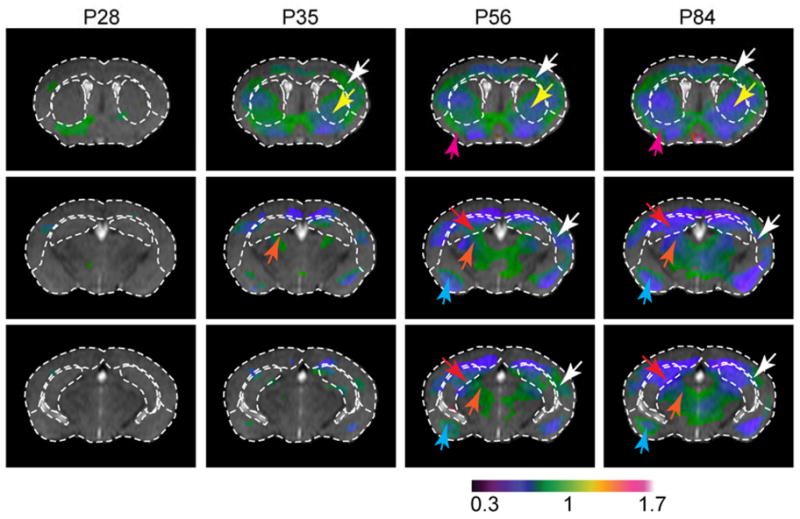
Representative in vivo MRI images with deformation-based morphometry (DBM) of relative tissue volume; major structural boundaries defined in the control mouse are overlaid on the R6/2 mouse and color-coded Jacobian maps for visual guidance. In the Jacobian map, only regions with significant change in local tissue volume (false discovery rate = 0.05) are shown. The color reflects the normalized local tissue volume with respect to local tissue volume in similar regions in the control mouse brains. Green and blue in the Jacobian map indicate mild and severe atrophy, respectively. Atrophy in the neocortex (white arrows), striatum (yellow arrows), piriform cortex (magenta arrows), hippocampus (red arrows), thalamus (orange arrows), and amygdala (cyan arrows) can be appreciated.
Comparison between ex vivo MRI and in vivo MRI data
Perfusion fixed brains have been widely used to measure volumes by histological method, in order to determine the effects of fixation on brain volumes, we performed ex vivo high resolution MRI on perfusion fixed brains after in vivo MRI. Major brain structures were manually segmented by the same protocol as that was used for the in vivo MRI data. Although we found that there was overall reduction of brain volume after perfusion, similar brain volume changes were observed between the R6/2 mice and control mice (Table 3). The only exception was in the ventricle volumes, where in vivo ex vivo correlation was poor, probably due to collapse of the ventricle by the removal of pressure of cerebral spinal fluid (CSF) in postmortem specimens.
Table 3.
Regional brain volumetric data comparison between in vivo MRI scan and perfused brain ex vivo MRI scan. Data are expressed as mean ± SE. n=3 mice in each group.
| Brain region | In vivo MRI data | ex vivo MRI data | % shrinkage | |
|---|---|---|---|---|
| Whole brain | WT | 486.95 ± 9.32 | 465.65 ± 2.12 | 4.37 |
| R6/2 | 395.76 ± 15.84 | 364.95 ± 16.40 | 7.79 | |
| % average change (R6/2 versus nontg) | −18.7% | −21.6% | ||
| Striatum | WT | 29.87 ± 0.94 | 23.37 ± 0.07 | 21.8 |
| R6/2 | 20.96 ± 0.64 | 18.73 ± 0.25 | 10.6 | |
| % average change (R6/2 versus nontg) | −29.8% | −19.8% | ||
| Hippocampus | WT | 28.45 ± 2.27 | 26.34 ± 0.84 | 7.42 |
| R6/2 | 19.44 ± 0.72 | 19.32 ± 0.48 | 0.62 | |
| % average change (R6/2 versus nontg) | −31.7% | −26.6% | ||
| Cortex | WT | 119.021 ± 2.09 | 110.74 ± 1.92 | 6.96 |
| R6/2 | 106.4 ± 2.33 | 97.60 ± 2.30 | 8.27 | |
| % average change (R6/2 versus nontg) | −10.6 % | −11.8% | ||
| Cerebellum | WT | 64.05 ± 1.98 | 59.30 ± 1.81 | 7.42 |
| R6/2 | 62.72 ± 1.10 | 57.88 ± 1.05 | 7.72 | |
| % average change (R6/2 versus nontg) | −2.07 % | −2.39% | ||
| Lateral ventricle | WT | 4.876 ± 1.27 | 0.047 ± 0.001 | 99.0 |
| R6/2 | 7.779 ± 1.67 | 0.210 ± 0.108 | 97.3 | |
| % average change (R6/2 versus nontg) | +60% | +347% | ||
Histological and functional correlation to the MRI-based results
To examine the degree of neurodegeneration in the atrophied regions detected by MRI, silver staining was used to label the degenerated neurons. As shown in figure 7, the density of silver-positive staining was significantly increased in the brain regions that displayed significant atrophy in the MRI study, including the piriform cortex, hippocampus, and striatum. The decreases in structural volumes were further correlated to declines in motor function in the R6/2 mice. Significant deficits in motor function, which were evident by reduction of the time spent on the rotarod, appeared in 4-week-old R6/2 mice and declined continuously with age (Fig. 8f). The rotarod deficit correlated strongly with brain regional volume changes (Fig. 8a–8d). There was no correlation between rotarod performance and the cerebellum volume (Fig. 8e).
Figure 7.

Neurodegeneration was evident in R6/2 mice by silver staining. Silver staining of brains of 12-week-old control mice (WT) and R6/2 mice. Note that silver-positive dark bodies represent cells undergoing neurodegeneration. The degenerating neurons were detected in hippocampus, striatum and piriform cortex (middle column), which regions showed atrophy in MRI measures (right column). Scale bars=20 μm. Quantitative silver staining densities in different brain region as indicated in piriform cortex (left panel), hippocampus (middle panel) and striatum (right panel). *p<0.01 compared to the values of those in nontransgenic control wild type (WT) mice. One-way ANOVA with posthoc tests were used.
Figure 8.

There is progressive motor deficit in R6/2 mice (f). The progressive motor dysfunction is positively correlated with regional brain atrophy, including striatum (a), neocortex (b), hippocampus (c), and whole brain (d). There is no correlation between progressive motor deficits and cerebellum volume (e).
Discussion
Importance of MR-based brain morphological studies in providing biomarkers
In treatment trials, it is important to determine the efficacy of the treatment and when the treatment should begin. Therefore, biomarkers that can detect early changes and predict onset of other symptoms are valuable. MRI-based measurement of regional volumetric change is one potential candidate and has been associated with known pathology of Huntington’s disease (HD) (Aylward, 2007). Several groups have demonstrated the usefulness of longitudinal MRI in studying neurodegeneration in mouse models of the Alzheimer’s disease (Lau et al., 2008; Maheswaran et al., 2009a), Rett Syndrome (Ward et al., 2008) and Schizophrenia (Bertrand et al., 2009). To our knowledge, there is no longitudinal in vivo brain volume measures reported in mouse models of Huntington’s disease. Ideally, validation of MRI as a biomarker should be done longitudinally to determine when the specific brain region first shows detectable atrophy, whether the degree of atrophy correlates with disease progression, and how the progression of brain atrophy correlates with other detectable phenotypes such as motor dysfunction. This is particularly important with progressive disorders such as HD. Of the available HD mouse models, the R6/2 mice have been the most widely used in preclinical trials for testing potential therapeutic compounds (Beal and Ferrante, 2004; Hersch and Ferrante, 2004; Li et al., 2005), and MRI has been utilized to evaluate brain atrophy and effects of treatment in the R6/2 mice (Ferrante et al., 2002; Ferrante et al., 2000)); these studies reported brain atrophy by cross sectional comparison in the later stage of disease. It is noteworthy that we found early atrophy in different brain regions of R6/2 mice. The atrophy is positively correlated with motor behavioral deficits. Our current study confirmed the previous reports, as well as the longitudinal development of regional brain atrophy from an early age to the end-stage in R6/2 mice, indicating that MRI could be a powerful biomarker to monitor the progression of the disease and drug efficacy potentially. The significance of the current study is that we validated the accuracy of automatic segmentation of longitudinal in vivo MR data in a well-established mouse model of Huntington’s disease, and provides the foundation to further use MRI as a biomarker to evaluate the therapeutics.
Accuracy of the LDDMM-based automated segmentation
Although evidences demonstrate the importance of MR-based brain morphological studies, the image analysis strategy often becomes a bottleneck of the studies in terms of effort, accuracy, and compatibility of the results. Our results demonstrate the high level of accuracy in segmenting various major brain structures with use of LDDMM. For segmentation of the brain into major anatomical structures that can be well delineated by MR contrasts, our results agree with those in previous publications on atlas-based quantification (Ali et al., 2005; Bae et al., 2009; Sharief et al., 2008). As expected, the nonlinear LDDMM can provide much higher accuracy compared to the linear affine transformation (Fig. 3). Among nonlinear transformation approaches, the level of accuracy could depend on the transformation algorithm, transformation parameters employed, and the extent of morphological abnormalities. Therefore, it is difficult to perform direct comparison, which is beyond the scope of this article. In this study, we used a single-subject in vivo MR image as the template for image normalization and analysis instead of population average image. This is because the contrast of a single-subject in vivo MR image and the population-averaged in vivo image are different as structure are less-well defined and highly variable structures are smeared out in the population-averaged image, which resulted in unsatisfactory transformation results in our preliminary study and in our recent human studies (Oishi et al., 2009a). The relatively low resolution and limited tissue contrast of in vivo MRI data may contribute to this phenomenon. Several reports based on ex vivo MR data have shown that population averaged atlases reduce the potential bias in analysis due to individual variability and are more suitable to be used as the template image (Kovacevic et al., 2005; Lerch et al., 2008b), It will be an important effort to investigate the generation of population averaged in vivo mouse brain template images and atlases.
In addition, simple correlation of the manual automated methods has limitations. The results of anatomical delineation are highly influenced by how the anatomy is defined. In the present study, the manual segmentation criteria followed that of the pre-defined atlas used for the automated analyses. If the manual protocol had followed different criteria or the automated analyses had used a different atlas, the correlations might not be as good as those reported in this paper. We estimated the potential bias and variation introduced by the automated segmentation with respect to the manual segmentation results (Table 2). These data showed that the results of automated and manual segmentation agreed well with each other for most structures. These data can thus be used for power analysis in experimental design. In this study, we only studied the volumetric changes of 10 structures in the brain, while several reports on mouse brain atlases have include far more structures (Badea et al., 2007a; Chan et al., 2007; Kovacevic et al., 2005; Ma et al., 2005). This is because our in vivo MR images do not have enough contrast and resolution to precisely define many substructures, e.g., various nuclei in the thalamus, and accurately register more structures between the atlas and subject images.
Atlas-based vs voxel-based analysis
Once mouse brains are accurately normalized to a template space, two types of quantification methods can be performed: one that is the voxel-based and the other that is the atlas-based. In the voxel-based analysis, the Jacobian map derived from the transformation measures local tissue atrophy or hypertrophy at each pixel in the template space. An example can be seen in Fig. 6. In the atlas-based analysis, pre-segmented anatomical definitions (atlas) in the template space are transformed to conform to each mouse brain by using inverse transformation and automatically segment multiple structures in the original images and measure their volumes (Figs. 4 and 5). These two approaches should be considered as complementary rather than competing modalities. For example, if an atrophied region is located in a confined area that constitutes only a small fraction of a pre-segmented structure in the atlas, the atlas-based method may fail to detect it. On the other hand, voxel based methods have their limitations (Davatzikos, 2004). If atrophy is wide-spread and/or only by a small amount, the atlas-based approach, in which all pixel values within a segment are averaged, would provide higher statistical power than the voxel-based method.
In our results, the atlas-based approach indicates significant volume losses in the hippocampus as early as 4 weeks of age in R6/2 mice, while the majority of the pixels in the hippocampus reach significance only in the later stages by the voxel-based analysis. Another interesting finding is that enlargement of the ventricle, which was detected by the atlas-based approach did not reach statistical significance by the voxel-based method at most stages. This type of result occurs when enlargement (or shrinkage) does not accompany reproducible shape change or that large morphological variation exists; for example, some have ventricle enlargement in the anterior section and some in the posterior. On the other hand, the voxel-based analysis detected atrophy in the amygdala and thalamus, which were not specifically segmented in our atlas used in this study and were therefore neglected. This exemplifies how these two approaches should be used as complementary approaches.
The discussion in the previous section leads to a question, “can we define hundreds of anatomical structures in the atlas and perform very detailed anatomical analyses?” whereas it is possible to define many structures by, for example, transferring structures defined in the Paxinos’ atlas to an MRI data manually or via advanced registration methods, such efforts may not lead to accurate automated segmentation of MRI data. This is because the accuracy of both manual and automated anatomical segmentation is limited by the tissue contrasts within MRI data; namely, even with a sophisticated image analysis technology, it is not possible to accurately define structures that are indistinguishable in MRI
In vivo vs ex vivo analysis
In vivo MRI has clear advantages over ex vivo MRI because it allows longitudinal monitoring. Nonetheless, one shortcoming is that because of the time constraints and involuntary motion of the animals, the contrasts and image resolution are limited. In the commonly used T2-weighted images, there are many brain structures that lack internal anatomical contrasts as can be seen in Fig. 2. These include internal structures of the hippocampus, the striatum, and the thalamus. Therefore, it is not reliable to perform segmentation (manual or automated) within these structures. One advantage of the ex vivo scan is that it provides much higher spatial resolution and contrasts (e.g., diffusion tensor imaging), which can delineate brain anatomy in more detail and thus would provide opportunities to perform finer brain segmentation.
In this study, we performed automated segmentation using in vivo and ex vivo data from the same mice to validate the reliability of using ex vivo data for morphological studies, because the fixation process is known to cause morphological changes. The results indicated tissue shrinkage and collapse of the ventricle space. However, while the ventricle morphology is no longer reliable, the tissue anatomical information is well preserved and the important differences between the two groups can be observed. Therefore, ex vivo data could be a useful end-point measurement with potential improvements in the number of measurable anatomical structures.
Correlation with MRI and HD motor dysfunction
It is noteworthy that we detected very early atrophy by MRI in different brain regions of R6/2 mice. The vulnerable regions in HD, including the cortex and striatum, showed atrophy in the R6/2 mice at 4 weeks of age; other regions such as hippocampus also exhibited atrophy at this age, but the cerebellum was spared at all stages examined. These data indicate that the brain atrophy in R6/2 HD mice is more widely distributed than what is known for human pathology. This may due to more aggressive phenotypes in the short fragment HD mouse model.
We investigated correlations between the different regional brain atrophy and motor dysfunction in R6/2 mice. In addition to atrophy associated with age, there are strong correlations between deficits in motor function and brain atrophy. These correlation study results indicate that the functional change in the R6/2 mice may have originated from loss of brain volume. We have confirmed that the atrophic brain regions displayed neurodegeneration by histological examination at 12 weeks of age in the R6/2 mice. It has been reported that neurodegeneration in the R6/2 mice was detected in these regions including striatum, cortex, piriform cortex and thalamus (Kusakabe et al., 2001; Saydoff et al., 2006; Turmaine et al., 2000) in which atrophy was detected by MRI measures in our current study. The degeneration of neurons in these atrophic brain regions indicates that MRI measurement can be used to study underlying pathological changes. Potential atrophy suggested by voxel-based analysis in several other brain regions, e.g., the amygdala (Fig. 5), remains to be investigated and confirmed by histology.
Available resources
The atlases and image transformation tools, DiffeoMap, are available for download from www.mristudio.org. The methods used in this paper should be applicable to MR data by users.
Summary
In this paper, LDDMM-based automated brain segmentation was tested for quantitative analyses of mouse brain morphology. Comparison with manual delineation confirmed excellent accuracy of the automated segmentation. The tools were applied to a mouse model of HD. The automated method could detect and quantify longitudinal atrophy in several forebrain structures with an accuracy comparable to manual delineation.
Supplementary Material
Acknowledgments
We gratefully acknowledge Dr. Pamela Talalay for her dedicated editorial assistance. This research was supported by grant from the CHDI Inc foundation (to W. Duan), NINDS NS16375 (to CAR), NIH EB003543 and NIH ES012665 (to S. Mori), and NIH NS065306 (to J. Zhang).
References
- Ali AA, Dale AM, Badea A, Johnson GA. Automated segmentation of neuroanatomical structures in multispectral MR microscopy of the mouse brain. Neuroimage. 2005;27:425–435. doi: 10.1016/j.neuroimage.2005.04.017. [DOI] [PubMed] [Google Scholar]
- Ashburner J, Friston KJ. Nonlinear spatial normalization using basis functions. Hum Brain Mapp. 1999;7:254–266. doi: 10.1002/(SICI)1097-0193(1999)7:4<254::AID-HBM4>3.0.CO;2-G. [DOI] [PMC free article] [PubMed] [Google Scholar]
- Ashburner J, Friston KJ. Voxel-based morphometry--the methods. Neuroimage. 2000;11:805–821. doi: 10.1006/nimg.2000.0582. [DOI] [PubMed] [Google Scholar]
- Aylward EH. Change in MRI striatal volumes as a biomarker in preclinical Huntington's disease. Brain Res Bull. 2007;72:152–158. doi: 10.1016/j.brainresbull.2006.10.028. [DOI] [PubMed] [Google Scholar]
- Badea A, Ali-Sharief AA, Johnson GA. Morphometric analysis of the C57BL/6J mouse brain. Neuroimage. 2007a doi: 10.1016/j.neuroimage.2007.05.046. [DOI] [PMC free article] [PubMed] [Google Scholar]
- Badea A, Ali-Sharief AA, Johnson GA. Morphometric analysis of the C57BL/6J mouse brain. Neuroimage. 2007b;37:683–693. doi: 10.1016/j.neuroimage.2007.05.046. [DOI] [PMC free article] [PubMed] [Google Scholar]
- Bae MH, Pan R, Wu T, Badea A. Automated segmentation of mouse brain images using extended MRF. Neuroimage. 2009;46:717–725. doi: 10.1016/j.neuroimage.2009.02.012. [DOI] [PMC free article] [PubMed] [Google Scholar]
- Beal MF, Ferrante RJ. Experimental therapeutics in transgenic mouse models of Huntington's disease. Nat Rev Neurosci. 2004;5:373–384. doi: 10.1038/nrn1386. [DOI] [PubMed] [Google Scholar]
- Bertrand JB, Langlois JB, Begou M, Volle J, Brun P, d'Amato T, Saoud M, Suaud-Chagny MF. Longitudinal MRI monitoring of brain damage in the neonatal ventral hippocampal lesion rat model of schizophrenia. Hippocampus. 2009 doi: 10.1002/hipo.20628. [DOI] [PubMed] [Google Scholar]
- Bock NA, Kovacevic N, Lipina TV, Roder JC, Ackerman SL, Henkelman RM. In vivo magnetic resonance imaging and semiautomated image analysis extend the brain phenotype for cdf/cdf mice. J Neurosci. 2006;26:4455–4459. doi: 10.1523/JNEUROSCI.5438-05.2006. [DOI] [PMC free article] [PubMed] [Google Scholar]
- Borg J, Chereul E. Differential MRI patterns of brain atrophy in double or single transgenic mice for APP and/or SOD. J Neurosci Res. 2008;86:3275–3284. doi: 10.1002/jnr.21778. [DOI] [PubMed] [Google Scholar]
- Chan E, Kovacevic N, Ho SK, Henkelman RM, Henderson JT. Development of a high resolution three-dimensional surgical atlas of the murine head for strains 129S1/SvImJ and C57Bl/6J using magnetic resonance imaging and micro-computed tomography. Neuroscience. 2007;144:604–615. doi: 10.1016/j.neuroscience.2006.08.080. [DOI] [PubMed] [Google Scholar]
- Chiang MC, Leow AD, Klunder AD, Dutton RA, Barysheva M, Rose SE, McMahon KL, de Zubicaray GI, Toga AW, Thompson PM. Fluid registration of diffusion tensor images using information theory. IEEE Trans Med Imaging. 2008;27:442–456. doi: 10.1109/TMI.2007.907326. [DOI] [PMC free article] [PubMed] [Google Scholar]
- Davatzikos C. Why voxel-based morphometric analysis should be used with great caution when characterizing group differences. Neuroimage. 2004;23:17–20. doi: 10.1016/j.neuroimage.2004.05.010. [DOI] [PubMed] [Google Scholar]
- Delatour B, Guegan M, Volk A, Dhenain M. In vivo MRI and histological evaluation of brain atrophy in APP/PS1 transgenic mice. Neurobiol Aging. 2006;27:835–847. doi: 10.1016/j.neurobiolaging.2005.04.011. [DOI] [PubMed] [Google Scholar]
- Ferrante RJ, Andreassen OA, Dedeoglu A, Ferrante KL, Jenkins BG, Hersch SM, Beal MF. Therapeutic effects of coenzyme Q10 and remacemide in transgenic mouse models of Huntington's disease. J Neurosci. 2002;22:1592–1599. doi: 10.1523/JNEUROSCI.22-05-01592.2002. [DOI] [PMC free article] [PubMed] [Google Scholar]
- Ferrante RJ, Andreassen OA, Jenkins BG, Dedeoglu A, Kuemmerle S, Kubilus JK, Kaddurah-Daouk R, Hersch SM, Beal MF. Neuroprotective effects of creatine in a transgenic mouse model of Huntington's disease. J Neurosci. 2000;20:4389–4397. doi: 10.1523/JNEUROSCI.20-12-04389.2000. [DOI] [PMC free article] [PubMed] [Google Scholar]
- Filippi M, Mastronardo G, Bastianello S, Rocca MA, Rovaris M, Gasperini C, Pozzilli C, Comi G. A longitudinal brain MRI study comparing the sensitivities of the conventional and a newer approach for detecting active lesions in multiple sclerosis. J Neurol Sci. 1998;159:94–101. doi: 10.1016/s0022-510x(98)00144-0. [DOI] [PubMed] [Google Scholar]
- Genovese CR, Lazar NA, Nichols T. Thresholding of statistical maps in functional neuroimaging using the false discovery rate. Neuroimage. 2002;15:870–878. doi: 10.1006/nimg.2001.1037. [DOI] [PubMed] [Google Scholar]
- Good CD, Johnsrude IS, Ashburner J, Henson RN, Friston KJ, Frackowiak RS. A voxel-based morphometric study of ageing in 465 normal adult human brains. Neuroimage. 2001;14:21–36. doi: 10.1006/nimg.2001.0786. [DOI] [PubMed] [Google Scholar]
- Hersch SM, Ferrante RJ. Translating therapies for Huntington's disease from genetic animal models to clinical trials. NeuroRx. 2004;1:298–306. doi: 10.1602/neurorx.1.3.298. [DOI] [PMC free article] [PubMed] [Google Scholar]
- Jacobs RE, Ahrens ET, Dickinson ME, Laidlaw D. Towards a microMRI atlas of mouse development. Comput Med Imaging Graph. 1999;23:15–24. doi: 10.1016/s0895-6111(98)00059-7. [DOI] [PubMed] [Google Scholar]
- Johnson GA, Ali-Sharief A, Badea A, Brandenburg J, Cofer G, Fubara B, Gewalt S, Hedlund LW, Upchurch L. High-throughput morphologic phenotyping of the mouse brain with magnetic resonance histology. Neuroimage. 2007 doi: 10.1016/j.neuroimage.2007.05.013. [DOI] [PMC free article] [PubMed] [Google Scholar]
- Kovacevic N, Henderson JT, Chan E, Lifshitz N, Bishop J, Evans AC, Henkelman RM, Chen XJ. A three-dimensional MRI atlas of the mouse brain with estimates of the average and variability. Cereb Cortex. 2005;15:639–645. doi: 10.1093/cercor/bhh165. [DOI] [PubMed] [Google Scholar]
- Kusakabe M, Mangiarini L, Laywell ED, Bates GP, Yoshiki A, Hiraiwa N, Inoue J, Steindler DA. Loss of cortical and thalamic neuronal tenascin-C expression in a transgenic mouse expressing exon 1 of the human Huntington disease gene. J Comp Neurol. 2001;430:485–500. doi: 10.1002/1096-9861(20010219)430:4<485::aid-cne1045>3.0.co;2-6. [DOI] [PubMed] [Google Scholar]
- Lau JC, Lerch JP, Sled JG, Henkelman RM, Evans AC, Bedell BJ. Longitudinal neuroanatomical changes determined by deformation-based morphometry in a mouse model of Alzheimer's disease. Neuroimage. 2008;42:19–27. doi: 10.1016/j.neuroimage.2008.04.252. [DOI] [PubMed] [Google Scholar]
- Lerch JP, Carroll JB, Dorr A, Spring S, Evans AC, Hayden MR, Sled JG, Henkelman RM. Cortical thickness measured from MRI in the YAC128 mouse model of Huntington's disease. Neuroimage. 2008a;41:243–251. doi: 10.1016/j.neuroimage.2008.02.019. [DOI] [PubMed] [Google Scholar]
- Lerch JP, Carroll JB, Spring S, Bertram LN, Schwab C, Hayden MR, Henkelman RM. Automated deformation analysis in the YAC128 Huntington disease mouse model. Neuroimage. 2008b;39:32–39. doi: 10.1016/j.neuroimage.2007.08.033. [DOI] [PubMed] [Google Scholar]
- Li JY, Popovic N, Brundin P. The use of the R6 transgenic mouse models of Huntington's disease in attempts to develop novel therapeutic strategies. NeuroRx. 2005;2:447–464. doi: 10.1602/neurorx.2.3.447. [DOI] [PMC free article] [PubMed] [Google Scholar]
- Ma Y, Hof PR, Grant SC, Blackband SJ, Bennett R, Slatest L, McGuigan MD, Benveniste H. A three-dimensional digital atlas database of the adult C57BL/6J mouse brain by magnetic resonance microscopy. Neuroscience. 2005;135:1203–1215. doi: 10.1016/j.neuroscience.2005.07.014. [DOI] [PubMed] [Google Scholar]
- MacKenzie-Graham A, Lee EF, Dinov ID, Bota M, Shattuck DW, Ruffins S, Yuan H, Konstantinidis F, Pitiot A, Ding Y, Hu G, Jacobs RE, Toga AW. A multimodal, multidimensional atlas of the C57BL/6J mouse brain. J Anat. 2004;204:93–102. doi: 10.1111/j.1469-7580.2004.00264.x. [DOI] [PMC free article] [PubMed] [Google Scholar]
- Maheswaran S, Barjat H, Bate ST, Aljabar P, Hill DL, Tilling L, Upton N, James MF, Hajnal JV, Rueckert D. Analysis of serial magnetic resonance images of mouse brains using image registration. Neuroimage. 2009a;44:692–700. doi: 10.1016/j.neuroimage.2008.10.016. [DOI] [PubMed] [Google Scholar]
- Maheswaran S, Barjat H, Rueckert D, Bate ST, Howlett DR, Tilling L, Smart SC, Pohlmann A, Richardson JC, Hartkens T, Hill DL, Upton N, Hajnal JV, James MF. Longitudinal regional brain volume changes quantified in normal aging and Alzheimer's APP x PS1 mice using MRI. Brain Res. 2009b;1270:19–32. doi: 10.1016/j.brainres.2009.02.045. [DOI] [PubMed] [Google Scholar]
- Mazziotta J, Toga A, Evans A, Fox P, Lancaster J, Zilles K, Woods R, Paus T, Simpson G, Pike B, Holmes C, Collins L, Thompson P, MacDonald D, Iacoboni M, Schormann T, Amunts K, Palomero-Gallagher N, Geyer S, Parsons L, Narr K, Kabani N, Le Goualher G, Boomsma D, Cannon T, Kawashima R, Mazoyer B. A probabilistic atlas and reference system for the human brain: International Consortium for Brain Mapping (ICBM) Philos Trans R Soc Lond B Biol Sci. 2001;356:1293–1322. doi: 10.1098/rstb.2001.0915. [DOI] [PMC free article] [PubMed] [Google Scholar]
- McDaniel B, Sheng H, Warner DS, Hedlund LW, Benveniste H. Tracking brain volume changes in C57BL/6J and ApoE-deficient mice in a model of neurodegeneration: a 5-week longitudinal micro-MRI study. Neuroimage. 2001;14:1244–1255. doi: 10.1006/nimg.2001.0934. [DOI] [PubMed] [Google Scholar]
- Miller MI, Trouve A, Younes L. On the metrics and euler-lagrange equations of computational anatomy. Annu Rev Biomed Eng. 2002;4:375–405. doi: 10.1146/annurev.bioeng.4.092101.125733. [DOI] [PubMed] [Google Scholar]
- Oishi K, Faria A, Jiang H, Li X, Akhter K, Zhang J, Hsu JT, Miller MI, van Zijl PC, Albert M, Lyketsos CG, Woods R, Toga AW, Pike GB, Rosa-Neto P, Evans A, Mazziotta J, Mori S. Atlas-based whole brain white matter analysis using large deformation diffeomorphic metric mapping: application to normal elderly and Alzheimer's disease participants. Neuroimage. 2009a;46:486–499. doi: 10.1016/j.neuroimage.2009.01.002. [DOI] [PMC free article] [PubMed] [Google Scholar]
- Oishi K, Faria A, Jiang H, Li X, Akhter K, Zhang J, Hsu JT, Miller MI, van Zijl PC, Albert M, Lyketsos CG, Woods R, Toga AW, Pike GB, Rosa-Neto P, Evans A, Mazziotta J, Mori S. Atlas-based whole brain white matter analysis using large deformation diffeomorphic metric mapping: application to normal elderly and Alzheimer's disease participantstlas. Neuroimage. 2009b;46:486–499. doi: 10.1016/j.neuroimage.2009.01.002. [DOI] [PMC free article] [PubMed] [Google Scholar]
- Paxinos G, Franklin KBJ. The Mouse Brain in Stereotaxic Coordinates. 2. Academic Press; Scan Diego: 2003. [Google Scholar]
- Sawiak SJ, Wood NI, Williams GB, Morton AJ, Carpenter TA. Use of magnetic resonance imaging for anatomical phenotyping of the R6/2 mouse model of Huntington's disease. Neurobiol Dis. 2009a;33:12–19. doi: 10.1016/j.nbd.2008.09.017. [DOI] [PubMed] [Google Scholar]
- Sawiak SJ, Wood NI, Williams GB, Morton AJ, Carpenter TA. Voxel-based morphometry in the R6/2 transgenic mouse reveals differences between genotypes not seen with manual 2D morphometry. Neurobiol Dis. 2009b;33:20–27. doi: 10.1016/j.nbd.2008.09.016. [DOI] [PubMed] [Google Scholar]
- Saydoff JA, Garcia RA, Browne SE, Liu L, Sheng J, Brenneman D, Hu Z, Cardin S, Gonzalez A, von Borstel RW, Gregorio J, Burr H, Beal MF. Oral uridine pro-drug PN401 is neuroprotective in the R6/2 and N171-82Q mouse models of Huntington's disease. Neurobiol Dis. 2006;24:455–465. doi: 10.1016/j.nbd.2006.08.011. [DOI] [PubMed] [Google Scholar]
- Sharief AA, Badea A, Dale AM, Johnson GA. Automated segmentation of the actively stained mouse brain using multi-spectral MR microscopy. Neuroimage. 2008;39:136–145. doi: 10.1016/j.neuroimage.2007.08.028. [DOI] [PMC free article] [PubMed] [Google Scholar]
- Stack EC, Kubilus JK, Smith K, Cormier K, Del Signore SJ, Guelin E, Ryu H, Hersch SM, Ferrante RJ. Chronology of behavioral symptoms and neuropathological sequela in R6/2 Huntington's disease transgenic mice. J Comp Neurol. 2005;490:354–370. doi: 10.1002/cne.20680. [DOI] [PubMed] [Google Scholar]
- Turmaine M, Raza A, Mahal A, Mangiarini L, Bates GP, Davies SW. Nonapoptotic neurodegeneration in a transgenic mouse model of Huntington's disease. Proc Natl Acad Sci U S A. 2000;97:8093–8097. doi: 10.1073/pnas.110078997. [DOI] [PMC free article] [PubMed] [Google Scholar]
- Ward BC, Agarwal S, Wang K, Berger-Sweeney J, Kolodny NH. Longitudinal brain MRI study in a mouse model of Rett Syndrome and the effects of choline. Neurobiol Dis. 2008;31:110–119. doi: 10.1016/j.nbd.2008.03.009. [DOI] [PubMed] [Google Scholar]
- Wright IC, McGuire PK, Poline JB, Travere JM, Murray RM, Frith CD, Frackowiak RS, Friston KJ. A voxel-based method for the statistical analysis of gray and white matter density applied to schizophrenia. Neuroimage. 1995;2:244–252. doi: 10.1006/nimg.1995.1032. [DOI] [PubMed] [Google Scholar]
Associated Data
This section collects any data citations, data availability statements, or supplementary materials included in this article.