Abstract
To extend the retention time of aerosol-delivered growth factors in the lung for stem cell homing/activation purposes, we examined a formulation of vascular endothelial growth factor (VEGF) complexed to dextran sulfate (DS) and chitosan (CS) polyelectrolytes. Optimal incorporation of VEGF was found at a VEGF:DS:CS ratio of 0.12:1:0.33, which resulted in nanoparticle complexes with diameters of 612±79 nm and zeta potentials of - 31±1 mV. The complexes collapsed in physiological solution, and released VEGF in a biphasic time course in vitro. In rat lungs, however, VEGF delivered in the complex was cleared at a constant exponential decay rate, 8-fold slower than that delivered in free form. The extended VEGF retention was likely due to equilibrium binding of VEGF to DS and to endogenous glycosaminoglycans. A similar retention effect is expected with other glycosaminoglycans-binding proteins (including many growth factors) when complexed with these glycans. Owing to its unique application, this type of complex is, perhaps, better described as a nanoglycan complex.
Keywords: VEGF, nanoglycan, lung, stem cell
Introduction
Stem cell therapy holds promise for lung diseases, like pulmonary arterial hypertension, chronic obstructive pulmonary disease, or bronchopulmonary dysplasia, in which the normal alveolar/vascular structures are severely damaged and the tissue cannot easily repair itself. By delivering normal functional and proliferating stem/progenitor cells to the lung, it is possible to rebuild the alveolar/vascular structure and to restore the gas exchange function of the lung. Owing to the lungs' air/liquid interface and large overall surface area, commonly used local injection methods for stem cell therapy are not possible. Pulmonary uptake, retention, and engraftment of blood-injected stem/progenitor cells are limited by the rapid circulation of the blood and lack of acute homing signals1–3. Improving the uptake and integration of blood-delivered stem cells is important for the success of pulmonary stem cell therapy.
Vascular endothelial growth factor (VEGF) is one of a number of growth factors know to support engraftment of stem/progenitor cells in tissue. VEGF promotes endothelial cell proliferation, capillary formation, and the survival of newly formed blood vessels4, 5 and it is known to recruit and retain circulating endothelial progenitor cells for neovascularization6, 7. In the lung, alveolus formation is inseparable from blood vessel generation8, and it has been demonstrated that inhibition of VEGF receptor signaling causes insufficient alveolarization in the developing rat lung and apoptosis of lung cells in adult rats9, 10. Selective knockout of the VEGF-A gene in lung epithelial cells prevents pulmonary capillary development as well as lung septae formation and epithelial cell proliferation11. VEGF gene therapy, by contrast, prevents lung injury and facilitates alveolar development12.
In order to use VEGF as a homing factor for retaining blood-injected progenitor cells and supporting their survival in the lung, VEGF needs to be delivered and retained in the tissue. While the delivery of VEGF through the airway is relatively easy, maintaining the delivered growth factor in pulmonary tissue is difficult. The large alveolar surface area in the lung absorbs the delivered VEGF rapidly into the blood stream, and the immune clearance system in the tissue scavenges foreign material efficiently. Selecting suitable biomaterials and properly formulating them for sustained release of VEGF is, thus, critical in overcoming these obstacles.
Previous studies have reported encapsulation of VEGF in multiple biocompatible materials, including spherical alginate beads13, poly(lactic-co-glycolic acid) (PLGA) microspheres14, heparin-functionalized PLGA nanoparticles15, and dextran sulfate (DS)-chitosan (CS) polyelectrolyte complexes (PECs)16. For the purpose of lung delivery, we considered formulating VEGF into nanometer size particles (200–800 nm) that have well-known sustained release properties and have shown great potential to be formulated for delivery to the deep lung. Preparation of the VEGF-encapsulated nanoparticles in aqueous solution was preferred, since harsh organic solvents often render their encapsulated biomolecules inactive, ultimately making them unsuitable for delivery of homing signal proteins. A relatively high VEGF-to-matrix ratio in the nanoparticles was also considered, since it would reduce the amount of matrix deposit in the lung, which could compromise lung function when accumulated. These reasons led to the development of a modified version of the DS-CS PECs reported by Huang and colleagues16. The retention time of VEGF in the lungs, as well as its activity, was then examined after delivery of these particles through aerosolization.
Materials and Methods
Materials
Chitosan, average molecular weight (MW) 15 kDa, ~84% deacetylated was purchased from Polysciences (Catalog #21161). Chitosan, MW range 50–190 kDa and 310–375 kDa, 75–85% deacetylated were obtained from Aldrich (# 448869 and #448877, respectively). Dextran sulfate, average MW 500 kDa, MW range 9–20 kDa, and relative MW 5 kDa were purchased from Fisher Scientific (#1585-100), Sigma (#D6924), and Fluka (#31404), respectively. Zinc sulfate and mannitol were obtained from Sigma (#M9546 and #Z0251, respectively). Human recombinant VEGF165 was prepared in our laboratory (see below). Other reagents associated with specific procedures are described below.
VEGF preparation
Human VEGF165 ORF cDNA was purchased from GeneCopoeia (#GC-Z0781). Subcloning and expression of VEGF were performed using a Bac-to-Bac Baculovirus Expression System from Invitrogen. Briefly, VEGF cDNA was inserted into a Gateway vector, pDEST8 (#11804-010), through a LR recombination reaction using the Gateway LR Clonase II enzyme mix (#11791-20). The resulting pDEST8-VEGF was transferred into DH10Bac competent E. coli (#10361-012) in which the VEGF sequence was transposed to the DH10-harbored bacmid, forming pBac-VEGF. The pBac-VEGF was subsequently transfected into Sf21 insect cells (#11497-013) to generate recombinant baculovirus, Bac-VEGF. The virus was propagated, titrated, and inoculated into Sf21 cell culture for VEGF expression. The expression medium containing secreted recombinant VEGF was collected for purification. Purification of VEGF was performed according to a previously described procedure by Lee et al.17, using columns of heparin Sepharose 6 Fast Flow, Resource S, and Resource RPC purchased from GE Health Sciences (# 17-0998-01, #17-1178-01, and #17-1181-01, respectively). The purity of the prepared VEGF was greater than 95%, according to SDS PAGE and Coomassie blue staining. The activity of the purified VEGF was determined by an endothelial cell proliferation assay, using a CellTiter 96 AQueous Cell Proliferation Assay reagent from Promega/Fisher (#PR-G5421). The EC50 of the prepared VEGF on endothelial cell proliferation was 2–5 ng/ml. For the preparation of VEGF-DS-CS PECs (see below), VEGF solution was desalted on a Zeba Desalt Spin Column obtained from Pierce/Fisher (#PI-89892). The protein concentration of VEGF was determined by the bicinchoninic acid protein assay using bovine serum albumin as a standard (Pierce/Fisher #PI-23225).
Preparation of CS-DS PECs for initial size and charge screening
Polyelectrolyte complexes were formed from various MW ratios of chitosan and dextran sulfate. Briefly, a 0.1% (w/w) chitosan in 0.175% acetic acid solution was added to a 0.1% (w/w) filtered dextran sulfate solution while stirring. The solution was stirred at maximum speed for 10 min to form complexes. The PECs were washed one time in water. Particle yield was determined gravimetrically after freeze drying 1 ml aliquots of solution in a Labconoco Freeze Dry System, Freezone 6, (Labconoco, Kansas City, Mo) at −54°C, 0.02 mbar for 24 hours.
PEC size and polydispersity index (PdI) was determined by photon correlation spectroscopy using a ZetaSizer Nano ZS (Malvern Instruments Inc., Southborough, MA). Solutions were prepared by diluting 200 μl of the PEC suspension with 2 ml of filtered water. They were then analyzed at a wavelength of 633 nm with the backscattered radiation collected at 173 degrees. The suspension temperature was 20°C. All measurements were made in triplicate.
The zeta potential of all PEC formulations was also determined utilizing a Malvern ZetaSizer Nano ZS. Solutions were prepared by centrifuging 1 ml aliquots the original PEC solutions at maximum speed for 15 minutes, discarding the supernatant, and resuspending the pellet in 1 ml of purified water in order to remove residual reagents and buffer. Final measuring solutions were then prepared by adding 0.5 ml of the PEC suspension with 0.5 ml of 2 mM NaCl to achieve a final NaCl concentration of 1 mM. The suspension was then analyzed in a disposable zeta potential capillary cell and analyzed at 25°C.
Preparation of VEGF-DS-CS PECs
DS solution was prepared at 1% (w/w) by dissolving MW 500 kDa DS in water. (Note that the water used for the reagent preparation and in vivo delivery was purchased from Sigma which is 0.1 μm-filtered.) CS solution was made at 0.1% (w/w) by dissolving MW 50–190 kDa CS in 0.175% acetic acid/water (v/v). The solutions were subsequently sterilized by filtration through 0.2 μm pore size SFCA filter units (Nalgene #162-0020). The pH of the filtered CS solution was adjusted to 5.5 using sterilized 1 M NaOH. Zinc sulfate solution (0.2 M) and mannitol solution (15%) were prepared by dissolving the chemicals in water followed by sterile filtration. The preparation of VEGF-DS-CS PECs was carried out in 2 ml sterile cryogenic vials (Nalgene # 5000-0020), or 2 ml glass vials when sterilization was unnecessary. A 7 × 2 mm micro flea stir bar was placed in each of the vials for mixing purposes (Fisher Scientific # 14-513-63SIX). To prepare the PECs, 0.1 ml DS solution was mixed with water and stirred on a digital stirring plate at 300 rpm at room temperature. VEGF was subsequently added to achieve the specified VEGF/DS (w/w) ratio, and mixed with DS for 20 min. The stirring speed was then increased to 800 rpm and CS solution was added to achieve the specified CS/DS (w/w) ratio. The total volume of the mixture was 0.7 ml after the CS addition. After 5 min of mixing, the stirring speed was increased to 1200 rpm and ZnSO4 solution was added slowly (in a length of 1 min) to a final concentration of 25 mM. The rapid mixing and slow addition of ZnSO4 were chosen to avoid formation of micro-precipitates of zinc under mildly acidic conditions. The stirring was decreased to 800 rpm and continued for 30 min. Finally, 0.4 ml 15% mannitol solution was added and stirred for 2–5 min. The resulted PEC suspension was transferred to a 1.5 ml tube and centrifuged at 15,000 × g for 15 min at 4°C. The supernatant was removed, the pellet resuspended in 1.2 ml 5% mannitol to prevent aggregation, and the suspension centrifuged again. After three rounds of centrifugation, the final pellet was suspended in 0.2 ml 5% mannitol and stored at 4°C for subsequent application.
VEGF entrapment efficiency
The amount of VEGF incorporated in the DS-CS PECs was determined by SDS polyacrylamide gel electrophoresis (SDS PAGE) and densitometry analysis using purified VEGF as a density standard. We used this method for VEGF quantification because DS and CS both interfere with protein assays, and the reagents used for VEGF extraction from VEGF-DS-CS PECs also interfere with protein assays. For SDS PAGE, VEGF or VEGF-DS-CS PECs were diluted in 5% mannitol and mixed with reducing Laemmli sample buffer (LBR) at pH 7.5. The samples were heated at 100°C for 10 min, vortexed vigorously for 20 sec, and centrifuged at 15,000 × g for 10 min at room temperature. The supernatants in these samples were loaded on a 4–20% SDS gradient gel (BioRad). The gel was run at 200 V for 30 min and stained with Coomassie blue using Gelcode Blue stain reagent (Pierce #24590). A VersaDoc scanning system and the accompanying software (BioRad) were used to quantify the band density of VEGF. A density standard curve was constructed with serially diluted VEGF, and the quantity of VEGF in VEGF-DS-CS samples was calculated against the standard curve. VEGF particle entrapment efficiency was determined as: VEGF (mg) in final VEGF-DS-CS PECs / VEGF (mg) added to the reaction mixture × 100%.
In vitro VEGF release analysis
VEGF-DS-CS PECs were suspended in Release Buffer containing 2.5% mannitol and 50% Dulbecco's Phosphate-Buffered Saline without calcium and magnesium (D-PBS w/o CaMg). The suspension was divided into aliquots and rotated at 37°C on a Labquake® Rotating Micro-Tube Mixer. At specified time points, the samples were removed and immediately centrifuged at 15,000 × g for 10 min at 4°C. The supernatants and pellets were separated and stored at −20°C. The pellets were reconstituted with 0.05 ml Release Buffer and analyzed with the supernatants using the SDS PAGE and densitometry method described above.
Intra-tracheal aerosolization
Sprague Dawley male rats were purchased from Charles River Laboratories and were acclimatized for 4 days in our animal facility. Animal studies were performed according to protocols approved by the Harvard Medical Area Standing Committee on Animals. At the time of aerosolization, rats (215–240 g) were anesthetized with ketamine (65 mg/kg) and xylazine (4 mg/kg), and placed on a Tilting WorkStand (Hallowell EMC). The vocal cords of the completely anesthetized animal were visualized with a speculaattached otoscope. A small amount of 2% lidocaine HCl jelly was applied to the vocal cords. The respiration rate of the animal was determined and confirmed to be greater than 80 breath/min. Immediately before the delivery, VEGF, VEGF-DS-CS PECs, or unloaded DS-CS PECs were diluted in sterile Release Buffer to a final volume of 0.23 ml. A MicroSprayer Aerosolizer (PennCentury Model IA-1B), shaped as a bent blunt-end needle, was attached to a gas-tight 0.5 ml Hamilton syringe. The syringe was filled with 0.2 ml air followed by 0.23 ml sample. The aerosolizer was inserted into the trachea through the vocal cords and advanced to the end of the trachea slightly above the bifurcation point. A rapid push of the syringe delivered the aerosol to the lung. The aerosolizer was withdrawn and the animal was held in an upright position for 3 min to regain a normal breathing pattern. Animals were given standard rat chow and tap water ad libitum for the duration of the study. Before tissue harvest, the animals were anesthetized with ketamine (130 mg/kg) and xylazine (8 mg/kg). The lung vessels were perfused with D-PBS. The collected tissue samples were immediately frozen in liquid nitrogen and stored at −80°C for later analysis.
Analysis of VEGF content and activity in the lung
Frozen lung tissue was homogenized in ice-cold homogenization buffer containing D-PBS w/o CaMg, 2 mM EDTA, and 1% Protease Inhibitor Cocktail set III (Calbiochem #539134) at 5 ml/g tissue. The homogenization was performed at 22,000 rpm for 30 sec using a Polytron Homogenizer (Kenematica model PT2100). The homogenates were transferred to 2 ml tubes and sonicated in an ice water-filled cup horn that is connected to an ultrasonic processor Sonic VC750 (Sonics & Materials, Inc.). Samples were sonicated at 75% amplitude for 2 min with alternate 10 sec-on and 5 sec-off pulses. The samples were subsequently centrifuged at 15,000 × g for 10 min at 4°C. Supernatants were transferred to a new tube and centrifuged again. After 3 rounds of the centrifugation, the supernatant was divided into small aliquots, and stored at −80°C. The protein concentrations in the supernatants were determined by the BCA protein assay using bovine serum albumin as standard. VEGF concentrations in the homogenate supernatants were determined by ELISA using reagents from R&D systems following the manufacturer's instructions. Supernatants of tissue homogenates prepared from lung tissue that received empty PECs were used as sample blanks in the ELISA measurements. All samples were diluted in dilution buffer (1% BSA/PBS) to a sample protein concentration of < 0.04 mg/ml before loading in the ELISA plates. At this concentration range, the sample blanks gave no higher reading compared to that of reagent blanks (1% BSA/PBS).
VEGF activity in the supernatant of lung tissue homogenates was determined using a human pulmonary artery endothelial cell (HPAEC) proliferation assay as described above. Before use in the assay, 0.1 ml supernatant of the homogenate of each sample was desalted on two consecutive Zeba desalting 0.5 ml spin columns (Pierce/Fisher) to remove EDTA and protease inhibitors in the sample, and was diluted 120-fold in basal endothelial cell culture medium (EBM-2) containing 0.4% fetal bovine serum before adding to G0/G1 phase-arrested HPAECs for the proliferation assay.
Bronchoalveolar lavage and histological analyses
Animals were euthanized by injection of ketamine (130 mg/kg) and xylazine (8 mg/kg) followed by exsanguination. An 18 gauge tubing adaptor was inserted into the trachea. Four ml PBS was gently flushed into and aspirated from the lungs three times, and the procedure repeated 5 times. The collected bronchoalveolar fluid (total ~24 ml) was centrifuged at 300 × g for 10 min. The resulting cell pellet was suspended in 1 ml PBS, and leukocyte number in the suspension was counted using a hemocytometer.
For histological analysis, lungs were inflated with formalin, processed in a Shandon Excelsior tissue processor (Fisher), and paraffin-embedded. Tissue sections were cut at 5 μm thickness and stained with hematoxylin and eosin as described previously18.
Statistical analysis
Data are presented as means ± standard deviation (SD). Statistical analysis was performed by one-way or two-way ANOVA and post-hoc pairwise comparisons. P < 0.05 indicates statistical significance.
Results
Chitosan (CS) - dextran sulfate (DS) polyelectrolyte complexes (PECs)
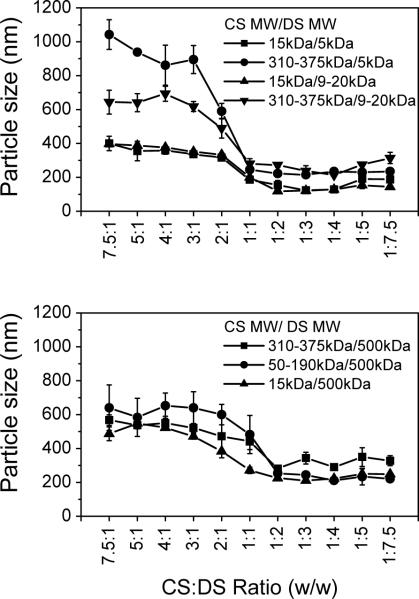
CS and DS are charged polysaccharides that have repeating units of glucose sulfate in DS and of glucosamine/ N-acetyl-glucosamine in CS. Ionic interactions between CS and DS produce PECs. The final particle size and charge of the PECs are determined by the molecular weight of each of the polymers and the weight ratio between them19. These particle characteristics, in turn, affect their overall stability, targeting properties, and release profiles of their payload. In order to select a suitable pair of CS and DS for the following VEGF study, we examined various combinations of DS and CS molecules, and measured the sizes and charges of the resulting PECs. The data in Figure 1 show that the particle sizes of the PECs fell into two general regions. On the right half of the graphs, where the CS:DS ratios were 1:2 to 1:7.5, the sizes of the PECs were relatively small and stable, not varying significantly with the CS:DS ratio changes in this region. The combination of small CS (MW 15 or 50–190 kDa) and small DS (MW 5 or 20 kDa) in this region gave particle sizes between 100–200 nm; large CS (MW 310–375 kDa) and large DS (MW 500 kDa) gave particle sizes between 300–400 nm; and small CS and large DS or large CS and small DS gave particle sizes between 200–300 nm. On the left half of the graphs, where the CS:DS ratios were 7.5:1 to 2:1, particle size increased by increasing the mass ratio of chitosan to dextran sulfate; this held true independent of the molecular weight of chitosan. Particle size, however, was dependent on the chitosan molecular weight, with the larger sizes forming larger complexes. Overall, the particle sizes were 200 to 800 nm larger than the same molecular size combination of CS-DS on the right half of the graphs.
Figure 1. Particle sizes of CS-DS PECs.
CS and DS solutions were mixed at incremental CS:DS (w/w) ratios as indicated. Various molecular weights of CS (MW 15, 50–190, and 310–375 kDa) were mixed with DS (MW 5, 9–20, and 500 kDa), and the particle sizes of resulting PECs were measured. Data are presented as mean ± standard deviation from three preparations.
Zeta potential (Figure 2) also followed general trends based on the mass ratio of CS to DS. Complexes with higher CS content tended to have an overall positive charge (5 to 14 mV). Complexes with higher DS mass content exhibited an overall negative charge ranging between −35 to −40 mV.
Figure 2. Zeta potentials of CS-DS PECs.
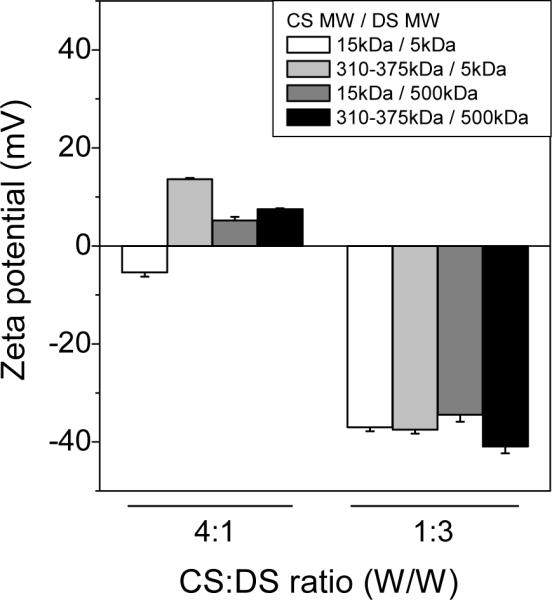
CS and DS were mixed at CS:DS ratio (w/w) 4:1 or 1:3. Various molecular weights of CS (MW 5, and 310–375 kDa) were mixed with various DS (MW 5, and 500 kDa), and the zeta potentials of the PECs were measured. Data are presented as mean ± SD from three preparations.
For this application of delivery, particles with smaller sizes and negative charges were more favorable. Therefore, we focused on formulations with higher DS mass ratios. Of the potential candidates in this range we decided to use the combination of 500 kDa DS and 50–190 kDa CS for the next study. The reasons for this choice were that it avoids using low MW DS, which has been known to exert anticoagulant effects similar to that of heparin20. Large DS molecules are less permeable to the alveolar/capillary barrier, and, thus, may be relatively safer from the perspective of hemorrhagic risk. Another small CS, MW 15 kDa, was found unable to pass through filtration membranes for sterilization purposes, rendering it unsuitable for in vivo delivery.
VEGF-DS-CS PEC formulation
The VEGF-DS-CS PECs (VEGF PECs) were prepared by mixing VEGF with DS, CS, and then zinc sulfate (ZnSO4) for a total of one hour. The resulting PECs were centrifuged and washed three times with 5% mannitol, then subjected to VEGF content analysis. In the present study, we examined the necessity of ZnSO416, 21 in the preparation of VEGF PECs. As shown in Figure 3, the levels of VEGF incorporation in the CS-DS PECs were dramatically different in the presence and absence of ZnSO4. Without ZnSO4, little VEGF was incorporated in the PECs. Zinc forms salt bridges among negatively charged macromolecules, and, thus, may help form and stabilize the PECs.
Figure 3. Effect of ZnSO4 on VEGF incorporation in CS-DS PECs.
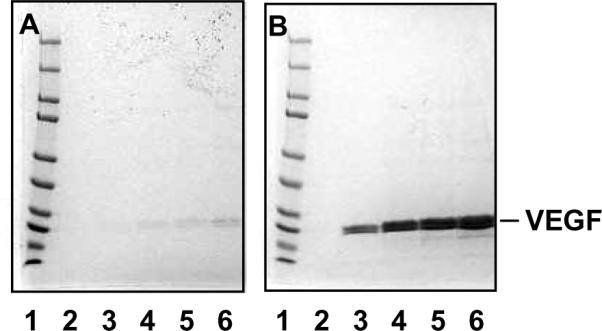
VEGF-DS-CS PECs were prepared in the absence (A) and presence (B) of 25 μM ZnSO4. VEGF content in the resulting PECs were analyzed by SDS PAGE followed by Coomassie blue staining. Lane 1 in both gels were loaded with MW standards indicating protein sizes of 250, 150, 100, 75, 50, 37, 25, 20, 15, and 10 kDa (from top to bottom). Lane 2, 3, 4, 5, and 6 in both gels were loaded with PECs prepared with 0, 10, 20, 30, and 40 μg VEGF, respectively. The amounts of DS and CS in these preparations were 1 mg and 0.25 mg, respectively.
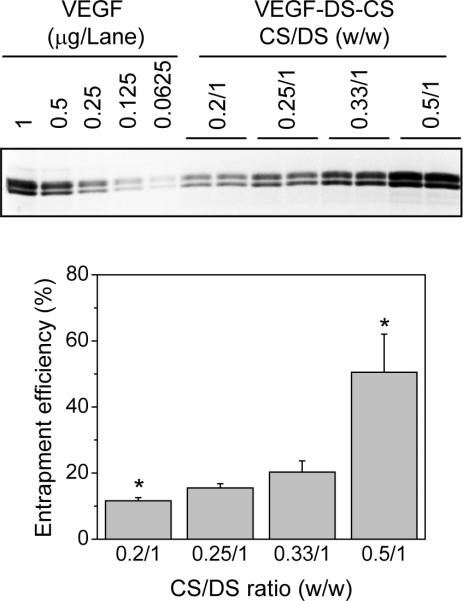
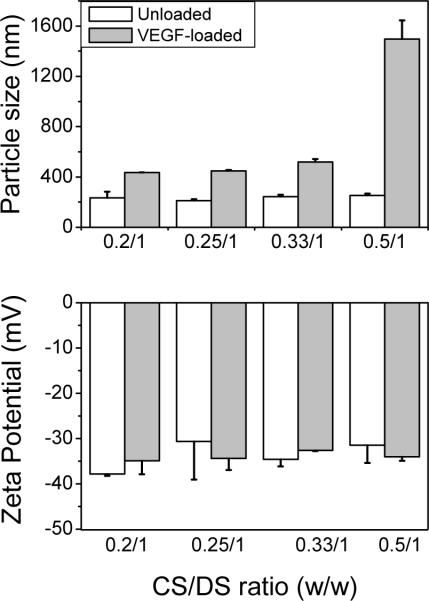
To achieve maximum VEGF incorporation in the PECs, we examined the effect of CS:DS ratios on the VEGF entrapment efficiency. In this experiment, VEGF (0.04 mg) was mixed with 1 mg DS, and then with 0.2, 0.25, 0.33, or 0.5 mg CS (CS:DS ratios 0.2:1, 0.25:1, 0.33:1, and 0.5:1, respectively). The amount of the incorporated VEGF was determined by SDS PAGE and densitometry analysis. As shown in Figure 4, the entrapment efficiency of VEGF was enhanced by increasing the CS:DS ratio: at CS:DS ratios of 0.2:1, 0.25:1, 0.33:1, and 0.5:1, the entrapment efficiency was 12±1%, 18±4%, 23±7%, and 63±29%, respectively. The sizes and zeta potentials of the VEGF-loaded PECs and unloaded PECs are shown in Figure 5. At CS:DS ratios of 0.2:1, 0.25:1, 0.33:1, and 0.5:1, the VEGF-loaded PECs were 435±2, 449±6, 520±22 nm, and 1496±149 nm, respectively, and unloaded PECs were 234±49, 211±12, 244±16, and 254±14 nm, respectively (Fig. 5, upper panel). The zeta potentials of these PECs were in the range of −31 to −38 mV, with no significant difference found among the unloaded and VEGF-loaded PECs, nor among the PECs prepared at different CS:DS ratios (Fig. 5 lower panel). These data show that an increase in the CS:DS ratio led to enhanced VEGF incorporation, as well as larger particle sizes. At a CS:DS ratio of 0.5:1, the particle size became approximately 1500 nm, which was too large to be used for in vivo delivery. PECs at this size were visibly unstable, precipitating quickly after the final suspension. Thus, a CS:DS ratio of 0.33:1 was chosen for the following studies.
Figure 4. VEGF entrapment efficiencies at various CS:DS ratios.
VEGF PECs were prepared in reaction mixtures containing 0.04 mg VEGF, 1 mg DS, and 0.2, 0.25, 0.33, or 0.5 mg CS. The amounts of VEGF in the PECs were determined by SDS PAGE and densitometry analysis. The upper panel shows a representative SDS gel loaded with VEGF standards at the indicated quantities (left 5 lanes) and aliquots of VEGF PEC suspensions prepared at the indicated CS:DS ratios (right 8 lanes). The lower panel shows VEGF entrapment efficiencies in these PEC preparations. Entrapment efficiency was calculated by comparing the amount of incorporated VEGF with that added to the reaction mixture. Data are presented as mean ± SD, n = 4–7, * p < 0.05 compared to the rest of the groups.
Figure 5. Sizes and zeta potentials of VEGF-loaded and unloaded PECs.
Unloaded PECs were prepared in reaction mixtures containing 1 mg DS and 0.2, 0.25, 0.33, or 0.5 mg CS (open bars). VEGF-loaded PECs were prepared with additional 0.04 mg VEGF (solid bars). The particle sizes (upper panel) and zeta potentials (lower panel) of the prepared PECs were determined. Data are presented as mean ± SD from three preparations.
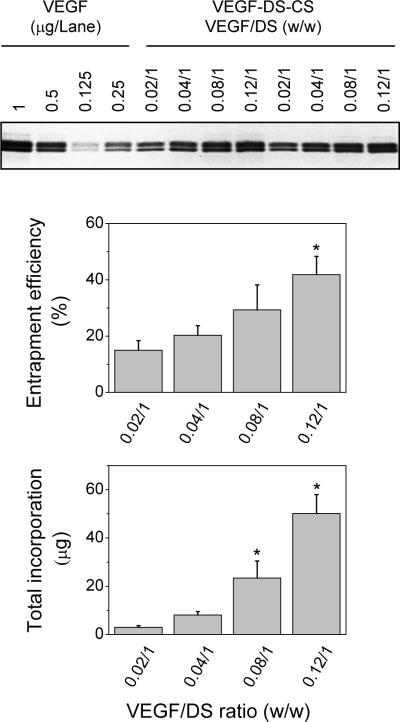
We next examined the effect of the VEGF:DS ratio on entrapment efficiency. In this study, 1 mg DS was mixed with 0.02, 0.04, 0.08, or 0.12 mg VEGF, and then with 0.33 mg CS. Aliquots of the resulting PEC suspensions, in volumes inversely proportional to their VEGF/DS ratios, were loaded onto SDS gels, and the amounts of incorporated VEGF were determined by densitometry. As shown in Figure 6, the VEGF entrapment efficiency increased with increasing VEGF:DS ratios. At ratios of 0.02:1, 0.04:1, 0.08:1, and 0.12:1, the entrapment efficiency was 15±3%, 18±2%, 27±12%, and 41±11%, respectively. Combining the entrapment efficiency with the amount of VEGF added to the reaction mixture, the total incorporated VEGF in the PECs was 3±0.6, 7±0.9, 22±10, and 49±13 μg, respectively. The sizes of these PECs were 477.2±7.9, 490±14.5, 528.0±17.0, and 612.3±79.4 nm, respectively (Table 1). Loading particles with VEGF had negligible effect on their overall zeta potential (−29.6 to −33.3 mV). These data show that optimal incorporation of VEGF in the CS-DS PECs was achieved at the VEGF:DS:CS ratio of 0.12:1:0.33. This formulation was used in the following in vitro and in vivo studies.
Figure 6. Incorporation of VEGF at various VEGF:DS ratios.
VEGF PECs were prepared in reaction mixtures containing 1 mg DS, 0.33 mg CS, and 0.02, 0.04, 0.08, or 0.12 mg VEGF. The amounts of VEGF in the PECs were quantified by SDS PAGE and densitometry analysis. The upper panel shows a representative SDS gel loaded with VEGF standards (lane 1–4) and aliquots of VEGF-DS-CS PEC suspensions in a volume inversely proportional to the indicated VEGF/DS ratio. The middle and lower panels show entrapment efficiency and total incorporation of VEGF in the PECs prepared at the indicated ratio. Data are presented as mean ± SD, n = 4–7, * p < 0.05 compared to the rest of the groups.
Table 1.
Particle sizes and zeta potentials of VEGF-loaded PECs prepared at various VEGF:DS ratios
| Ratio of CS:DS | Ratio of VEGF:DS | Particle size | Polydispersity index | Zeta potential |
|---|---|---|---|---|
| (w/w) | (w/w) | (nm) | (mV) | |
| 0.33 : 1 | 0.02 : 1 | 477.2 ± 7.9 | 0.103 ± 0.043 | −33.3 ± 1.7 |
| 0.33 : 1 | 0.04 : 1 | 490.0 ± 14.5 | 0.102 ± 0.014 | −29.6 ± 1.6 |
| 0.33 : 1 | 0.08 : 1 | 528.0 ± 17.0 | 0.150 ± 0.015 | −32.0 ± 1.3 |
| 0.33 : 1 | 0.12 : 1 | 612.3 ± 79.4 | 0.281 ± 0.110 | −30.9 ± 1.3 |
In vitro release
The time course of VEGF release from the VEGF PECs was studied in Release Buffer containing 2.5% mannitol and 50% D-PBS without magnesium and calcium. Using a solution of 50% D-PBS instead of a full strength D-PBS solution was because the PECs collapsed and aggregated quickly in 100% D-PBS. Reducing D-PBS to 50% and eliminating calcium and magnesium in the solution avoided the problem. The Release Buffer-suspended VEGF PECs were divided into small aliquots, and then rotated at 37°C for 0, 1, 3, 6, 18, 30, or 48 hrs. After the incubation, the samples were centrifuged immediately to separate the released VEGF (supernatant) from the VEGF PECs (pellet). The VEGF contents in these phases were analyzed by SDS PAGE. As shown in Figure 7, at the 0 hr time point, 8±4 % VEGF was detected in the supernatant and 92±4 % in the pellet, indicating that the VEGF release occurred instantaneously when the PECs were suspended in the Release Buffer. During the 37°C incubation, 44% of the incorporated VEGF was released in the first hour and 29% was released in the next 47 hours, with 23% VEGF remaining entrapped in the PECs at 48 hr. Thus, in vitro release of VEGF from the VEGF PECs followed a biphasic time course, with rapid release initially followed by slow release. The two kinetic processes may reflect different interactions of VEGF in the DC-CS PECs (see discussion).
Figure 7. In vitro VEGF release time course.
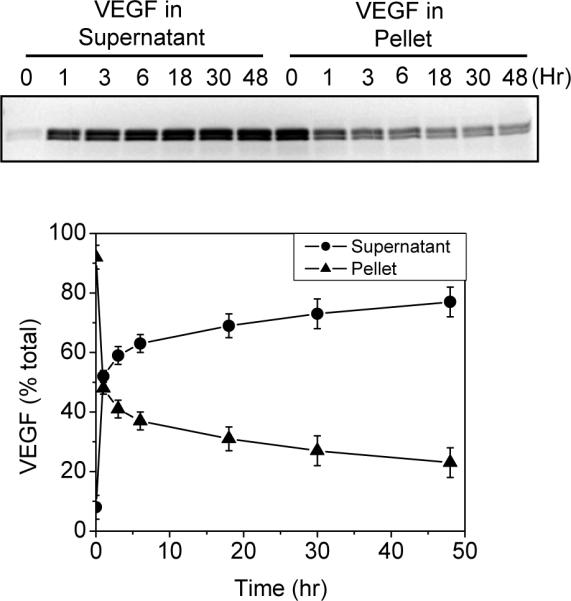
VEGF PECs were prepared at a VEGF/DS/CS ratio of 0.12/1/0.33. The PECs were diluted in Release Buffer, divided into small aliquots, and placed on a rotating mixer at 37°C. At the specified time point, aliquots were removed from the incubation and immediately centrifuged to separate the released VEGF (supernatant) and the PEC VEGF (pellet). The VEGF in these samples was determined by SDS PAGE and densitometry analysis. The upper panel shows a representative SDS gel loaded with supernatants and pellets of the samples collected at the indicated incubation time. The lower panel shows the percentage of VEGF in the supernatant (circle) or the pellet (triangle) at each incubation time point. Data are presented as mean ± standard deviation of four sets of samples from two experiments.
Distribution of aerosolized solution
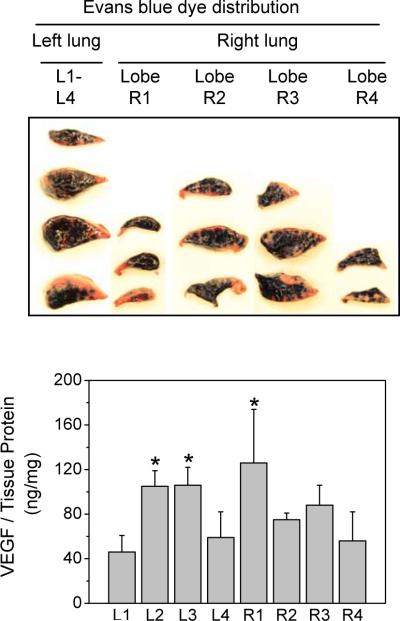
VEGF was delivered to the lungs using a needle-shaped aerosolizer that was advanced to the end of the trachea to release the aerosol above the bifurcation point. The distribution of the aerosolized solution in the lungs was examined by delivery of two solutions, Evans blue dye and VEGF; both were dissolved in Release Buffer. In the Evans blue dye study, the distribution of blue color in various segments of lungs was inspected. As shown in Figure 8, upper panel, the aerosolized dye reached all lobes and segments in the lung. The middle segments of the left lung, L2 and L3, had more blue dye than the upper and lower segments, indicating a central to peripheral distribution gradient of the delivered solution. In the VEGF delivery study, the lung tissues were divided into four segments/lobes on each side of the lung after harvesting. The amounts of VEGF in these segments were quantified by ELISA. As shown in Figure 8, lower panel, the concentration of VEGF in the middle segments of the left lung (L2 and L3) was approximately twice as high as that in the upper and lower segments of the lung, consistent with that found in the Evans blue dye delivery. In the right lung, however, lobe 1 had the highest VEGF concentration, followed by the R3, R2, and R4 lobes. These data show that the aerosol-delivered solution reached all parts of lungs, but the distribution followed a central to peripheral gradient pattern. For the retention time study next described, whole lung tissue from all segments or lobes was homogenized together to minimize the effects of segmental variance in distribution.
Figure 8. Distribution of aerosolized solutions in the lung.
Evans blue dye (final concentration 0.5%) or VEGF (0.02 mg) was dissolved in 0.23 ml Release Buffer and aerosolized into the lungs of rats weighing 215–240 g. Lung tissues were harvested immediately, and dissected into lobes (one in the left lung and four in the right lung). For visual inspection of the Evans blue dye distribution, each lobe was divided into 2–4 segments. Photographs were taken thereafter (upper panel). For VEGF distribution analysis, supernatants from tissue homogenates were prepared in the 4 segments from the left lung (L1–L4) and the 4 lobes of the right lung (R1–R4). VEGF was quantified by ELISA and normalized to total protein in the homogenate supernatant. Data are presented as mean ± SD, n = 3, * p < 0.05 compared to L1.
In vivo retention time
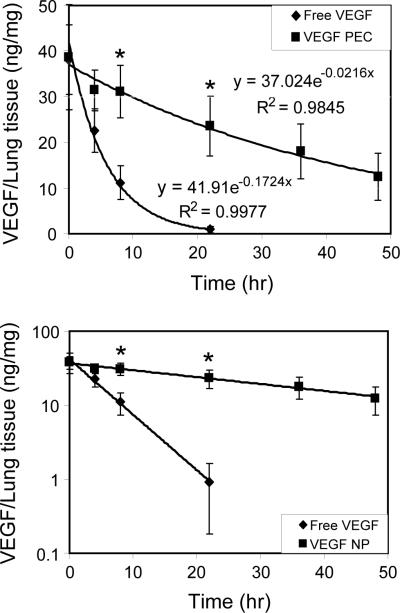
To determine the retention time of VEGF in the lung, 9 μg VEGF in free form or incorporated in PECs was dissolved/suspended in Release Buffer and aerosolized into the lungs of rats. Lung tissue was harvested 0, 1, 3, 8, 22, 36, and 48 hrs after the delivery. Supernatants of tissue homogenates were prepared, and the VEGF content determined using ELISA. Lung tissue from animals given aerosolized Release Buffer alone or unloaded CS-DS PECs were used as sample control blanks in the ELISA analysis. Figure 9 shows the change in concentration of VEGF in the lungs after the aerosol delivery. As demonstrated, the decrease of VEGF concentration was significantly faster in the lungs from the animals treated with free VEGF compared with VEGF PECs. At the 22 hr time point, nearly all VEGF was cleared in the lungs that were treated with free VEGF, but more than half remained in those treated with VEGF PECs. Linear regression curve fitting analysis showed that the concentration change of VEGF in both forms of VEGF followed an exponential decay pattern. The derived equation for the free VEGF-treated lungs was y = 41.9e−0.1724x (R2 = 0.9974) and that for the VEGF PECs-treated lungs was y = 37.02e−0.0216x (R2 = 0.9845). In these equations, y is the concentration of VEGF in lung tissue and x is the time (hr) after delivery. From the decay constants obtained from these equations, the calculated half-life, mean life, and 90% lifetimes in free-VEGF-treated lungs were 4, 5.8, and 13.4 hrs, respectively; and that in VEGF PECs-treated lungs were 32, 46.3, and 106.6 hrs, respectively (Table 2). Thus, the retention time of VEGF in the VEGF PECs-treated lungs was approximately 8 times as long as that of the free VEGF-treated lungs.
Figure 9. VEGF retention time in the lung.
Nine micrograms VEGF in free form (diamond) or incorporated in PECs (square) were dissolved/suspended in Release Buffer and aerosolized into the lungs of rats. Lung tissues were harvested at the indicated time points and supernatants of tissue homogenates were prepared. VEGF was quantified by ELISA and normalized to total protein in the homogenate supernatant. Top panel, linear scale plotting of the data; low panel, semi-log scale plotting. Data are presented as mean ± SD, n = 4–8, * p < 0.05 compare to the free VEGF-delivered group at the same time point.
Table 2.
VEGF retention time in the lung1
| VEGF Delivery form | Decay constant2 | Half-life3 (hr) | Mean lifetime3 (hr) | 90% lifetime3 (hr) |
|---|---|---|---|---|
| Free | 0.1724 | 4 | 6 | 13 |
| DS-CS PECs | 0.0216 | 32 | 46 | 106 |
Calculated from equations derived from Figure 9.
In the exponential decay equation, dC/dt = −λC, λ is referred to as decay constant. Integration of this equation gives lnCt = −λt + a, or Ct = e−λtea. At time 0, C0 = ea. Thus, Ct = C0e−λt. Comparing this equation with those in Figure 9, the decay constants were obtained.
The half-life, mean lifetime, and 90% lifetime were calculated as Ct/C0 = 0.5/1, Ct/C0 = 0.368/1, and Ct/C0 = 0.1/1, respectively.
In vitro and ex vivo activity of VEGF PECs
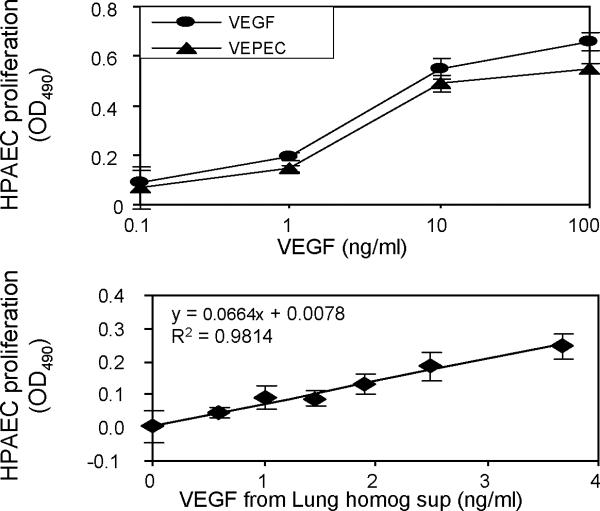
To determine whether VEGF remained active after forming VEGF-DS-CS complexes, VEGF PECs were prepared, serially diluted, and used in a human pulmonary artery endothelial cell proliferation assay. As shown in Figure 10, top panel, VEGF PECs had a similar dose-dependent activity as that found for free VEGF, indicating that the PEC preparation procedure did not affect the activity of the growth factor. This result is consistent with that previously reported by Huang and colleagues16.
Figure 10. In vitro and ex vivo activity of VEGF PECs.
Human pulmonary artery endothelial cell (HPAEC) proliferation assays were used to assess VEGF activities in freshly prepared VEGF PECs or in supernatants from tissue homogenates prepared from VEGF PEC-treated rat lungs. The top panel shows the dose-dependent activity of VEGF PECs (triangles) in comparison to that of free VEGF (circles). The lower panel shows the correlation between activities and concentrations of VEGF in empty PEC- (first data point) and VEGF PEC-treated rat lung homogenate supernatants (homog sup). OD490 readings in untreated HPAEC wells (sample blank) were subtracted from all sample well readings on the same assay plate. Data are presented as mean ± SD of triplicate loading of samples in the top panel and quadruplicate loading of samples in the lower panel.
To verify that VEGF PECs retained VEGF activity after being aerosolized into the rat lung but before being cleared from the tissue, part of the supernatant from lung homogenate samples obtained from the above-described retention time study were analyzed for their endothelial cell proliferating activity. Lung tissue treated with an empty PEC was used as the activity control (VEGF concentration = 0 ng/ml) to determine whether the homogenate supernatant itself can cause endothelial cell proliferation. As shown in Figure 10, lower panel, the supernatants of lung tissue homogenate exerted various endothelial cell proliferating activities, which were correlated with the VEGF concentrations in these samples as determined by ELISA. The detection of the activities at <10 ng/ml VEGF concentration range suggested that the PEC-delivered VEGF was fully active in lung tissue before its clearance.
Inflammatory response analyses
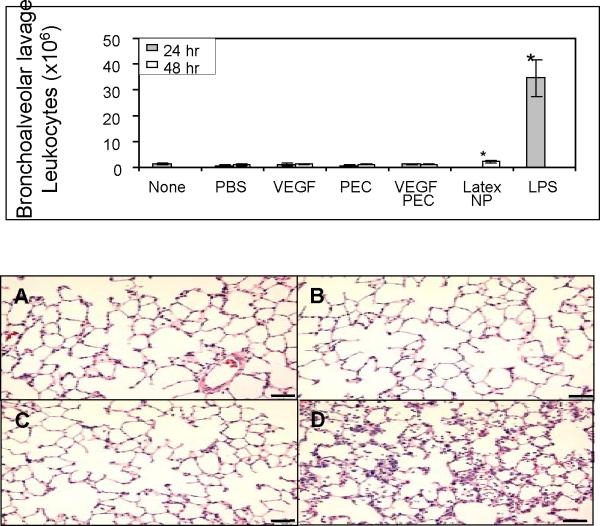
To examine inflammatory responses in rat lungs treated with VEGF PECs, bronchoalveolar lavage (BAL) and lung tissue histology analyses were preformed. As shown in Figure 11, upper panel, no significant differences in leukocyte counts in the BAL fluids were found among the samples obtained from rats receiving no treatment, PBS, empty PEC, VEGF (9 μg), or VEGF PEC (containing 9 μg VEGF). To confirm that the BAL method used in this study was valid, fluorescein-conjugated latex nanoparticles (200 nm) and lipopolysaccharide (LPS) were delivered to rats by intratracheal aerosolization and instillation, respectively. As shown in the figure, the latex nanoparticle-treated lungs gave slightly higher, although statistically significant, leukocyte counts than VEGF PEC or PEC-treated lungs, while the LPS-treated lungs exhibit a ~ 35-fold higher leukocyte counts. Histological analysis found no significant leukocyte infiltration in the PBS, empty PEC, or VEGF PEC treated lungs (Figure 11, lower panel). VEGF can also increase vascular permeability and thereby cause pulmonary edema and leukocyte infiltration at high doses. The dose of VEGF used in this study did not cause pulmonary edema (data not shown).
Figure 11. Inflammatory response analyses of VEGF PEC-delivered lungs.
Top panel, bronchoalveolar lavage (BAL) analysis. Rats received no treatment (none), or aerosolization of PBS, empty PEC, VEGF (9 μg) VEGF PEC (containing 9 μg VEGF), or fluorescein-conjugated latex nanoparticles (200 nm, 0.3 mg), or intratracheal instillation of LPS (0.15 mg). BALs were performed at 24 or 48 hrs after the treatment, and total leukocyte numbers in the BAL fluids were counted. Data are presented as mean ± SD from 3 rats in each group. * p < 0.05 compare to the rest of the groups. Lower panel, photomicrographs of hematoxylin and eosin-stained lung tissue paraffin sections prepared from rats treated with intratracheal delivery of: A) PBS, B) empty PECs, C) VEGF PECs, and D) LPS. Bar = 50 μm.
Discussion
This study examined the formulation of VEGF-DS-CS PECs in order to incorporate VEGF optimally in the PECs for efficient, sustained intrapulmonary delivery. From the screening of various combinations of DS and CS molecules, the DS at an average MW of 500 kDa and the CS at a MW range of 50–190 kDa were chosen for this study. The weight ratios among CS:DS and VEGF: DS were examined; and the optimal ratio of VEGF:DS:CS was found to be 0.12:1:0.33 due to the entrapment efficiency and the effects on the physical characteristics. At this ratio, approximately 0.05 mg VEGF was incorporated in the PECs when starting with 1 mg DS; and the particle size and zeta potential of the resulting VEGF PECs were 612±79 nm and −31±1 mV, respectively. In vitro release study showed that the VEGF release from the PECs followed a biphasic time course. In vivo clearance of the VEGF PECs, however, was found to follow an exponential decay, or a first order clearance reaction. The decay constant of VEGF in the VEGF PECs-treated lungs was 1/8 of that in the free VEGF-delivered lungs (0.0216/0.1724), indicating an 8-fold extension of the lifetime of VEGF in the lung by the PEC formulation.
In vitro biphasic release and in vivo constant decay
In vitro, the time course for release of VEGF from PECs was biphasic. (Fig.7). Approximately 50% of the incorporated VEGF was released within an hour of incubation, while 23% VEGF remained entrapped in PECs after 2 days incubation. In vivo clearance of VEGF from VEGF PECs, however, occurred at a constant rate (Fig. 9). We speculate that this pseudo-first order clearance was related to glycosaminoglycan-binding of VEGF.
The VEGF used in this study, VEGF165, is a basic protein with a calculated isoelectric point of 7.9. The C-terminal sequence of VEGF165 (encoded by exon 7 of VEGFA gene) accounts for its basicity, and allows VEGF to bind strongly to sulfated, negatively charged heparin, heparan sulfate, and other glycosaminoglycans in the extracellular matrix4, 22. This binding property distinguishes VEGF165 from its splicing isomer VEGF121, which lacks the exon 7-encoded sequence and is a freely diffusible acidic protein. VEGF165 is also different from VEGF189 and VEGF206, which have an additional basic sequence encoded in exon 6, and are, therefore, more basic, and completely sequestered by the extracellular matrix. The heparin binding allows VEGF to be efficiently purified on Heparin Sepharose and sulfated cation exchange (Resource S) columns. In these purifications, the bound VEGF requires 0.7 M and 0.3 M NaCl, respectively, for column elution.
Dextran sulfate is a heavily sulfated polysaccharide that shares some structural similarity with heparin and heparan sulfate. Thus, VEGF incorporated in the DS-CS PECs was likely bound, in part, to dextran sulfate through ionic interaction. This fraction of entrapped VEGF would likely be slow to release in Release Buffer, which contained 50% D-PBS, or even in physiological salt solution, which has an ionic strength equivalent to 0.15 M NaCl.
Incorporated VEGF was also likely trapped by the DC-CS PECs by weak hydrogen bonds or van der Waals forces. This interaction may explain the observation that the entrapment efficiency of VEGF was greater when more VEGF or a higher VEGF:DS ratio was used in the PEC preparation (Fig. 6). The trapped VEGF would be released quickly when the PECs were suspended in Release Buffer. The two types of interactions of VEGF with the DS-CS PECs would explain the biphasic time course for release observed in vitro.
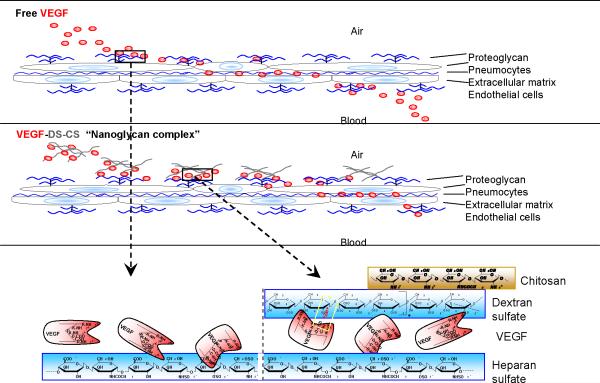
In an in vivo situation, the aerosolized VEGF PECs would likely settle on the surfaces of lung epithelial cells. The PECs would collapse in an environment with physiological ionic strength, and the trapped VEGF quickly released. The released VEGF molecules, however, would, in turn, bind to heparan sulfate or other negatively charged glycosaminoglycans on cell surfaces and in the extracellular matrix. A binding equilibrium would be reached between the glycosaminoglycan-bound VEGF and the DS-bound VEGF molecules. The clearance of this pool of VEGF would manifest pseudo-first order clearance, but at a rate slower than “free” VEGF bound only to the glycosaminoglycans. This proposed mechanism is depicted in Figure 12.
Figure 12. Proposed mechanism.
Upper panel, when aerosolized in free form, VEGF molecules (red dots) first settle on pulmonary epithelial cells and bind to glycosaminoglycans (blue lines) on the cell surface and in the extracellular matrix. The molecules then gradually diffuse through the adjacent endothelial cell layer and into the circulating blood. Lower panel, after delivery, VEGF PECs settle on the surface of pulmonary epithelial cells and structurally collapse. Some of the incorporated VEGF molecules are instantaneously released, which then bind to the glycosaminoglycan pool in the glycocalyx and matrix. Some VEGF remains associated with the dextran sulfate (gray lines) in the PECs. The binding of VEGF between the endogenous glycosaminoglycans pool and dextran sulfate equilibrates, which leads to a slow but continuous release process governed by the dissociation rate and diffusion constraints.
Application
DS-CS PECs are prepared in aqueous solutions, and it is a highly scalable process. Small volumes of the complex can be produced in the one milliliter range. The flexible preparation scale and aqueous preparation environment are valuable features for protein nanoparticle research, since the biological activities of the incorporated proteins are the major concern, and the availability of purified protein factors are usually limited to small quantities. The aqueous protein complex formulation is also advantageous in that minimal amounts of excipient molecules are required for the preparation, which is, by contrast, largely required for dry powder formulation and delivery approaches. In addition to these advantages, nanoglycan delivery of growth factors yields predictable concentrations of growth factor to a fixed period of time, which contrasts significantly with direct cDNA delivery or adenoviral delivery of a growth factor cDNA.
Based on the mechanism discussed above, the DS-CS PECs may be suitable for delivery of other protein factors if they also have binding affinities to heparin, heparan sulfate, or other glycosaminoglycans. When examining the list of potential protein factors that are known to play important roles in stem cell recruitment, lung development, and blood vessel maturation, we find that a number of them are also avid heparin-binding proteins. These include stromal cell-derived factor-1 (SDF-1)23–25, fibroblast growth factor-10 (FGF-10)26, 27, BMP-2 and BMP-428, 29, hepatic growth factor (HGF)30, 31, and heparin-binding epidermal growth factor-like growth factor (HB-EGF)32. For other proteins that do not have affinity for heparin, the DS-CS PEC formulation developed in this study may not be suitable for their delivery for sustained retention purpose.
“Nanoglycan complex”
Dextran sulfate and chitosan are charged polysaccharides, or glycans. The VEGF-DS-CS complex investigated in this study is a soft nanoparticle, which collapses in physiological solution and is advantageous for lung delivery to evade immune phagocytosis. Considering that the DS-CS complex is particularly useful for delivery of glycosaminoglycan-binding growth factors to the lung for sustained retention, this type of complex is, perhaps, better described as a nanoglycan complex owing to its unique properties and application.
Conclusion
In order to establish an extended VEGF signal in the lung for stem cell recruitment, this study optimized a method for incorporating VEGF in DS-CS nanoglycan complexes. The complex formulation extended the VEGF retention time in the lungs of rats by 8-fold, and preserved VEGF activity in both in vitro and in vivo environments. No significant inflammatory or edematous response was found in the VEGF nanoglycan-treated lungs, indicating that the delivery of the complex is advantageous in extending VEGF's beneficial growth promoting effects in the lung while avoiding adverse effects of higher concentrations of the growth factor.
Acknowledgement
This study was supported by NIH grants HL61795, HL08157, HL70819, HL89734, and by Harvard University Science and Engineering Committee Seed Fund for Interdisciplinary Science (HESEC-HSFIS). The authors are grateful to the excellent secretarial assistance provided by Stephanie Tribuna, and the stimulating discussion provided by Dr. Herve Hillaireau.
References
- 1.Weiss DJ, Kolls JK, Ortiz LA, Panoskaltsis-Mortari A, Prockop DJ. Proc Am Thorac Soc. 2008;5(5):637–67. doi: 10.1513/pats.200804-037DW. [DOI] [PMC free article] [PubMed] [Google Scholar]
- 2.Loi R, Beckett T, Goncz KK, Suratt BT, Weiss DJ. Am J Respir Crit Care Med. 2006;173(2):171–9. doi: 10.1164/rccm.200502-309OC. [DOI] [PMC free article] [PubMed] [Google Scholar]
- 3.Sueblinvong V, Loi R, Eisenhauer PL, Bernstein IM, Suratt BT, Spees JL, Weiss DJ. Am J Respir Crit Care Med. 2008;177(7):701–11. doi: 10.1164/rccm.200706-859OC. [DOI] [PMC free article] [PubMed] [Google Scholar]
- 4.Ferrara N, Gerber HP, LeCouter J. Nat Med. 2003;9(6):669–76. doi: 10.1038/nm0603-669. [DOI] [PubMed] [Google Scholar]
- 5.Dor Y, Porat R, Keshet E. Am J Physiol Cell Physiol. 2001;280(6):C1367–74. doi: 10.1152/ajpcell.2001.280.6.C1367. [DOI] [PubMed] [Google Scholar]
- 6.Grunewald M, Avraham I, Dor Y, Bachar-Lustig E, Itin A, Jung S, Chimenti S, Landsman L, Abramovitch R, Keshet E. Cell. 2006;124(1):175–89. doi: 10.1016/j.cell.2005.10.036. [DOI] [PubMed] [Google Scholar]
- 7.Rafii S, Heissig B, Hattori K. Gene Ther. 2002;9(10):631–41. doi: 10.1038/sj.gt.3301723. [DOI] [PubMed] [Google Scholar]
- 8.Thebaud B, Abman SH. Am J Respir Crit Care Med. 2007;175(10):978–85. doi: 10.1164/rccm.200611-1660PP. [DOI] [PMC free article] [PubMed] [Google Scholar]
- 9.Jakkula M, Le Cras TD, Gebb S, Hirth KP, Tuder RM, Voelkel NF, Abman SH. Am J Physiol Lung Cell Mol Physiol. 2000;279(3):L600–7. doi: 10.1152/ajplung.2000.279.3.L600. [DOI] [PubMed] [Google Scholar]
- 10.Kasahara Y, Tuder RM, Taraseviciene-Stewart L, Le Cras TD, Abman S, Hirth PK, Waltenberger J, Voelkel NF. J Clin Invest. 2000;106(11):1311–9. doi: 10.1172/JCI10259. [DOI] [PMC free article] [PubMed] [Google Scholar]
- 11.Yamamoto H, Yun EJ, Gerber HP, Ferrara N, Whitsett JA, Vu TH. Dev Biol. 2007;308(1):44–53. doi: 10.1016/j.ydbio.2007.04.042. [DOI] [PubMed] [Google Scholar]
- 12.Takahashi H, Shibuya M. Clin Sci (Lond) 2005;109(3):227–41. doi: 10.1042/CS20040370. [DOI] [PubMed] [Google Scholar]
- 13.Peters MC, Isenberg BC, Rowley JA, Mooney DJ. J Biomater Sci Polym Ed. 1998;9(12):1267–78. doi: 10.1163/156856298x00389. [DOI] [PubMed] [Google Scholar]
- 14.Cleland JL, Duenas ET, Park A, Daugherty A, Kahn J, Kowalski J, Cuthbertson A. J Control Release. 2001;72(1–3):13–24. doi: 10.1016/s0168-3659(01)00258-9. [DOI] [PubMed] [Google Scholar]
- 15.Chung YI, Tae G, Hong Yuk S. Biomaterials. 2006;27(12):2621–6. doi: 10.1016/j.biomaterials.2005.11.043. [DOI] [PubMed] [Google Scholar]
- 16.Huang M, Vitharana SN, Peek LJ, Coop T, Berkland C. Biomacromolecules. 2007;8(5):1607–14. doi: 10.1021/bm061211k. [DOI] [PubMed] [Google Scholar]
- 17.Lee GY, Jung WW, Kang CS, Bang IS. Protein Expr Purif. 2006;46(2):503–9. doi: 10.1016/j.pep.2005.09.023. [DOI] [PubMed] [Google Scholar]
- 18.Jones JE, Walker JL, Song Y, Weiss N, Cardoso WV, Tuder RM, Loscalzo J, Zhang YY. Am J Physiol Heart Circ Physiol. 2004;286(5):H1775–84. doi: 10.1152/ajpheart.00281.2003. [DOI] [PubMed] [Google Scholar]
- 19.Schatz C, Domard A, Viton C, Pichot C, Delair T. Biomacromolecules. 2004;5(5):1882–92. doi: 10.1021/bm049786+. [DOI] [PubMed] [Google Scholar]
- 20.Zeerleder S, Mauron T, Lammle B, Wuillemin WA. Thromb Res. 2002;105(5):441–6. doi: 10.1016/s0049-3848(02)00041-5. [DOI] [PubMed] [Google Scholar]
- 21.Hamoir J, Nemmar A, Halloy D, Wirth D, Vincke G, Vanderplasschen A, Nemery B, Gustin P. Toxicol Appl Pharmacol. 2003;190(3):278–85. doi: 10.1016/s0041-008x(03)00192-3. [DOI] [PubMed] [Google Scholar]
- 22.Krilleke D, Ng YS, Shima DT. Biochem Soc Trans. 2009;37(Pt 6):1201–6. doi: 10.1042/BST0371201. [DOI] [PubMed] [Google Scholar]
- 23.Murphy JW, Cho Y, Sachpatzidis A, Fan C, Hodsdon ME, Lolis E. J Biol Chem. 2007;282(13):10018–27. doi: 10.1074/jbc.M608796200. [DOI] [PMC free article] [PubMed] [Google Scholar]
- 24.Sadir R, Baleux F, Grosdidier A, Imberty A, Lortat-Jacob H. J Biol Chem. 2001;276(11):8288–96. doi: 10.1074/jbc.M008110200. [DOI] [PubMed] [Google Scholar]
- 25.Sweeney EA, Papayannopoulou T. Ann N Y Acad Sci. 2001;938:48–52. doi: 10.1111/j.1749-6632.2001.tb03573.x. discussion 52–3. [DOI] [PubMed] [Google Scholar]
- 26.Igarashi M, Finch PW, Aaronson SA. J Biol Chem. 1998;273(21):13230–5. doi: 10.1074/jbc.273.21.13230. [DOI] [PubMed] [Google Scholar]
- 27.Izvolsky KI, Zhong L, Wei L, Yu Q, Nugent MA, Cardoso WV. Am J Physiol Lung Cell Mol Physiol. 2003;285(4):L838–46. doi: 10.1152/ajplung.00081.2003. [DOI] [PubMed] [Google Scholar]
- 28.Ohkawara B, Iemura S, ten Dijke P, Ueno N. Curr Biol. 2002;12(3):205–9. doi: 10.1016/s0960-9822(01)00684-4. [DOI] [PubMed] [Google Scholar]
- 29.Ruppert R, Hoffmann E, Sebald W. Eur J Biochem. 1996;237(1):295–302. doi: 10.1111/j.1432-1033.1996.0295n.x. [DOI] [PubMed] [Google Scholar]
- 30.Sakata H, Stahl SJ, Taylor WG, Rosenberg JM, Sakaguchi K, Wingfield PT, Rubin JS. J Biol Chem. 1997;272(14):9457–63. doi: 10.1074/jbc.272.14.9457. [DOI] [PubMed] [Google Scholar]
- 31.Zhou H, Casas-Finet JR, Heath Coats R, Kaufman JD, Stahl SJ, Wingfield PT, Rubin JS, Bottaro DP, Byrd RA. Biochemistry. 1999;38(45):14793–802. doi: 10.1021/bi9908641. [DOI] [PubMed] [Google Scholar]
- 32.Nishi E, Klagsbrun M. Growth Factors. 2004;22(4):253–60. doi: 10.1080/08977190400008448. [DOI] [PubMed] [Google Scholar]


