Abstract
We develop and investigate numerically a thermodynamically consistent model of two-dimensional multicomponent vesicles in an incompressible viscous fluid. The model is derived using an energy variation approach that accounts for different lipid surface phases, the excess energy (line energy) associated with surface phase domain boundaries, bending energy, spontaneous curvature, local inextensibility and fluid flow via the Stokes equations. The equations are high-order (fourth order) nonlinear and nonlocal due to incompressibil-ity of the fluid and the local inextensibility of the vesicle membrane. To solve the equations numerically, we develop a nonstiff, pseudo-spectral boundary integral method that relies on an analysis of the equations at small scales. The algorithm is closely related to that developed very recently by Veerapaneni et al. [81] for homogeneous vesicles although we use a different and more efficient time stepping algorithm and a reformulation of the inextensibility equation. We present simulations of multicomponent vesicles in an initially quiescent fluid and investigate the effect of varying the average surface concentration of an initially unstable mixture of lipid phases. The phases then redistribute and alter the morphology of the vesicle and its dynamics. When an applied shear is introduced, an initially elliptical vesicle tank-treads and attains a steady shape and surface phase distribution. A sufficiently elongated vesicle tumbles and the presence of different surface phases with different bending stiffnesses and spontaneous curvatures yields a complex evolution of the vesicle morphology as the vesicle bends in regions where the bending stiffness and spontaneous curvature are small.
Keywords: Multicomponent vesicle, Ordered and disordered lipid phases, Rafts, Line tension, Bending stiffness, Inextensibility, Boundary integral method, Small scale decomposition, Stokes flow
1. Introduction
Biological membranes play an active and critical role in cell functions such as solute transport, cell locomotion, adhesion, signal transduction, etc. (e.g. see [1]). In addition, cells frequently use small membrane-bound carriers (vesicles) to transport proteins and molecules. The basic structural component of all biological membranes are lipid bilayers. Multicomponent vesicles are hollow, closed biomembranes with a lipid bilayer membrane containing different types of lipids and cholesterol. Vesicles serve as important, but simplified models of more complex cell-membranes [67]. Vesicle membranes are liquid-like, resist bending and are inextensible, e.g. [51,67]. Recent experiments on giant unilamellar vesicles demonstrate that there exists a rich variety of behavior of multicomponent vesicles. Spinodal decomposition into distinct surface domains (e.g. liquid-ordered, liquid-disordered) known as rafts (or domains), raft coarsening, viscous fingering, vesicle budding, fission and fusion are all observed with concomitant changes in membrane morphology. See, for example, [79,80,8,14,9,77, 18,22,84,68,5]. The resulting rafts may play an important role in regulating protein activity because of the existence of raft-resident proteins such as hemagglutinin which is an envelope protein of influenza [29].
While there have been many theoretical and numerical studies of homogeneous vesicles using discrete and continuum models (e.g. see the reviews [59,51,53,62,61]), the recent papers [16,17,15,12,11,10,35,36,42,6,81,72,63] (and the references therein), there are far fewer studies of inhomogeneous systems although there has been an increasing focus on the inhomo-geneous vesicles in the past 10 years.
Discrete approaches, such as Monte Carlo methods, dissipative particle dynamics and molecular dynamics, have been used to simulate the dynamics of phase separation and domain formation, vesicle fission and fusion (e.g. see [46,48,69,82,60,34,49,21,57,25,70,20]). However, the length and time scales achieved in such simulations are significantly limited by computational cost.
Continuum methods provide a good modeling alternative to reach larger length and time scales. Continuum models are also easier to analyze and parametrize. The continuum approach is based on the generalized bending energy proposed by Helfrich [28] supplemented by a line energy associated with surface phase domain boundaries (e.g. Lipowsky [52], Seifert [66] and Jülicher and Lipowsky [40,39]). Until recently, studies of multicomponent vesicles have been limited to equilibrium investigations (e.g. see [4,43,76,66,26,39,23,24,27,7,68,71]) or dynamical simulations limited to small deformations or special shapes (e.g. see [75,37,58,55,19]). Very recently, phase-field models developed for single-component vesicles (e.g. see [16,17,15,12,11,10,35,36,63]) have been extended to the multicomponent case [13,83,56]. In the phase-field approach, the vesicle membrane is given a finite thickness and the governing Helfrich equations are modeled with diffuse interface counterparts. While this approach is capable of simulating complex dynamics including vesicle adhesion, fusion and fission, the Helfrich equations are not solved directly and the local inextensibility constraints are typically replaced with global constraints or simplified approximations.
To our knowledge, there are no sharp interface models where the dynamics of multicomponent inextensible membranes in a viscous fluid are simulated directly. While the sharp interface approach cannot simulate vesicle fusion and fission without ad hoc cut-and-connect techniques, this method is valuable nevertheless because it provides highly accurate solutions that can be used to validate other more general approaches (e.g. phase-field) and the solutions provided by the sharp interface method are of intrinsic interest. In fact, there have been few studies using sharp interface models of inextensible homogeneous vesicles in a viscous fluid [44,85,74,81] because of the difficulties involved in solving the high-order nonlinear systems of equations. The stiffness introduced by bending forces posed a formidable challenge that was only recently overcome in two dimensions by Veerapaneni et al. [81] who developed a nonstiff algorithm by extracting dominant contributions to the equations at small spatial scales, following Hou et al. [30], Kropinski [45], Tornberg and Shelley [78] and Hou and Shi [32].
In this paper, we develop and investigate numerically a thermodynamically consistent model of two-dimensional multi-component vesicles in an incompressible viscous fluid. The model is derived using an energy variation approach that accounts for different surface phases, the excess energy (line energy) associated with surface phase domain boundaries, bending energy, spontaneous curvature, local inextensibility and fluid flow via the Stokes equations. The equations are high-order (fourth order) nonlinear and nonlocal due to incompressibility of the fluid and the local inextensibility of the vesicle membrane. To solve the equations numerically, we use a boundary integral representation of the fluid velocity and develop a nonstiff, pseudo-spectral boundary integral method to solve the coupled system that relies on an analysis of the equations at small scales. The algorithm is closely related to that developed very recently by Veerapaneni et al. [81] for homogeneous vesicles although we use a different and more efficient time stepping algorithm and a reformulation of the inextensibility equation. We present simulations of multicomponent vesicles in an initially quiescent fluid and investigate the effect of varying the average surface concentration of an initially unstable mixture of lipid phases. The phases then redistribute and alter the morphology of the vesicle and its dynamics. When an applied shear is introduced, an initially elliptical vesicle tank-treads and attains a steady shape and surface phase distribution. A sufficiently elongated vesicle tumbles and the presence of different surface phases with different bending stiffnesses and spontaneous curvatures yields a complex evolution of the vesicle morphology as the vesicle bends in regions where the bending stiffness and spontaneous curvature are small.
The rest of the paper is organized as follows: in Section 2, we present the boundary integral formulation of two-dimensional Stokes flow. In Section 3, the equations governing the dynamics of the inextensible, multicomponent vesicle and surface phases are derived. In Section 4, the numerical method is presented. Numerical results are given in Section 6. Conclusions are drawn and future work is discussed in Section 7.
2. Two-dimensional membrane
2.1. 2D model
Let X = X(s, t) = (x(s, t), y(s, t)) denote the position of a membrane bounding a vesicle as a function of arclength s and time t. The membrane evolution is given by
| (1) |
where V is the outward normal velocity, n is the outward normal vector, T is the tangential velocity and s is the tangent vector. The velocity is determined via the solution of the fluid flow equations. We introduce the following nondimensional variables:
where l is a characteristic length of the membrane and τ = v2l3/b̄ is the characteristic time, where v2 is the viscosity of the matrix fluid exterior to the vesicle and b̄ is a characteristic bending stiffness. We also introduce another parameter Δ known as the reduced surface area: Δ = L/R − 2π, where L is the surface area (total length in 2D) and R is the radius of the equivalent circle (circle with the same enclosed area as the vesicle). Note that Δ = 0 for a circle. This parameter has been used to classify vesicle shapes and in particular the transition to tumbling under an applied shear flow [41]. Hereafter, we drop the prime notation and present only the nondimensional equations.
Define the stress tensor
| (2) |
where pi is the pressure, with i = 1, 2 denoting the interior and exterior fluids, vi are the nondimensional viscosities (e.g. v2 = 1 and v1 is the viscosity ratio), Di is the deformation tensor and ui is the velocity.
We will assume that the length and velocity scales are small so that Stokes flow governs the motion of the fluid
| (3) |
where a velocity u = u∞ may be imposed in the far-field. Across the membrane, a stress jump condition holds [P · n]Σ ≡ (P · n)1 − (P · n)2 is given by
| (4) |
where the stress F is obtained from energy variation and thermodynamic consistency (see Section 3.4). The velocity is assumed to be continuous across the membrane:
| (5) |
In the remainder of the paper, we assume the viscosities of the fluids interior and exterior to the vesicle are matched: v1 = v2 = 1. An analysis of the effect of viscosity contrast is currently under study. Defining the stress componentwise to be F(s, t) = (f1,f2), the velocity u = (u1,u2) of the vesicle membrane is given by the boundary integral formulae (e.g. [61])
| (6) |
| (7) |
where r = |X(s) − X(s′)|, r1 = x(s) − x(s′), r2 = y(s) − y(s′) and u∞ = (u∞,1, u∞,2) is the far-field velocity. Next, we need to determine a constitutive relation for the stress F.
3. Governing equations
3.1. Mathematical preliminaries
Let α denote a parametrization of the membrane that bounds the vesicle (≤ α < 2π) and s = (xα,yα)/sα where . In the above, and in the remainder of the paper, subscripts denote partial derivatives. The outward normal vector is then n = (yα, − xα)/sα. Introducing the tangent angle θ = tan−1yα/xα, the tangent and normal vectors are s = (cosθ, sinθ) and n = (sinθ, − cosθ). Further, the total curvature is κ = ηα/sα = θs, where s is arclength. The Frenet formulas give ns = κs and ss = − κn. Using these relations, we may derive the following dynamical equations for the tangent angle θ, the arclength variation sα and the total curvature κ:
| (8) |
and
| (9) |
3.2. Energy variation
A thermodynamically consistent constitutive relation for the stress F is determined by requiring that the dynamics of the membrane decreases the total membrane free energy EM = Eb + ET. Here, Eb is the normal bending energy and ET is the excess (line) energy associated with the surface phase (e.g. ordered/disordered) domain boundaries. For isothermal systems (which we consider here) a decreasing free energy is equivalent to an increasing entropy since the free energy is the total energy minus the temperature times the entropy [47]. The energies are given as follows.
Let u be the concentration of one of the lipid phases (e.g. disordered phase). Then the normal bending energy is given by
| (10) |
, where b is the nondimensional normal bending stiffness, κ is the total curvature and κ̄ is the spontaneous curvature. The line energy ET is
| (11) |
, where f is a double-well potential, e.g , a is a nondimensional parameter (line tension scaled by a characteristic bending stiffness b̄), ▽Σ = (I - nn)▽ is the surface gradient, and ∊ is a nondimensional small scaling parameter where the scaling is chosen such that as ∊ → 0, ET converges to a finite constant times a. In 3D, this constant is proportional to the perimeter of the surface domain boundaries.
Next, we consider the variational derivatives of each energy. We do this by taking the time derivative which is equivalent to varying u and the membrane Σ simultaneously. Taking the time derivative of Eqs. (11), (10), using Eqs. (8), (9), integrating by parts and using periodicity (since Σ is assumed to be a closed curve) we get:
| (12) |
and
where the overdots denote time derivatives and the primes denote derivatives with respect to u. Combining Eqs. (12) and (13), and defining the variational derivatives,
| (13) |
| (14) |
we get
| (15) |
To make further progress, we need to consider mass conservation of the surface phases.
3.3. Mass conservation
In the absence of reactions or adsorption/desorption, the total amount of lipid phases should remain unchanged. This means that the mass
| (16) |
should be invariant in time, i.e. Ṁ = 0. Defining MΓ = ∫Γu ds then ṀΓ = J|Γ, where Γ is any portion of Σ,J is the mass flux and J|Γ is the net mass flux into Γ. Taking the time derivative, we get
| (17) |
Thus, local mass conservation implies that
| (18) |
where the mass flux J is determined below to ensure energy dissipation (thermodynamic consistency). Using Eq. (18) in Eq. (15) gives
| (19) |
.
3.4. Local inextensibility
Now we account for the local inextensibility of the membrane. That is, the membrane is not allowed to stretch. Consequently, the arclength parametrization should be time independent, sα(α, t) = sα(α,0), which implies
| (20) |
Note that an alternate form of Eq. (20) is s · us = 0. Following previous work, we pose this constraint via a Lagrange multiplier ΛLL(α, t). Hence, we append the membrane energy considered earlier with a null Lagrangian ELL, where
| (21) |
Note that ΛLL can also be interpreted as a tensile stress introduced to enforce inextensibility. Taking the time derivative, we get
| (22) |
Putting everything together, and assuming that ΛLL is chosen such that Ts = −κV, gives
| (23) |
Note that local inextensibility makes Eq. (18) become
| (24) |
.
3.5. Constitutive relations
We are now in a position to pose thermodynamically consistent constitutive relations for the flux J and the stress F. Assuming that each term in Eq. (23) is dissipative, we pose the following consitutive relations for the J and F:
| (25) |
where Pe is a nondimensional Peclet number, and
| (26) |
A calculation shows that the stress F can be written as
| (27) |
This gives the jump in normal stress:
| (28) |
which shows that the bending and surface phase evolution induce zero total force and torque on the system. With these choices, we obtain the dissipation formula:
| (29) |
where and D = (∇u + ∇uT).
3.6. The Lagrange multiplier ΛLL
To close the system of equations governing the membrane evolution, the local Lagrange multiplier ΛLL is chosen such that
| (30) |
, where u · s and u · n are the tangential and normal components of the Stokes velocity on the membrane and thus these velocity components are nonlocal linear functionals of ΛLL through the stress F. This system, which on the discrete level is nonsymmetric, can be solved using an iterative solver such as GMRES [65]. Each iteration requires a solution of the Stokes equations. An efficient preconditioner was recently developed by Veerapaneni et al. [81] using an analysis of the Stokes integral operators at small spatial scales (small scale decomposition). While we take that approach here (see Section 4), we further reformulate Eq. (30) to obtain an even more efficient solver.
On the membrane, we decompose the Stokes velocity u as
| (31) |
where v is a length conserving velocity field which is derived using a global Lagrange multiplier ΛGL that preserves the overall length of the membrane. The velocity v is easy to compute (no iteration is required) but suffers from the fact that it is not locally inextensible. Thus, the velocity ū is introduced to correct this. Numerically, we find that ū tends to be small which accelerates the convergence of the iterative solver. We now show how v is obtained.
To begin, we decompose the velocity v as
| (32) |
, where is the solution of the unconstrained Stokes equation:
| (33) |
and w = w1|Σ = w2|Σ satisfies
| (34) |
Further, ΛGL is chosen such that
| (35) |
so that the velocity field v is length conserving. Rewriting Eq. (35) using the decomposition of v from Eq. (32), we get
| (36) |
which implies that
| (37) |
To ensure local inextensibility, we use the correction ū which satisfies:
| (38) |
| (39) |
where Λ̃(α, t) = ΛLL(α, t) − ΛGL(t). To find Λ̃(α, t), we rewrite Eq. (30) as
| (40) |
Thus, Eqs. (38)-(40) comprise the linear nonlocal system for Λ̃(α, t) that now needs to be solved (e.g. by iteration). This is done using the small scale decomposition described in the next section, following [81]. While this system has a similar form as the original system, the reformulated system has the advantage that the only external forcing is due to the local stretching present in the length conserving velocity v through the right hand side of Eq. (40). This tends to reduce the number of iterations required to solve the system.
We remark that there exists at least one other inextensible velocity field. This is seen as follows. Since the mean of κv · n is equal to zero (by choice of ΛGL), it is possible to solve (v · s)s + κv · n = 0 by introducing an appropriate tangential velocity ζ. That is, replace Eq. (32) by
| (41) |
where ζ is chosen so that the velocity field v is actually locally inextensible:
| (42) |
Integrating this equation in s gives ζ. Although v is an inextensible velocity field, it is not generated by a single Lagrange multiplier. This is seen as follows. Given the velocity ζs, one may solve Eqs. (6) and (7) for the corresponding stress ; this is a system of first kind Fredholm equations.1 Doing this, one observes that fζ ≠ (βs)s for some β which would be required in order to have a single Lagrange multiplier description. Nevertheless the velocity in Eq. (41) may be used to reformulate the original system for ΛLL instead of the velocity in Eq. (32) but ultimately both approaches require solving Eq. (40).
4. Numerical method
4.1. The small scale decomposition
The small scale decomposition(SSD) extracts the dominant part of the equations at small spatial scales [30,31]. In the context of Stokes flows, this was first performed in [45] and later in [32] for immersed interface method and in [81] in the context of the dynamics of inextensible, homogeneous vesicles. Ref. [81] is most relevant to our work here although unlike [81] we follow [30] and use the SSD to develop an explicit, nonstiff time integration algorithm.
In Eqs. (6) and (7), the only singularity in the integrand comes from the logarithmic kernel. This can be analyzed as follows:
| (43) |
where the second term in Eq. (43) is smooth. For α ≈ α′, we have,
| (44) |
where O(α – α′) denotes a smooth function that vanishes as α′ → α [30]. Thus, is a smooth function.
Analyzing Eqs. (6) and (7) at small spatial scales, we obtain [45,32,81]:
| (45) |
where the notation f ~ g means that f – g is a smoothing operator, e.g. an integral operator with a smooth kernel. In addition, s̄α = sα is constant in space and time because of inextensibility.
Lemma
Let g(α) be a smooth function and define the integral operator
| (46) |
Then the symbol of ℒ is ℒ̂ = −1/|k|, where k is the Fourier wavenumber. Therefore, ℒ̂[g](k) = −ĝ(k)/|k|, for k ≠ 0. For k = 0, the symbol is equal to 0. The proof of this lemma can be found in [38,81], for example.
Next, consider the small scale decomposition of the normal V = u(α, t) · n(α, t) tangential T = u(α, t) · s(α, t) velocities that arise from the Stokes flow:
| (47) |
| (48) |
Further, from Eq. (27)
| (49) |
| (50) |
Plugging Eqs. (49) and (50) into Eqs. (47) and (48), we obtain
| (51) |
| (52) |
Next, we use the SSD to design an efficient, nonstiff explicit time integration scheme and an efficient preconditioner for the local Lagrange multiplier.
4.2. Numerical scheme
4.2.1. Vesicle evolution
Following [30], we use the SSD to rewrite Eq. (8) as
| (53) |
where we have absorbed the ΛLL contributions into N1 which is given by
| (54) |
In the equations above, b̄ is constant and we find that taking b̄ = max b(u) works well in practice. Taking the Fourier transform of Eq. (53), we get
| (55) |
Following [30], we discretize Eq. (55) using the second-order accurate linear propagator method:
| (56) |
where
| (57) |
We use the trapezoidal rule to approximate
| (58) |
| (59) |
The arclength s̄α(t) can be calculated using the Adams–Bashforth method:
| (60) |
where
| (61) |
To reconstruct the membrane interface (x(α, tn+1), y(α, tn+1)) from the updated θn+1(α) and , we first update a reference point (x(0, tn+1), y(0, tn+1)). This is done by using a second-order explicit Adams–Bashforth method. Once we update the reference point, we obtain the configuration of the interface from the θn+1(α) and by [30]
where the integration is performed using the discrete Fourier transform.
Note that the linear propagator and Adams–Bashforth methods require two previous time steps. At the first time step to compute θ1, we replace the second-order linear propagator with a first-order linear propagator of a similar form. For , we use the explicit Euler method.
To calculate the Stokes boundary integrals in Eqs. (6) and (7) we use the trapezoidal rule for the integrals with smooth integrands. To calculate the integral with the logarithmic integrand, we follow the approach in [38] and use the SSD and the lemma to obtain a spectrally accurate discretization using the discrete Fourier transform. Finally, following [30], all derivatives in the membrane, concentration and local Lagrange multiplier equations are performed using the discrete Fourier transform. A high-order (25th order) Fourier smoothing is used to control aliasing errors.
4.2.2. The inextensibility equations
We solve the integro-differential inextensibility Eq. (40) for Λ̃ using GMRES with a preconditioner derived from the SSD (see also [81]). From the SSD, we obtain
| (62) |
Replacing θα by a characteristic value θ̄α, one may define the operator
| (63) |
which can be inverted in Fourier space using the symbol:
| (64) |
Interestingly, using A−1 as the preconditioner, we found that the best results are obtained by taking θα = 0.
4.2.3. Lipid phase evolution
Using the small scale decomposition for the diffusion flux J
| (65) |
we may rewrite Eq. (24) as:
| (66) |
where
| (67) |
Taking the Fourier transform of Eq. (66) to get
| (68) |
we can use an analogous linear propagator method to perform the time discretization:
| (69) |
where
| (70) |
We also use the trapezoidal rule to approximate as in Eqs. (58) and (59). The first time step u1 is obtained using a first-order linear propagator method.
5. Summary
In this section, we summarize the governing equations and numerical procedure. For the fluid, the equations are:
| (71) |
| (72) |
| (73) |
| (74) |
where and i = 1, 2 denotes the interior and exterior fluids. The function u is the concentration of one of the lipid phases, and ΛLL(α, t) is the Lagrange multiplier (tension) that enforces inextensibility ((u · s)s + κu · n = 0 on the membrane Σ). The surface phase evolves according to
| (75) |
where Pe is a dimensionless parameter, and the tangent angle θ to the interface evolves by
| (76) |
where V and T are the normal and tangential velocities given by
| (77) |
| (78) |
The arclength variation sα evolves according to
| (79) |
Even though Ts + κV) ≈ 0 by inextensibility, we still solve this equation to provide an assessment of the actual arclength variation during the evolution.
The outline of the nonstiff numerical algorithm used to solve the system is as follows:
For a given location of the membrane Σ(tn) at time t = tn, use the iterative linear solver GMRES with the preconditioner described earlier to solve the Stokes equations to obtain un, the inextensible velocity field.
Update the membrane tangent angle θn+1, the arclength variation and the concentration un+1 using the nonstiff time stepping algorithm outlined previously.
Reconstruct the new interface positions (x(α, tn+1), y(α, tn+1)) from , θn+1 and a reference point (x0(t), y0(t)).
Goto step 1 and repeat.
6. Numerical results
In this section, we validate the numerical algorithm and investigate the influence of the line tension, bending coefficient, spontaneous curvature and external flow on two-dimensional membrane dynamics. We also vary the relative ratio of the surface lipid phase components. Unless otherwise specified, we use the following parameter and initial configuration setting: a = 100, spontaneous curvature κ̄(u) = 5(1 − u) + 0.1u and bending stiffness b(u) = (1 − u) + 0.5u. Also, we use a double well potential function f(u) = 0.25u2(1 − u)2. The initial condition is an ellipse given by:
| (80) |
where (0 ≤ α < 2 π). With this initial condition, the reduced surface area Δ = L/R − 2π = 1.7244. The initial concentration u is assumed to be a mixture of both phases:
| (81) |
where the average concentration ū is varied between 0 and 1 to account for different ratios of the surface phases and the perturbation parameter δ = 0.001.
6.1. Comparison with an explicit method
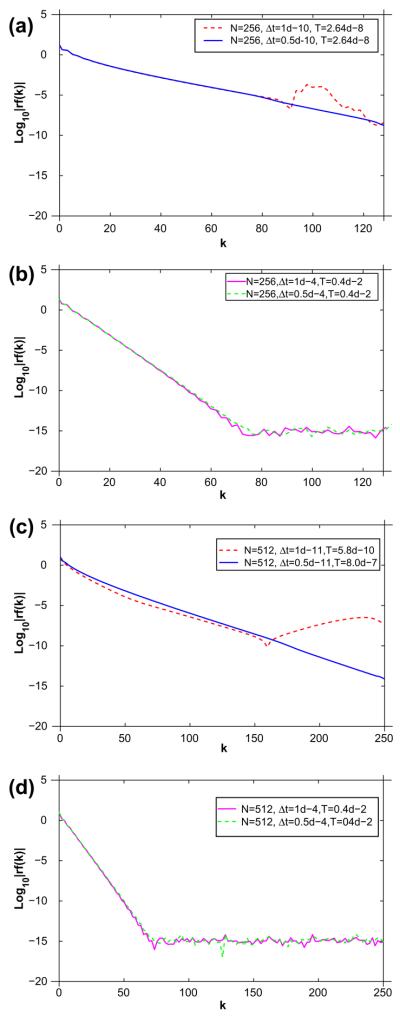
We demonstrate the effectiveness of our proposed semi-implicit method by comparing with a second-order accurate, explicit Adams–Bashforth (AB2) method used for all the equations. We consider the evolution from an unstable 50-50 mixture of the two lipid phases by taking ū = 0.5 with dimensionless parameters ∈ = 0.1 and Pe = 1. In Fig. 1, we present the Fourier transform |r̂(k, T)| of the radius using different time steps and mesh sizes for the two approaches (semi-implicit method, AB2). Only the even Fourier modes are shown at a final time T.
Fig. 1.
Comparison of the Fourier spectra |r̂(k, T) for an explicit Adams–Bashforth method (a and c) and our semi-implicit non-stiff algorithm (b and d) for N grid points, time step Δt and final time T as indicated.
Using AB2 with N = 256 and Δt = 1 × 10⁻¹⁰, the simulation is only able to compute up to T = 2.6 × 10⁻⁸. Around this time, there is significant and rapid growth of the high wavenumber amplitudes which then destabilize the simulation. See Fig. 1(a) (dashed). If the time step is reduced by a factor of two to Δt = 0.5 × 10⁻¹⁰ (solid), simulation may run significantly longer indicating this is just below the critical stability threshold for the time step. In Fig. 1(b) the same simulation is performed using our semi-implicit, nonstiff algorithm. In contrast, a much larger time step may be used (Δt = 1.0 × 10⁻⁴ (solid)) and the simulation may proceed indefinitely without losing stability (the time T = 4 × 10⁻³ is shown). As seen in the figure the high wavenumbers do not grow and that the solution is insensitive to the time step; the dashed corresponds to Δt = 0.5 × 10⁻⁴.
In Fig. 1(c), results are presented for AB2 using N = 512. In this case, the time step needs to be reduced by about a factor of 10 from that used with N = 256, which is consistent with the third-order time step constraint predicted by the small scale analysis. In the figure, the dashed curve corresponds to Δt = 1 × 10⁻¹¹. Observe there is significant growth of high wavenumbers at T = 5.8 × 10⁻¹⁰ which destabilizes the simulation. Using a time step Δt = 0.5 × 10⁻¹¹, the simulation may be run significantly longer. In contrast, performing the same simulation with our nonstiff algorithm [Fig. 1(d)] indicates that we can actually use the same time step for both N = 256 and N = 512 without loss of stability. At worst, we may have to reduce the time step by a factor of two for each factor of two decrease in the mesh size. Thus, it is clear that the use of AB2 is not practical and AB2 is significantly outperformed by our semi-implicit nonstiff method.
6.2. Convergence test
We test the numerical accuracy of our scheme by considering the evolution from an unstable 50–50 mixture of the two lipid phases by taking ū = 0.5 with varying Pe and ∈. Consider first the resolution in time. Using N = 512 grid points, we perform simulations using time steps Δt = 4 × 10⁻⁵, 2 × 10⁻⁵, 1 × 10⁻⁵, 5 × 10⁻⁶ and 2.5 × 10⁻⁶. The error in local arclength is maxα |sα(α, t) − sα(α, 0)| ≈ 10−8 in all cases. We study convergence of the area enclosed by the interface, which is more sensitive to the discretization, by comparing the area at time t = 0.02 with its initial value. The area is calculated by where the integration is performed using the discrete Fourier transform. The results are shown in Table 1 where the convergence rate is estimated from the errors corresponding to the results using two consecutive time step sizes. This confirms that the scheme is second-order accurate in time.
Table 1.
Convergence rate at time t = 0.02 for a 50–50 mixture of lipid phases with ū = 0.5, N = 512 grid points with Pe = 1 and varying ∊ (0.2, 0.1 and 0.05).
| Δ t |
∊ = 0.2 |
∊ = 0.1 |
∊ = 0.05 |
|||
|---|---|---|---|---|---|---|
| Error | Convergence rate | Error | Convergence rate | Error | Convergence rate | |
| 8e—5 | 1.9345e—5 | 1.1259 | 3.6904e—6 | – | 2.4682e—5 | 1.6260 |
| 4e—5 | 7.0962e—6 | 1.4468 | 2.6481e—6 | 0.4788 | 7.1922e—6 | 1.7789 |
| 2e—5 | 2.2470e—6 | 1.6591 | 1.0381e—6 | 1.3510 | 1.8303e—6 | 1.9744 |
| 1e—5 | 3.2575e—7 | 1.6721 | 6.4334e—7 | 1.8043 | 4.5053e—7 | 2.0224 |
| 5e—6 | 1.7285e—7 | 1.8960 | 9.1656e—8 | 1.8295 | 1.1392e—7 | 1.9836 |
| 2.5e—6 | 4.4780e—8 | 1.9486 | 2.4311e—8 | 1.9146 | 2.9119e—8 | 1.9680 |
We note that the scheme is stable and still quite accurate using much larger time steps. However, as seen from Table 1, the convergence rate deteriorates as the time step increases although the actual errors are small. The use of a higher order accurate time stepping algorithm could be helpful in this regard (e.g. see [33]). This is currently under study. We thus chose to use a small time step to ensure the temporal errors are very small and that we are in the second-order convergence regime. We also investigated the rate of convergence with different choices of the Peclet number Pe = 1/∊ and Pe = ∊(results not shown). Second-order convergence is also observed although the use of smaller values of ∊ require a smaller time step when Pe = ∊ for stability. This is not surprising since the initial phase decomposition occurs more rapidly when ∊ decreases with Pe = ∊ compared to that when Pe = 1.
To test the effect of spatial resolution, we fixed the time step Δt = 2 × 10⁻⁵ and varied the spatial grid size using N = 256,512 and 1024. In each case, the area is preserved to more than 6 digits, indicating that the error is limited by the time step. The membrane positions for these resolutions are virtually indistinguishable.
6.3. Effect of varying average concentration
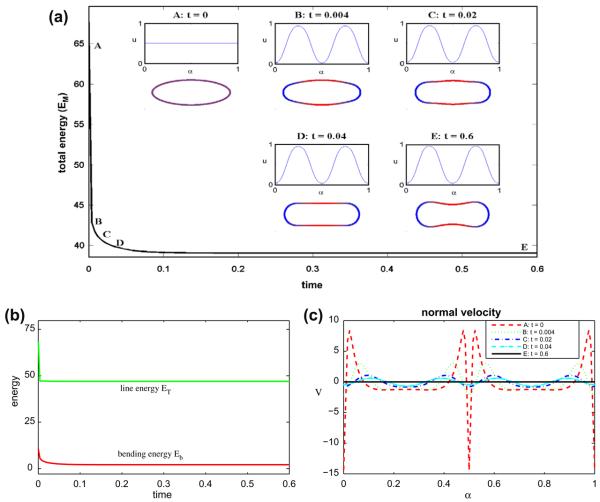
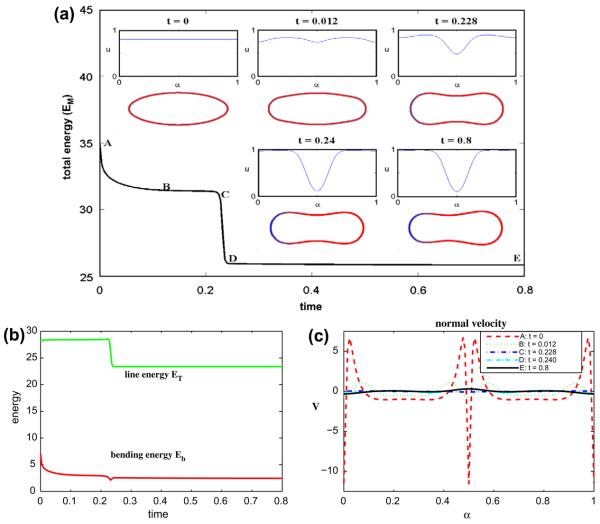
Next, we continue the evolution described in Section 6.2 and study the surface phase separation of a vesicle containing a 50-50 mixture of lipid phases (ū = 0.5) for Pe = 1 and ∊ = 0.1. We use the time step Δt = 2 × 10⁻⁵ and N = 512 grid points. The results are shown in Fig. 2(a)–(c). In (a), the total energy EM is shown together with insets of the corresponding vesicle morphologies and surface concentration u at the times indicated (color online: blue and red correspond to u = 0 and u = 1 phases, respectively). At early times phase separation rapidly occurs yielding two large regions of the u ≈ 1 at the vesicle top and bottom where the curvature is smallest and the u ≈ 0 phase is confined to the vesicle tips where the curvature is larger. This is consistent with the desired spontaneous curvature k̄(u). Correspondingly, there is a large drop in the total energy EM and as seen in (b) both energy components ET and Eb also decrease rapidly. At later times (t > 0.04), the upper and lower regions of the vesicle become negatively curved and the vesicle tends to a discocyte (or dumbbell) shape. The u = 1 phase remains confined to the negatively curved neck region. During this phase of the evolution, EM, ET and Eb all decrease slowly and the system tends to a steady state.
Fig. 2.
Multicomponent vesicle evolution with a 50–50 mixture of lipid phases: ū = 0.5. (a) The evolution of the total energy EM. Insets: vesicle morphologies and surface phase concentration u at indicated times (color online: blue and red correspond to the u = 0 and u = 1 phases, respectively). (b) The energy components: the line energy ET and the bending energy Eb. (c) The normal velocity.
The corresponding normal velocities are shown in Fig. 2(c). At early times the largest (in the magnitude) velocities occur near the vesicle tips and tend to round off the tip. Away from the tip, the negative normal velocities create the negatively curved regions. Since the velocity tends to zero, this confirms that the evolution tends to a steady state. In this simulation, the area is preserved to six digits and the maximum error in local arclength (as defined above) is 6 × 10⁻⁸.
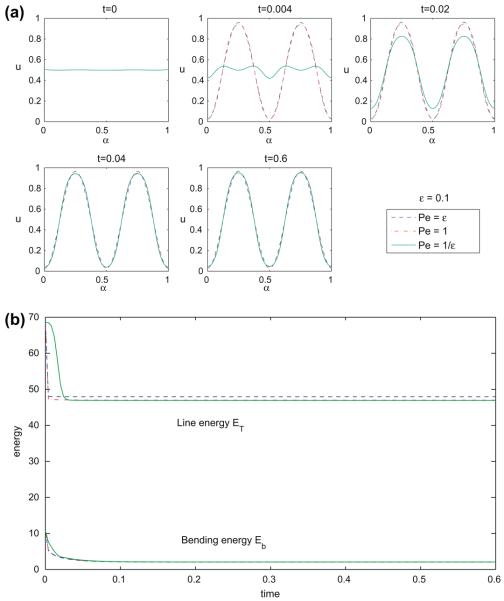
To see how the dynamics is affected by the Peclet number, we perform the same simulation as in Fig. 2 except using Pe = 1/∊ and Pe = ∊. The results are shown in Fig. 3(a) for the concentration and (b) for the energies. As seen from the figure, the initial stages of phase separation occur at different rates, depending on the Peclet number. Once the phases separate, the evolution of the different cases is similar.
Fig. 3.
Multicomponent vesicle evolution with a 50–50 mixture of lipid phases: ū = 0.5 with fixed ∊ = 0.1 and varying Pe = ∊ (dash), 1 (dash dot) and 1/∊ (solid). (a) The surface phase concentration u at indicated times. (b) The energy components: the line energy ET and the bending energy Eb.
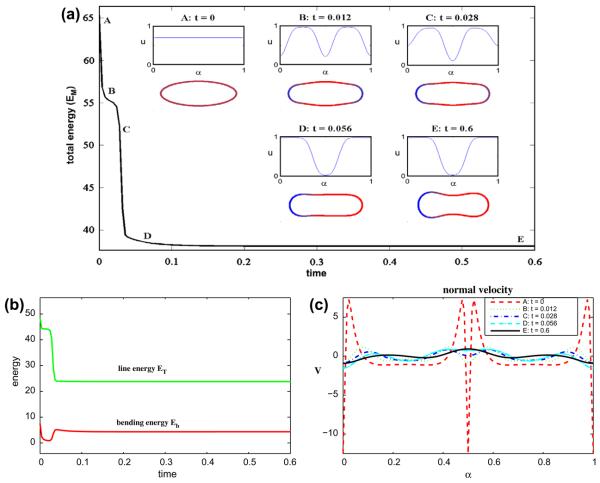
Now we fix the dimensionless parameters to be the following: ∊ = 0.1 and Pe = 1. In Fig. 4 we consider a 70–30 mixture of lipid phases by taking ū = 0.7. As in the 50–50 case, the u ≈ 1 and u ≈ 0 phases initially separate at the top/bottom and tip regions of the vesicle, respectively. The energies EM, ET and Eb correspondingly decrease rapidly. Note that the concentration u is still quite far from 0 at the vesicle tips at t = 0.012, however. Because of asymmetries in the initial concentration, the concentration at the right tip is slightly larger than that at the left. This drives the u = 0 phase to the left tip as a way to further reduce the line energy ET. While this reduces ET, and ultimately EM, the bending energy Eb increases because it is more energetically favorable to have the u = 1 phase located in regions where the curvature is small rather than having the configuration shown where the u = 1 phase is located at the large curvature right tip. The line energy ET decreases dramatically because the four phase interface points on the membrane are reduced to two by this process. At later times, negative curvature regions form and the membrane tends an asymmetric discocyte shape. The shape, surprisingly, has the u = 1 phase located at the larger curvature tip. This is in contrast to the desired spontaneous curvature (e.g. K̄(1) = 0.1 and K̄(0) = 5) and is what drives the rapid increase in Eb. This configuration is a result of the limited amount of the u = 1 phase. For example, having a lower curvature tip requires more of the u = 1 phase. The normal velocity, shown in Fig. 4(c), indicates that the evolution still has not quite reached a steady state even though the energy variation is very small at late times. In this simulation (Δt = 2 × 10⁻⁵, N = 512), the area is preserved to six digits of accuracy and the maximum error in local arclength is 8 × 10⁻⁶.
Fig. 4.
Multicomponent vesicle evolution with a 70–30 mixture of lipid phases: ū = 0.7 with ∊ = 0.1 and Pe = 1. (a) The evolution of the total energy EM. Insets: vesicle morphologies and surface phase concentration u at indicated times (color online: blue and red correspond to the u = 0 and u = 1 phases, respectively). (b) The energy components: the line energy ET and the bending energy Eb. (c) The normal velocity. (For interpretation of the references to colour in this figure legend, the reader is referred to the web version of this article.)
In Fig. 5, we increase the amount of the u = 1 component and consider a 80–20 mixture by taking ū = 0.8. At early times, the phases tend to separate more slowly compared to the 50–50 and 70–30 cases. This is because the driving force for phase separation is lower in this case. In fact, the initial concentration ū lies just outside the spinodal region of f(0.25 ≤ u ≤ 0.75) where negative diffusion (ff′ < 0) occurs. Here, phase separation is driven by the bending energy at early times. As can be seen from the Fig. 5(b), the early dynamics tend to reduce the bending energy Eb at the expense of a slight increase in the line energy ET. As the phase separation process continues, the u = 0 phase accumulates at the left tip of the vesicle. This results in a large drop in ET and EM. The energy Eb slightly increases. The resulting vesicle takes an asymmetric discocyte shape but now with the larger curved region at the left tip. This is consistent with the desired spontaneous curvature and occurs because there is now enough u = 1 phase to support a less curved right tip. The normal velocity shown in Fig. 5(c) shows that the evolution has nearly reached the steady state. In this simulation (Δt = 2 × 10⁻⁵, N = 512), the area is preserved to six digits of accuracy and the maximum error in local arclength is 5 × 10⁻⁷.
Fig. 5.
Multicomponent vesicle evolution with a 80–20 mixture of lipid phases: ū = 0.8 with ∊ = 0.1 and Pe = 1. (a) The evolution of the total energy EM. Insets: vesicle morphologies and surface phase concentration u at indicated times (color online: blue and red correspond to the u = 0 and u = 1 phases, respectively). (b) The energy components: the line energy ET and the bending energy Eb. (c) The normal velocity. (For interpretation of the references to colour in this figure legend, the reader is referred to the web version of this article.)
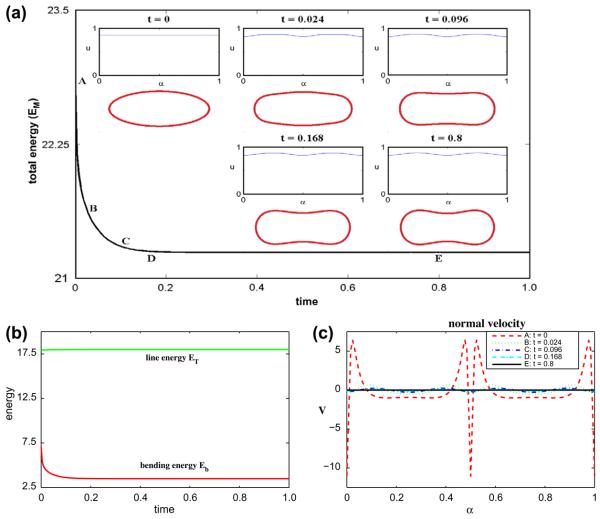
When the amount of the u = 1 phase is increased to yield a 85–15 mixture by taking ū = 0.85, the phases rearrange slightly but as seen in Fig. 6, there is no dramatic phase separation as the vesicle tends toward a discocyte shape. This is because the initial concentration lies far enough outside the spinodal region of f(0.25 ≤ u ≤ 0.75) that no decomposition occurs. In this simulation (Δt = 2 × 10⁻⁵, N = 512), the area is preserved to six digits of accuracy and the maximum error in local arclength is 3 × 10⁻⁸.
Fig. 6.
Multicomponent vesicle evolution with a 85–15 mixture of lipid phases: ū = 0.85 with ∊ = 0.1 and Pe = 1. (a) The evolution of the total energy EM. Insets: vesicle morphologies and surface phase concentration u at indicated times (color online: blue and red correspond to the u = 0 and u = 1 phases, respectively). (b) The energy components: the line energy ET and the bending energy Eb. (c) The normal velocity. (For interpretation of the references to colour in this figure legend, the reader is referred to the web version of this article.)
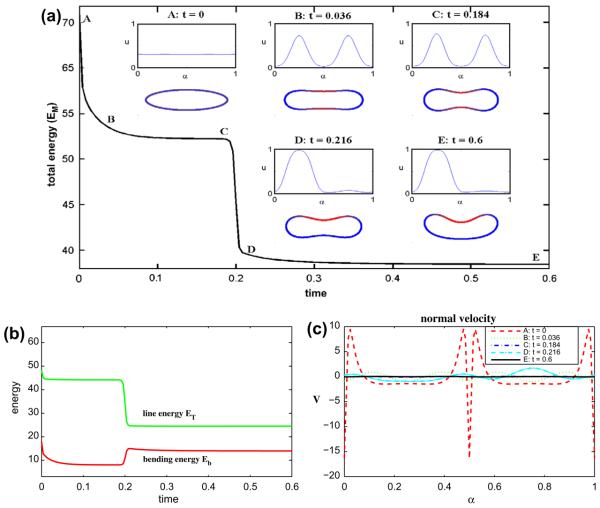
Next, in Fig. 7, we decrease the amount of the u = 1 phase and consider a 30–70 mixture by taking ū = 0.3. As in the previous cases, phase separation occurs at the vesicle top/bottom and tips, accompanied by a decrease in the energies EM, ET and Eb. At later times, the vesicle develops negative curvature. Because of the initial asymmetry in u, the concentration in the lower region is less than that in the upper region of the vesicle. This drives the transport of the u = 1 phase to the upper region and results in a rapid decrease in ET which overcomes the increase in Eb that is primarily associated with having the u = 0 phase located in the negatively curved lower region. The vesicle responds later by evolving so that the lower region becomes convex thereby decreasing the bending energy. The vesicle accordingly tends to an asymmetric (stomatocyte) equilibrium shape. In this simulation (Δt = 2 × 10⁻⁵, N = 512), the area is preserved to 6 digits of accuracy and the maximum error in local arclength is 1 × 10⁻⁶.
Fig. 7.
Multicomponent vesicle evolution with a 30–70 mixture of lipid phases: ū = 0.3 with ∊ = 0.1 and Pe = 1. (a) The evolution of the total energy EM. Insets: vesicle morphologies and surface phase concentration u at indicated times (color online: blue and red correspond to the u = 0 and u = 1 phases, respectively). (b) The energy components: the line energy ET and the bending energy Eb. (c) The normal velocity. (For interpretation of the references to colour in this figure legend, the reader is referred to the web version of this article.)
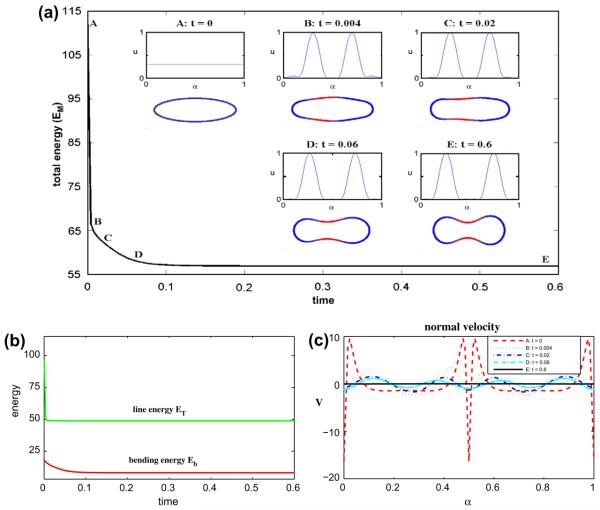
In Fig. 8 we repeat the simulation shown in Fig. 7 but with a smaller value of ∊; we take ∊ = 0.05. Since the initial concentration condition ū = 0.3 is far from equilibrium, using a smaller value of ∊ increases the initial magnitude of the line energy (via the coefficient a/∊) ET and correspondingly the total energy EM. The system responds by rapidly phase separating, with the u = 1 phase now placed asymmetrically on small curvature regions of the vesicle. Once the phase separation occurs the u = 1 phases develop negative curvature and the vesicle evolves to a slightly asymmetric discocyte shape. Unlike the previous case where the u = 1 phase is transported to the top of the vesicle, here the smaller value of ∊ prevents this transport since decreasing ∊ enhances the immiscibility of the u = 0 and u = 1 phases. Note that if we had considered locally equilibrated initial conditions (well-defined and separated u = 0 and u = 1 domains) then we would have observed convergence of the results in ∊. We have confirmed this (results not shown). Also observe from the normal velocity in Fig. 8(c) that the shape at t = 15 is still evolving apparently towards a more symmetric shape. In this simulation (Δt = 2 × 10⁻⁵, N = 512), the area is preserved to five digits of accuracy and the maximum error in local arclength is 1 × 10⁻⁶.
Fig. 8.
Multicomponent vesicle evolution with a 30–70 mixture of lipid phases: ū = 0.3 with ∈ = 0.05 and Pe = 1. (a) The evolution of the total energy EM. Insets: vesicle morphologies and surface phase concentration u at indicated times. (color online: blue and red correspond to the u = 0 and u = 1 phases, respectively). (b) The energy components: the line energy ET and the bending energy Eb. (c) The normal velocity. (For interpretation of the references to colour in this figure legend, the reader is referred to the web version of this article.)
6.4. The effect of an applied shear flow
We next consider the evolution of a multicomponent vesicle under an applied shear flow. We consider a 30–70 lipid phase mixture (ū = 0.3). The initial vesicle is defined by
| (82) |
| (83) |
where α ∈ [0,2π) and the simple shear flow u∞ = (25y,0) is used. All other parameters are the same as in the previous simulations.
With this initial condition, the reduced surface area is Δ = 6.5682 which is significantly larger than that used in the previous simulations. Experimentally, there is a critical value Δ* such that for Δ ≤ Δ* a vesicle will tank-tread in a shear flow (e.g. reach a steady shape) but for Δ > Δ* the vesicle will tumble (e.g. evolve dynamically and the shape will remain unsteady). See [41]. As far as we are aware, the value Δ* has not been determined for two-dimensional vesicles or multicomponent vesicles. Numerically, we found that for Δ = 6.5682 the vesicle tumbles (as seen below) while for Δ = 1.7244 (initial membrane given in Eq. (80) the vesicle tank-treads). A more precise determination of Δ* and its dependence on heterogeneity and the associated parameters is currently under study.
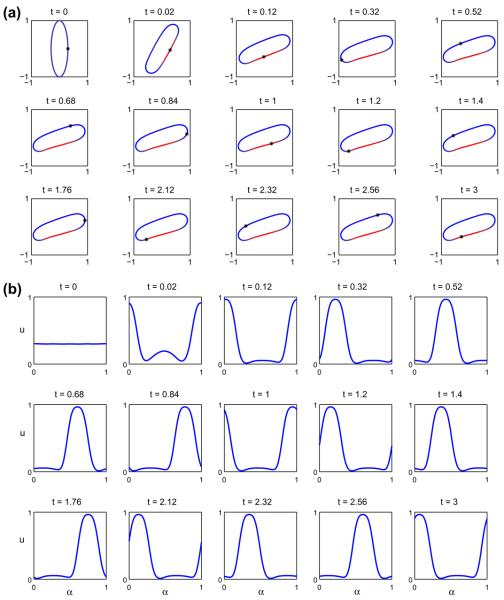
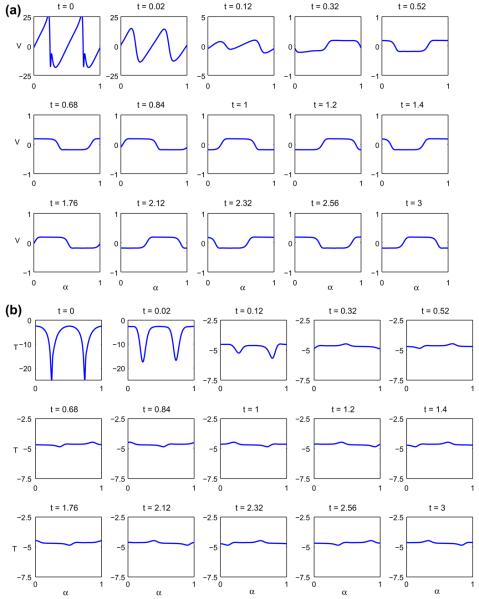
In Fig. 9 we consider the evolution of the initially elliptical vesicle with Δ = 1.7244. For reference, the point (x(α = 0, t), y(α = 0, t)) is marked by ‘*’. At early times, the vesicle rotates, the tips round off and the phases separate on the flat regions of the vesicle, eventually accumulating on one of the vesicle sides, as seen in (a). Rather quickly, the vesicle reaches a nearly steady shape and the reference point travels around the interface indicating the persistence of tangential motion (tank-treading). The u = 1 phase, however, remains in a fixed spatial location and causes the membrane to bend slightly, and even develop a small negative curvature, due to its smaller bending stiffness and spontaneous curvature. This is precisely due to the interaction between the shape variation and the phase decomposition (e.g. presence of curvature terms in Eq. (13) and the presence of the u-dependent terms in the stress boundary condition in Eq. (72)). In Fig. 9(b) the concentration u is plotted versus α at different times throughout the simulation. Because the spatial location of the u = 1 domain is fixed, the concentration tends to a traveling wave (when plotted against α as the vesicle approaches a steady shape. In Fig. 10, the corresponding normal (a) and tangential (b) velocities are shown. The normal velocity tends to a small, apparently periodic perturbation about zero, indicating that the shape is nearly steady. The tangential velocity, on the other hand, approaches a small perturbation about negative constant. A careful examination of the shape (not shown) indicates that it is not quite steady and appears to vary periodically in time where the perturbation about the mean shape is very small, corresponding to the small perturbations in the normal and tangential velocities.
Fig. 9.
Multicomponent vesicle tank-treading under an applied shear with a 30–70 mixture of lipid phases: ū = 0.3 with Δ = 1.7244, ∈ = 0.1 and Pe = 1. (a) The evolution of the vesicle at the indicated times (color online: blue and red correspond to the u = 0 and u = 1 phases, respectively). (b) The concentration u at the corresponding times. (For interpretation of the references to colour in this figure legend, the reader is referred to the web version of this article.)
Fig. 10.
The normal (a) and tangential (b) velocities for the tank-treading vesicle shown in Fig. 9.
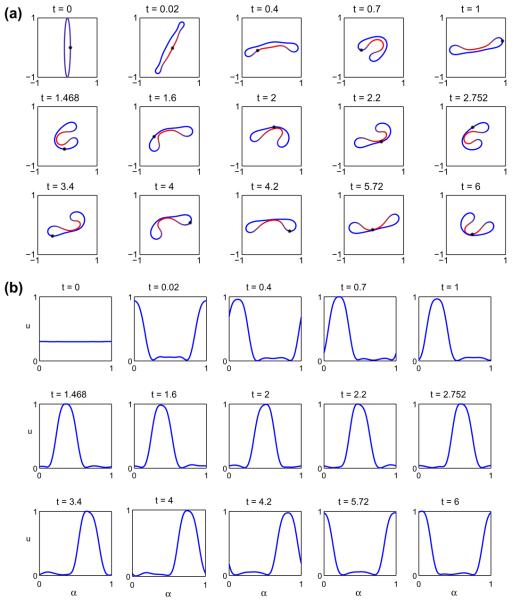
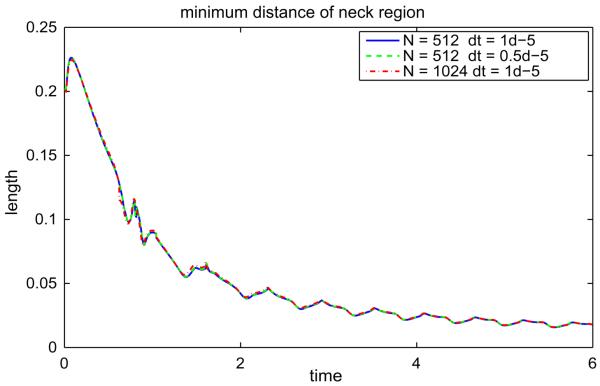
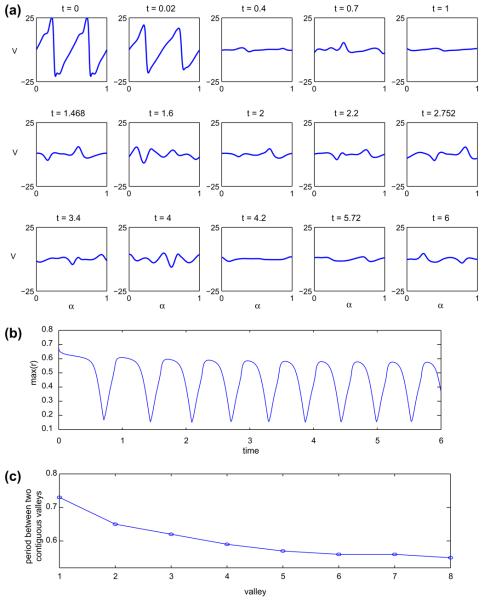
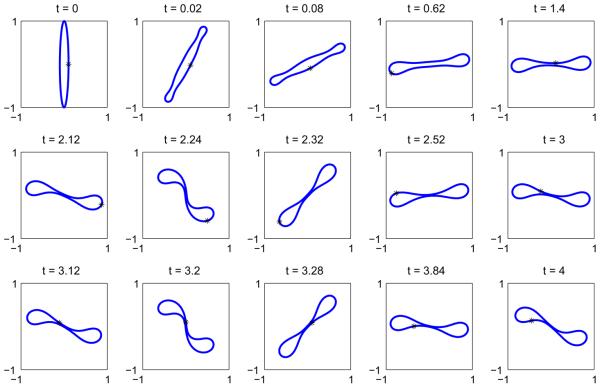
Next, we consider the evolution of the initially elliptical vesicle with Δ = 6.5682. In Fig. 11 the evolution of the resulting vesicle morphology (a) is shown together with the concentration u (b). As above, the reference point (x(α = 0, t), y(α = 0, t)) is shown as the point‘*’. At early times, the u = 1 phase decomposes on the flat regions of the vesicle as it begins to rotate. The u = 1 phase ultimately accumulates on one of the vesicle sides and as the vesicle continues to rotate, the decreased bending coefficient and spontaneous curvature of the u = 1 phase cause the vesicle to bend as it rotates (see times t = 0.4 and 0.7) with the u = 1 region acquiring a negative curvature while the u = 0 phase retains a positive curvature. By time t = 0.4, the vesicle becomes nearly horizontal and acquires a stomatocyte-like shape analogous to that seen in Fig. 7. At this point the vesicle is again bent by the shear flow and the process repeats itself apparently indefinitely. As this process continues, the distance between the negatively curved u = 1 region and the positively curved u = 0 region on the opposite side of the vesicle decreases but does not apparently vanish in finite time as seen in Fig. 12. Indeed, the neck radius may even stabilize. This figure also shows the results of a resolution study in Δt (Δt is halved with N= 512) and in N (N is doubled to 1024). The plot shows that the all the resolutions are in agreement and thus the tumbling vesicle is well resolved using Δt = 1 × 10⁻⁵ and N = 512. Further, the maximum error in local arclength is 1 × 10⁻⁴.
Fig. 11.
A multicomponent vesicle tumbling under an applied shear with a 30–70 mixture of lipid phases: ū = 0.3 with Δ = 6.5682, ∊ = 0.1 and Pe = 1. (a) The evolution of the vesicle at the indicated times (color online: blue and red correspond to the u = 0 and u = 1 phases, respectively). (b) The concentration u at the corresponding times. (For interpretation of the references to colour in this figure legend, the reader is referred to the web version of this article.)
Fig. 12.
The minimum distance of neck region from the vesicle shown in Fig. 11 is shown in (a) with different spatial resolutions and time-step sizes. The solid line indicates N = 512 with Δt = 1 × 10⁻⁵, the dashed line indicates N = 512 with Δt = 0.5 × 10⁻⁵ and dash-dotted line represents N = 1024 with Δt = 1 × 10⁻⁵.
The corresponding normal velocities are shown in Fig. 13(a). At early times the largest (in the magnitude) velocities occur near the vesicle tips and tends to round them off. Observe that the velocity roughly has a periodic or quasi-periodic structure that emerges in time (cf. compare times t ≈ 1.47, t ≈ 2.75 and t ≈ 6). Further evidence of this is shown in Fig. 13(b) where the maximal distance of the vesicle membrane from the origin is plotted as a function of time. As seen in Fig. 13(c) the temporal spacing between the consecutive valleys in the maximal distance decreases and may tend to a constant value as time increases. This is currently under study.
Fig. 13.
The normal velocity of the vesicle shown in Fig. 11 is shown in (a). In (b), the evolution of the maximal distance from the vesicle membrane to the origin. In (c), the temporal spacing between the consecutive valleys in the maximal distance is shown.
The morphologies observed in Fig. 11(a) critically depend on the heterogeneity of the vesicle. If one instead considers a homogeneous vesicle with u = 0 and all other parameters as before, then the tumbling morphologies are quite different. This is shown in Fig. 14. Observe that the homogeneous vesicle resists being bent by the flow and bends only slightly in the opposite direction as compared to the multicomponent case. This is consistent with the large positive spontaneous curvature k̄(0) = 5 for the u = 0 phase. Interestingly, we found that by taking either different bending coefficients or different spontaneous curvatures for the u = 0 and u = 1 phases in a multicomponent vesicle also results vesicle morphologies analogous to those observed in Fig. 11.
Fig. 14.
A homogeneous membrane corresponding to u = 0 in an applied shear flow. Compare to Fig. 11 showing the evolution of a multicomponent membrane under the same conditions.
7. Conclusions and future work
We have developed and investigated a thermodynamically consistent model of two-dimensional multicomponent vesicles in an incompressible viscous fluid. The model is derived using an energy variation approach that accounts for variation among the surface phases and the associated the excess energy (line energy) between juxtaposed surface phases, bending energy, spontaneous curvature, local inextensibility and fluid flow via the Stokes equations. In particular, we derived the generalized Laplace–Young boundary condition for the normal stress jump across the vesicle membrane. The equations are high-order (fourth order) nonlinear and nonlocal due to incompressibility of the fluid and the local inextensibility of the vesicle membrane.
To solve the equations numerically, we developed a nonstiff, pseudo-spectral boundary integral method that relies on an analysis of the equations at small scales. The small scale decomposition is used to develop efficient, explicit time integration schemes for both the evolution of the membrane and the surface phases. In addition, the equation for the Lagrange multiplier introduced to enforce local inextensibility is reformulated and the small scale decomposition is used to motivate an efficient preconditioner. The algorithm is closely related to that developed very recently by Veerapaneni et al. [81] for homogeneous vesicles although we use a different and more efficient time stepping algorithm [30] and a reformulation of the Lagrange multiplier equation. The algorithm presented here can be improved in several ways. A higher order accurate time stepping algorithm could be employed (e.g. see [33]) to improve accuracy in time and a fast summation algorithm (e.g. see [45,81]) could be used to speed up the evaluation of the boundary integrals. These are currently under study.
We presented simulations of multicomponent vesicles in an initially quiescent fluid and in an applied shear flow. In the former, we investigated the effect of varying the average surface concentration of the lipid phases (e.g. ordered/disordered) where the initial concentration is a perturbation about the average and the initial vesicle is an ellipse. In addition, the u = 1 phase has smaller spontaneous curvature and bending stiffness coefficient. At early times, the phases decompose in a similar way with the u = 1 phase preferentially accumulating in flat regions of the vesicle. The phases then redistribute and alter the morphology of the vesicle and its dynamics according to the average concentration. When an applied shear is introduced, an initially elliptical vesicle tank-treads and attains a steady shape and surface phase distribution. A sufficiently elongated vesicle tumbles and the presence of different surface phases with different bending stiffnesses and spontaneous curvatures yields a complex evolution of the vesicle morphology as the vesicle bends in regions where the bending stiffness and spontaneous curvature are small.
The model presented here can be extended straightforwardly to systems with more surface components and more realistic thermodynamics, e.g. [64,73,9] and to three-dimensional vesicles. We are currently extending the numerical algorithm to axisymmetric three-dimensional vesicles. The presence of membrane proteins within the phases can also have an important influence on the vesicle shape and surface phase distribution, e.g. [39,54], and can be modeled by incorporating the concentration(s) of membrane proteins in the phase-field model described here via an additional protein energy and introducing coupling between the protein and the bending rigidity and spontaneous curvature, e.g. see [50,2,3]. Although the boundary integral model breaks down if vesicles fission or coalesce, and ad hoc interface surgery needs to be performed to transition through such events, the boundary integral approach is attractive because it provides highly accurate solutions that can be used to validate other more general approaches (e.g. level-set, phase-field) and the solutions provided by the boundary integral method are of intrinsic interest.
Acknowledgments
J.L. thanks Michael Shelley for valuable discussions. A.V. acknowledges support from DFG SFB 609 and VO-899/6-1. J.L. acknowledges support from the National Science Foundation Division of Mathematical Sciences (DMS) and from the National Institutes of Health through grant P50GM76516 for a Center of Excellence in Systems Biology at the University of California, Irvine. S.L. acknowledges support from NSF grant DMS-0914923. Finally, the authors thank the reviewers for their insightful comments that strengthened the paper.
Footnotes
Actually this system has a nullspace consisting of functions of the form f = cn where c is a constant. A unique solution perpendicular to this nullspace may be found.
References
- 1.Alberts B, Bray D, Lewis J, Raff M, Roberts K, Watson JD. Molecular Biology of the Cell. Garland; New York: 1994. [Google Scholar]
- 2.Allain J-M, Ben Amar M. Biphasic vesicle: instability induced by adsorption of proteins. Phys. Rev. A. 2004;337:531–545. [Google Scholar]
- 3.Allain J-M, Ben Amar M. Budding and fission of a multiphase vesicle. Eur. Phys. J. E. 2006;20:409–420. doi: 10.1140/epje/i2006-10030-4. [DOI] [PubMed] [Google Scholar]
- 4.Andelman D, Kawakatsu T, Kawasaki K. Equilibrium shape of two-component unilamellar membranes and vesicles. Europhys. Lett. 1992;19(1):57–62. [Google Scholar]
- 5.Ayuyan AG, Cohen FS. Raft composition at physiological temperature and pH in the absence of detergents. Biophys. J. 2008;94:2654–2666. doi: 10.1529/biophysj.107.118596. [DOI] [PMC free article] [PubMed] [Google Scholar]
- 6.Barrett JW, Garcke H, Nürnberg R. Parametric approximation of willmore flow and related geometric evolution equations. SIAM J. Sci. Comput. 2008;31(1):225–253. [Google Scholar]
- 7.Baumgart T, Das S, Webb WW, Jenkins JT. Membrane elasticity in giant vesicles with fluid phase coexistence. Biophys. J. 2005;89:1067–1080. doi: 10.1529/biophysj.104.049692. [DOI] [PMC free article] [PubMed] [Google Scholar]
- 8.Baumgart T, Hess ST, Webb WW. Imaging coexisting fluid domains in biomembrane models coupling curvature and line tension. Nature. 2003;435:821–824. doi: 10.1038/nature02013. [DOI] [PubMed] [Google Scholar]
- 9.Beattie ME, Veatch SL, Stottrip BL, Keller SL. Sterol structure determines miscibility versus melting transitions in lipid vesicles. Biophys. J. 2005;89:1760–1768. doi: 10.1529/biophysj.104.049635. [DOI] [PMC free article] [PubMed] [Google Scholar]
- 10.Biben T, Kassner K, Misbah C. Phase-field approach to three-dimensional vesicle dynamics. Phys. Rev. E. 2005;72:049121. doi: 10.1103/PhysRevE.72.041921. [DOI] [PubMed] [Google Scholar]
- 11.Biben T, Misbah C. Tumbling of vesicles under shear flow within an advected-field approach. Phys. Rev. E. 2003;67:031908. doi: 10.1103/PhysRevE.67.031908. [DOI] [PubMed] [Google Scholar]
- 12.Campelo F, Hernández-Machado A. Dynamic model and stationary shapes of fluid vesicles. Eur. Phys. J. E. 2006;20:37–45. doi: 10.1140/epje/i2005-10079-5. [DOI] [PubMed] [Google Scholar]
- 13.Campelo F, Hernández-Machado A. Model for curvature-driven pearling instability in membranes. Phys. Rev. Lett. 2007;99:088101. doi: 10.1103/PhysRevLett.99.088101. [DOI] [PubMed] [Google Scholar]
- 14.D'Onofrio TG, Hatzor A, Counterman AE, Heetderks JJ, Sandel MJ, Weiss PS. Controlling and measuring the interdependence of local properties in biomembranes. Langmuir. 2003;19:1618–1623. [Google Scholar]
- 15.Du Q, Li ML, Liu C. Analysis of a phase field Navier–Stokes vesicle–fluid interaction model. Discr. Contin. Dyn. Syst. B. 2007;8(3):539–556. [Google Scholar]
- 16.Du Q, Liu C, Wang X. A phase field approach in the numerical study of the elastic bending energy for vesicle membranes. J. Comput. Phys. 2004;198(2):450–468. [Google Scholar]
- 17.Du Q, Liu C, Wang X. Simulating the deformation of vesicle membranes under elastic bending energy in three dimensions. J. Comput. Phys. 2006;212:757. [Google Scholar]
- 18.Dutta S, Ray DS. Magnetic field induced pattern formation in reactive membranes. Phys. Rev. E. 2007;75:016205. doi: 10.1103/PhysRevE.75.016205. [DOI] [PubMed] [Google Scholar]
- 19.Funkhouser CM, Solis FJ, Thornton K. Coupled composition-deformation phase-field method for multicomponent lipid membranes. Phys. Rev. E. 2007;76:011912. doi: 10.1103/PhysRevE.76.011912. [DOI] [PubMed] [Google Scholar]
- 20.Gao LH, Lipowsky R, Shillcock J. Tension-induced vesicle fusion: pathways and pore dynamics. Soft Mat. 2008;4(6):1208–1214. doi: 10.1039/b801407h. [DOI] [PubMed] [Google Scholar]
- 21.Gao LH, Shillcock J, Lipowsky R. Improved dissipative particle dynamics simulations of lipid bilayers. J. Chem. Phys. 2007;126(1):015101. doi: 10.1063/1.2424698. [DOI] [PubMed] [Google Scholar]
- 22.García-Sáez AJ, Chiantia S, Schwille P. Effect of line tension on the lateral organization of lipid membranes. J. Biol. Chem. 2007;282:33537–33544. doi: 10.1074/jbc.M706162200. [DOI] [PubMed] [Google Scholar]
- 23.Góźdź WT, Gompper G. Shapes and shape transformations of two-component membranes of complex topology. Phys. Rev. E. 1999;59(4):4305–4316. [Google Scholar]
- 24.Góźdź WT, Gompper G. Shape transformations of two-component membranes under weak tension. Europhys. Lett. 2001;55(4):587–593. [Google Scholar]
- 25.Grafmüller A, Shillcock J, Lipowsky R. Pathway of membrane fusion with two tension-dependent energy barriers. Phys. Rev. Lett. 2007;98(21):218101. doi: 10.1103/PhysRevLett.98.218101. [DOI] [PubMed] [Google Scholar]
- 26.Harden JL, MacKintosh FC. Shape transformations of domains in mixed-fluid films and bilayer membranes. Europhys. Lett. 1994;28(7):495–500. [Google Scholar]
- 27.Harden JL, MacKintosh FC, Olmsted PD. Budding and domain shape transformations in mixed lipid films and bilayer membranes. Phys. Rev. E. 2005;72:011903. doi: 10.1103/PhysRevE.72.011903. [DOI] [PubMed] [Google Scholar]
- 28.Helfrich W. Elastic properties of lipid bilayers-theory and possible experiments. Z. Nat. C. 1973;28:693–703. doi: 10.1515/znc-1973-11-1209. [DOI] [PubMed] [Google Scholar]
- 29.Hess ST, Kumar M, Verma A, Farrington J, Kenworthy A, Zimmerberg J. Quantitative electron microscopy and fluorescence spectroscopy of the membrane distribution of influenza hemagglutinin. J. Cell Biol. 2005;169:965–976. doi: 10.1083/jcb.200412058. [DOI] [PMC free article] [PubMed] [Google Scholar]
- 30.Hou T, Lowengrub J, Shelley M. Removing the stiffness from interfacial flows with surface tension. J. Comput. Phys. 1994;114:312. [Google Scholar]
- 31.Hou T, Lowengrub J, Shelley M. Boundary integral methods for multicomponent fluids and multiphase materials. J. Comput. Phys. 2001;169:302–362. [Google Scholar]
- 32.Hou T, Shi Z. Removing the stiffness of elastic force from the immersed boundary method for the 2d Stokes equations. J. Comput. Phys. 2007;114:312. [Google Scholar]
- 33.Hou TY, Lowengrub JS, Shelley MJ. The long-time motion of vortex sheets with surface tension. Phys. Fluids. 1997;7:1933–1954. [Google Scholar]
- 34.Huang KC, Mukhopadhyay R, Wingreen NS. A curvature-mediated mechanism for localization of lipids to bacterial poles. PLOS Comput. Biol. 2006;2(11):1357–1364. doi: 10.1371/journal.pcbi.0020151. [DOI] [PMC free article] [PubMed] [Google Scholar]
- 35.Jamet D, Misbah C. Toward a thermodynamically consistent picture of the phase-field model of vesicles: local membrane incompressibility. Phys. Rev. E. 2007;76:051907. doi: 10.1103/PhysRevE.76.051907. [DOI] [PubMed] [Google Scholar]
- 36.Jamet D, Misbah C. Toward a thermodynamically consistent picture of the phase-field model of vesicles: curvature energy. Phys. Rev. E. 2008;78:031902. doi: 10.1103/PhysRevE.78.031902. [DOI] [PubMed] [Google Scholar]
- 37.Jiang Y, Lookman T, Saxena A. Phase separation and shape deformation of two-phase membranes. Phys. Rev. E. 2000;61:R57–R61. doi: 10.1103/physreve.61.r57. [DOI] [PubMed] [Google Scholar]
- 38.Jou HJ, Leo PH, Lowengrub J. Microstructural evolution in inhomogeneous elastic media. J. Comput. Phys. 1997;131:109–148. [Google Scholar]
- 39.Jülicher F, Lipowsky R. Shape transformations of vesicles with intramembrane domains. Phys. Rev. E. 1997;53:2670–2683. doi: 10.1103/physreve.53.2670. [DOI] [PubMed] [Google Scholar]
- 40.Jülicher F, Lipwosky R. Domain-induced budding of vesicles. Phys. Rev. Lett. 1993;70:2964–2967. doi: 10.1103/PhysRevLett.70.2964. [DOI] [PubMed] [Google Scholar]
- 41.Kantsler V, Steinberg V. Transition to tumbling and two regimes of tumbling motion of a vesicle in shear flow. Phys. Rev. Lett. 2006;96:036001. doi: 10.1103/PhysRevLett.96.036001. [DOI] [PubMed] [Google Scholar]
- 42.Kaoui B, Ristow GH, Cantat I, Misbah C, Zimmermann W. Lateral migration of a two-dimensional vesicle in unbounded poiseuille flow. Phys. Rev. E. 2008;77:021903. doi: 10.1103/PhysRevE.77.021903. [DOI] [PubMed] [Google Scholar]
- 43.Kawakatsu T, Kawasaki K, Andelman D, Taniguchi T. Phase-transitions and shapes of 2-component membranes and vesicles 2. Strong segregation limit. J. Phys. II. 1993;3(7):971–997. [Google Scholar]
- 44.Kraus M, Wintz W, Seifert U, Lipowsky R. Fluid vesicles in shear flow. Phys. Rev. Lett. 1996;77:3685–3688. doi: 10.1103/PhysRevLett.77.3685. [DOI] [PubMed] [Google Scholar]
- 45.Kropinski MCA. Numerical methods for multiple inviscid interfaces in creeping flows. J. Comput. Phys. 2002;180:1–24. [Google Scholar]
- 46.Kumar PBS, Gompper G, Lipowsky R. Budding dynamics of multicomponent membranes. Phys. Rev. Lett. 2001 doi: 10.1103/PhysRevLett.86.3911. [DOI] [PubMed] [Google Scholar]
- 47.Landau L. Statistical Physics. Butterworth-Heinemann; Oxford: 1984. [Google Scholar]
- 48.Laradji M, Kumar PBS. Dynamics of domain growth in self-assembled fluid vesicles. Phys. Rev. Lett. 2004;93(19):198105. doi: 10.1103/PhysRevLett.93.198105. [DOI] [PubMed] [Google Scholar]
- 49.Laradji M, Kumar PBS. Domain growth, budding, and fission in phase-separating self-assembled fluid bilayers. J. Chem. Phys. 2005;123 doi: 10.1063/1.2102894. [DOI] [PubMed] [Google Scholar]
- 50.Leibler S. Curvature instability in membranes. J. Phys. 1986;47(3):507–516. [Google Scholar]
- 51.Lipowsky R. The conformation of membranes. Nature. 1991;349:475–481. doi: 10.1038/349475a0. [DOI] [PubMed] [Google Scholar]
- 52.Lipowsky R. Budding of membranes induced by intramembrane domains. J. Phys. II France. 1992;2:1825–1840. [Google Scholar]
- 53.Lipowsky R, Sackman E, editors. Structure and Dynamics of Membranes – From Cells to Vesicles. 1A and B. Elsevier; Amsterdam: 1995. [Google Scholar]
- 54.Long MS, Cans A-S, Keating CD. Budding and asymmetric protein microcompartmentation in giant vesicles containing two aqueous phases. J. Am. Chem. Soc. 2008;130:756–762. doi: 10.1021/ja077439c. [DOI] [PubMed] [Google Scholar]
- 55.Lowengrub J, Xu J-J, Voigt A. Surface phase separation and flow in a simple model of multicomponent drops and vesicles. Fluid Dyn. Mater. Proc. 2007;3(1):1–19. [Google Scholar]
- 56.Lowengrub JS, Rätz A, Voigt A. Phase-field Modeling of the Dynamics of Multicomponent Vesicles: Spinodal Decomposition, Coarsening, Budding and Fission. Phys. Rev. E. 2009;79:031926. doi: 10.1103/PhysRevE.79.031926. [DOI] [PMC free article] [PubMed] [Google Scholar]
- 57.Markvoort AJ, Smeijers AF, Pieterse K, van Santen RA, Hilbers PAJ. Lipid-based mechanisms for vesicle fission. J. Phys. Chem. B. 2007;111:5719–5725. doi: 10.1021/jp068277u. [DOI] [PubMed] [Google Scholar]
- 58.McWhirter JL, Ayton GS, Voth GA. Coupling field theory with mesoscopic dynamical simulations of multicomponent lipid bilayers. Biophys. J. 2004;87:3242–3263. doi: 10.1529/biophysj.104.045716. [DOI] [PMC free article] [PubMed] [Google Scholar]
- 59.Nelson DR, Piran T, Weinberg S, editors. Statistical Mechanics of Membranes and Surfaces. World Scientific; Singapore: 2004. [Google Scholar]
- 60.Noguchi H, Gompper G. Meshless membrane model based on the moving least-squares method. Phys. Rev. E. 2006;73:021903. doi: 10.1103/PhysRevE.73.021903. [DOI] [PubMed] [Google Scholar]
- 61.Pozrikidis C. Boundary Integral and Singularity Methods for Linearized Viscous Flow. Cambridge University Press; Cambridge: 1992. [Google Scholar]
- 62.Pozrikidis C. Interfacial dynamics for stokes flow. J. Comput. Phys. 2001;169:250. [Google Scholar]
- 63.Du Q, Zhang J. Adaptive finite element method for a phase field bending elasticity model of vesicle membrane deformations. SIAM J. Sci. Comput. 2008;30(3):1634–1657. [Google Scholar]
- 64.Ruiz-Argüello MB, Goñi FM, Alonso A. Vesicle membrane fusion induced by the concerted activities of sphingomyelinase and phospholipase c*. J. Biol. Chem. 1998;273(36):22977–22982. doi: 10.1074/jbc.273.36.22977. [DOI] [PubMed] [Google Scholar]
- 65.Saad Y, Schultz MH. Gmres: a generalized minimal residual algorithm for solving nonsymmetric linear systems. SIAM J. Sci. Stat. Comput. 1986;7:856–869. [Google Scholar]
- 66.Seifert U. Curvature-induced lateral phase segregation in two-component vesicles. Phys. Rev. Lett. 1993;70:1335–1338. doi: 10.1103/PhysRevLett.70.1335. [DOI] [PubMed] [Google Scholar]
- 67.Seifert U. Configurations of fluid membranes and vesicles. Adv. Phys. 1997;46:13–137. [Google Scholar]
- 68.Semrau S, Idema T, Holtzer L, Schmidt T, Storm C. Accurate determination of elastic parameters for multicomponent membranes. Phys. Rev. Lett. 2008;100:088101. doi: 10.1103/PhysRevLett.100.088101. [DOI] [PubMed] [Google Scholar]
- 69.Shillcock J, Lipowsky R. Tension-induced fusion of bilayer membranes and vesicles. Nat. Mater. 2005;4(3):225–228. doi: 10.1038/nmat1333. [DOI] [PubMed] [Google Scholar]
- 70.Smith KA, Upsal WE. Shear-driven release of a bud from a multicomponent vesicle. J. Chem. Phys. 2007;126:075102. doi: 10.1063/1.2435355. [DOI] [PubMed] [Google Scholar]
- 71.Solis FJ, Funkhouser CM, Thornton K. Conditions for overall planarity in membranes: applications to multicomponent membranes with lamellar morphology. Eur. Phys. Lett. 2008;82:38001. [Google Scholar]
- 72.Song P, Hu D, Zhang P. Numerical simulation of fluid membranes in two-dimensional space. Commun. Comput. Phys. 2008;3(4):794–821. [Google Scholar]
- 73.Stottrup BL, Stevens DS, Keller SL. Miscibility of ternary mixtures of phospholipids and cholesterol in monolayers, and application to bilayer systems. Biophys. J. 2005;88:269–276. doi: 10.1529/biophysj.104.048439. [DOI] [PMC free article] [PubMed] [Google Scholar]
- 74.Sukumaran S, Seifert U. Influence of shear flow on vesicles near a wall: a numerical study. Phys. Rev. E. 2001;64:011916. doi: 10.1103/PhysRevE.64.011916. [DOI] [PubMed] [Google Scholar]
- 75.Taniguchi T. Shape deformation and phase separation dynamics of two-component vesicles. Phys. Rev. Lett. 1996;76:4444–4447. doi: 10.1103/PhysRevLett.76.4444. [DOI] [PubMed] [Google Scholar]
- 76.Taniguchi T, Kawasaki K, Andelman D, Kawakatsu T. Phase transitions and shapes of two component membranes and vesicles: ii. Weak segregation limit. J. Phys. II. 1994;4(8):1333–1362. [Google Scholar]
- 77.Tian AW, Johnson C, Wang W, Baumgart T. Line tension at fluid membrane domain boundaries measured by micropipette aspiration. Phys. Rev. Lett. 2007;98:208102. doi: 10.1103/PhysRevLett.98.208102. [DOI] [PubMed] [Google Scholar]
- 78.Tornberg A-K, Shelley MJ. Simulating the dynamics and interactions of flexible fibers in stokes flows. J. Comput. Phys. 2004;196:8–40. [Google Scholar]
- 79.Tsafrir I, Sagi D, Arzi T, Guedeau-Boudeville MA, Frette V, Kandel D, Stavans J. Pearling instabilities of membrane tubes with anchored polymers. Phys. Rev. Lett. 2001;86(6):1138–1141. doi: 10.1103/PhysRevLett.86.1138. [DOI] [PubMed] [Google Scholar]
- 80.Veatch SL, Keller SL. Separation of liquid phases in giant vesicles of ternary mixtures of phospholipids and cholesterol. Biophys. J. 2003;85 doi: 10.1016/S0006-3495(03)74726-2. [DOI] [PMC free article] [PubMed] [Google Scholar]
- 81.Veerapaneni SK, Gueyffier D, Zorin D, Biros G. A Boundary Integral Method for Simulating the Dynamics of Inextensible Vesicles Suspended in a Viscous Fluid in 2d. preprint. [Google Scholar]
- 82.Wallace E, Hooper NM, Olmsted PD. The kinetics of phase separation in asymmetric membranes. Biophys. J. 2005;88:4072–4083. doi: 10.1529/biophysj.104.054288. [DOI] [PMC free article] [PubMed] [Google Scholar]
- 83.Wang XQ, Du Q. Modelling and simulations of multi-component lipid membranes and open membranes via diffuse interface approaches. J. Math. Biol. 2008;56:347–371. doi: 10.1007/s00285-007-0118-2. [DOI] [PubMed] [Google Scholar]
- 84.Yuan J, Hira SM, Strouse GF, Hirst LS. Lipid bilayer discs and banded tubules: photoinduced lipid sorting in ternary mixtures. J. Am. Chem. Soc. 2008;130:2067–2072. doi: 10.1021/ja710305c. [DOI] [PubMed] [Google Scholar]
- 85.Zhou H, Pozrikidis C. Deformation of liquid capsules with incompressible interfaces in simple shear flow. J. Fluid Mech. 1995;283:175–200. [Google Scholar]


