

Abstract
Objective
In order to characterize patterns of molecular expression that lead to cartilage formation in vivo in a post-natal setting, mRNA expression profiling was carried out across the timecourse of mechanically induced chondrogenesis.
Methods
Retired breeder Sprague-Dawley rats underwent production of a non-critical-size, transverse femoral osteotomy. Experimental animals (n=45) were subjected to bending stimulation (60° cyclic motion in the sagittal plane for 15 minutes/day) of the osteotomy gap beginning on post-operative day (POD) 10. Control animals (n=32) experienced continuous rigid fixation. mRNA isolated on POD 10, 17, 24, and 38 was analyzed using a microarray containing 608 genes involved in skeletal development, tissue differentiation, fracture healing, and mechanotransduction. The glycosaminoglycan (GAG) content of the stimulated tissues was compared to native articular cartilage as a means of assessing the progression of chondrogenic development of the tissues.
Results
The majority of the 100 genes that were differentially expressed were upregulated in response to mechanical stimulation. Many of these genes are associated with articular cartilage development and maintenance, diarthroidal joint development, cell adhesion, extracellular matrix synthesis, signal transduction, and skeletal development. Quantitative real-time PCR results were consistent with the microarray findings. The GAG content of the stimulated tissues increased over time and was no different from that of articular cartilage at POD 38.
Conclusions
The mechanical stimulation caused upregulation of genes principally involved in joint cavity morphogenesis and critical to articular cartilage function. Further study of this type of stimulation may identify key signaling events required for post-natal, hyaline cartilage formation.
Keywords: mechanobiology, tissue differentiation, bone healing, cartilage matrix, joint development
Articular cartilage injuries and degenerative joint diseases such as osteoarthritis pose significant treatment challenges due to the insufficiency of the natural repair response in damaged joint tissues. In recent years, techniques such as microfracture, osteochondral transplantation, and autologous chondrocyte implantation have shown promising clinical results but typically only in patients under age 40 (1–4). Moreover, concerns about the long-term durability of the repair tissue remain (2–5). One alternate approach for developing regenerative strategies for cartilage repair is to first elucidate the key cellular and molecular processes involved in the formation of joint tissues, either in utero or post-natally. These processes would then be logical targets in identifying possible new treatment regimens.
Prior investigations of the molecular processes of joint development in utero have established multiple, characteristic spatiotemporal patterns of gene expression and have suggested the importance of mechanical factors for formation and maintenance of articular cartilage. For example, uridine diphosphoglucose dehydrogenase (Ugdh), an essential enzyme in hyaluronan synthesis, and Cd44, the main cell surface receptor for hyaluronate, are upregulated in or near the presumptive joint surfaces just prior to segmentation (6). Following segmentation, collagen expression (types I, II, III, V, IX, X, and XI) varies with position within the joint but is relatively constant over time (7, 8), while wide variations in expression are seen both temporally and spatially for many proteoglycans (aggrecan, biglycan, decorin, fibromodulin), matrix metalloproteinases (Mmp2, Mmp9, and Mmp13), and matrix components such as cartilage oligomeric matrix protein (Comp) and matrillin 1 (9–11). Articular cartilage in utero does not initially exhibit the zonal variations in collagen fiber orientation that are the hallmark of the mature tissue architecture; rather the fibers are initially parallel to the joint surface throughout the depth of the chondral layer (12). It has been suggested that the transformation to zonal variations is modulated by mechanical loading of the joint in utero (12). Embryonic immobilization studies also indicate the importance of mechanical loading for joint development as demonstrated by reduced glycosaminoglycan (GAG) and collagen contents, reduced instantaneous compressive modulus (13), and a “ragged” surface of the immobilized articular cartilage (14), secondary fusion in cavitated joints, and failure to cavitate in uncavitated joints (14–16). Consistent with these findings, immobilization of diarthrodial joints post-natally results in decreased GAG content, increased proteoglycan proteolysis and MMP activity, accelerated advancement of the tidemark, and loss of tissue stiffness (reviewed in (17)).
In parallel with these in vivo observations, many studies have used an in vitro approach to determine the effects of mechanical stimulation on molecular expression during hyaline cartilage formation. Cyclic tensile strain increases hyaluronan synthesis, UGDH activity, and Cd44 expression (18). Compression and hydrostatic pressure result in increased expression of collagen type II, SRY (sex determining region Y)-box 9 (Sox9), and aggrecan, as well as increased proteoglycan synthesis and chondrogenic matrix deposition, by chondrocytes (e.g., (19, 20)) and mesenchymal stem cells (e.g., (21–23)). Thus, there is strong evidence that mechanical stimuli affect hyaline cartilage formation not just in utero but also post-natally. By extension, these data suggest an experimental approach in which mechanical loading is used to promote cartilage formation in the mature or aged skeleton, as a means of studying the underlying molecular processes and of the possibilities for improving the long-term viability and durability of the cartilage that forms.
Bone fracture healing provides a viable model for this type of approach for two reasons. First, prior studies have demonstrated that altering the mechanical environment of a healing fracture, such as by applying increased compressive, shear, or bending movements at the fracture site, can result in increased amounts of cartilage in the fracture callus (24–28). In particular, an oscillatory bending motion applied at the fracture site promotes formation of cartilage with abundant type II collagen expression and zonal variations in collagen fiber orientation similar to those found in articular cartilage (26, 29). Second, fracture healing is a regenerative process that in many ways recapitulates aspects of skeletal development (30–32). Study of the molecular events involved in mechanically induced chondrogenesis during fracture healing therefore may offer insight into key processes necessary for post-natal cartilage formation, repair, and regeneration.
The overall goal of this study was to profile the mRNA expression patterns that occur during mechanically induced chondrogenesis in a fracture healing model. Building upon prior work that investigated how application of a bending motion to a healing fracture alters expression of a small set of cartilage- and bone-related genes (29), this study investigated the effects on a broader set of genes via transcriptional profiling with a custom microarray. These analyses were complemented with measurements of glycosaminoglycan content in order to provide a functional assessment of the newly formed cartilage tissue.
MATERIALS AND METHODS
Surgery and Stimulation Protocol
Retired male breeder Sprague-Dawley rats (n = 91, ~500 g) underwent production of a 1.5mm, mid-diaphyseal, transverse femoral osteotomy followed by stabilization with a custom-designed external fixator (Supplemental Figure 1) as described previously (29). Experimental animals were subjected to daily bending stimulation of the osteotomy gap, whereas control animals experienced continuous rigid fixation. The stimulation protocol consisted of a 60° (+35°/−25°) cyclic bending motion in the sagittal plane applied via a servomotor-driven linkage system at a frequency of 1 Hz for 15 minutes daily. Following a 10-day latency period, this protocol was administered on five consecutive days followed by two days of rest each week for 1, 2, or 4 weeks. Prior characterization of this animal model has shown that over the four-week timecourse, large, contiguous volumes of cartilage develop within and surrounding the osteotomy gap (29). Small volumes of fibrocartilage form at the very periphery of the callus, and bone formation is restricted to the periosteal surface of the cortex, away from the gap. In contrast, with continuous rigid fixation, only small and isolated regions of cartilage form. These regions subsequently undergo endochondral ossification, and the gap is bridged by bone by the four-week timepoint.
All animal care and experimental protocols were followed in accordance with NIH guidelines and were approved by our institution’s Animal Care and Use Committee. A total of 14 animals were excluded from the study due to surgical complications, inflection, or loosening of the pins, leaving 45 experimental and 32 control animals.
RNA Isolation
Callus tissue between the two inner pins was retrieved on post-operative days 10, 17, 24, and 38 (n=6–10 animals/group) and powdered under liquid nitrogen with a mortar and pestle. Total RNA was extracted with Tri-ReagentTM (Molecular Research Center Inc., Cincinnati, OH). RNA integrity was verified by visualization of ribosomal RNAs with GelstarR Nucleic Acid Stain (Cambrex Bioscience, Inc., Rockland, ME) after denaturing RNA gel electrophoresis.
Gene Expression Analysis by Microarray
Through an extensive literature search, candidate genes (n = 608) involved in skeletal tissue differentiation, skeletal development, fracture healing, and mechanotransduction were identified and used to create a custom-designed microarray gene chip. An additional 98 genes were included from an established set of “reference genes” (Affymetrix Rat Genome 230 2.0 Array Normalization Genes, Affymetrix, Santa Clara, CA). The expression levels of these genes were not expected to change with treatment (stimulated vs. continuous fixation). For internal quality control, 76 spots on the chip did not contain any gene probe and were left blank. The specific mRNA unigene identifiers were compiled using the National Center for Biotechnology Information website (http://www.ncbi.nlm.nih.gov/). These identifiers were used to design oligomers as described below. Oligonucleotide design, synthesis, chip spotting, and chip hybridization were carried out at the Boston University Microarray Resource.
Oligonucleotides 50 bases in length (50mers) were designed for each gene using PICK70 v3.0 (http://arrayoligosel.sourceforge.net). The best candidate 50mers from each sequence were selected such that all the oligos had roughly the same GC content (average GC= 43%; SD=11%), minimal secondary structure, and equivalent binding energy (average binding energy = 82 kcal/mol; SD = 6 kcal/mol), and to maximize their uniqueness within the transcriptome. For several of the genes, it was not possible to design oligos that did not potentially cross-hybridize to transcripts from multiple loci. None of these showed significant differential expression in the experiments in this study
Oligonucleotides were synthesized using the ABI 3900 DNA Synthesizer (Applied Biosystems, Foster City, CA) on a 200 nmol scale using standard phorphoramidite chemistry. In addition to the preselected genes, SpotReport Alien Oligo sequences (Stratagene, La Jolla, CA) and solvent blanks were spotted. Oligonucleotides were spotted in duplicate with a QArraymini (Genetix, Boston, MA) using Stelth SMP4 pins (Telechem, Sunnyvale, CA) onto Codelink slides (Amersham Biosciences, Piscataway NJ).
Messenger RNA samples were reversed transcribed into cDNA, and the amino allyl-modified aRNAs generated from the cDNA were labeled with Cy3- and Cy5-N-hydroxysuccinimide ester fluorescent dyes (Amersham Biosciences; Piscataway, NJ). The labeling scheme followed a dye-swapping design (33), where both the Cy3- and Cy5-labeled RNA from each sample were hybridized to arrays using a semi-random scheme that excluded the possibility of the Cy3 and Cy5 labeled material from a single sample being hybridized to the same array. Details of the labeling, hybridization, washing steps are provided in the Supplemental Data.
Arrays were scanned on a ScanArray Express (PerkinElmer, Boston, MA). Signal intensities were adjusted visually by changing the gain on the detector in order to keep the probe hybridization intensities within the dynamic range of the detector, and an initial filtering step was performed to exclude spots with poor hybridization (below detection levels). Genes for which the spot intensity was below detection levels on more than 50% of the chips were excluded from further analysis. In order to reduce the influence of artifactual sources of variation that can affect measured gene expression levels, a lowess normalization procedure (34) was applied using all genes, because the signal intensities of the normalization genes did not uniformly span the entire range of observed intensities.
Post-normalization analysis involved identification of differentially expressed genes and identification of genes with similar patterns of expression. We performed a three-way analysis of variance (ANOVA) (35) with time, treatment, and dye as the three factors. The only interaction term included was that for treatment*time. A false discovery rate (FDR) was calculated for each p-value to correct for multiple comparisons. Any gene with an FDR≥0.05 was excluded from further analysis. Pairwise differences among groups were identified via Dunn-Sidák multiple comparisons analyses (Matlab R2007a, Mathworks, Natick, MA). One-dimensional hierarchal clustering was performed using the absolute value of the correlation coefficient and average centroid linkage (Cluster and Treeview, http://rana.lbl.gov/EisenSoftware.htm). This choice of cluster metric allowed genes with similar and also nearly opposite patterns to be clustered together. The differentially expressed genes were also grouped according to gene ontology (GO) terms.
Real-time, Reverse-Transcription Polymerase Chain Reaction (qPCR)
Based on histology and preliminary molecular analyses (29) showing peak cartilage formation and gene expression at day 24, this timepoint was chosen for validation of the microarray results as well as further exploration of expression of several key cartilage-related genes that were excluded from the analysis of the array data based on the quality control measures described above. Quantitative real time polymerase chain reaction (ABI PRISM 7700 sequence detection system) was performed on mRNA isolated from the mechanically stimulated callus tissue (day 24, n=4), rigidly fixed control callus tissue (day 24, n=4), native whole bone (n=3), and articular cartilage (n=4). Gene-specific probes were used to label aggrecan, lubricin (Prg4), collagen type IX (Col9a1), Sox9, Ugdh, and L32 (Applied Biosystems; Supplemental Table 1). The CT value of each gene was normalized to that of L32 (ΔCT) and resulting relative expression values were transformed into the linear space using 2-ΔCT. Triplicates for each sample were then averaged. Comparison of relative expression among groups was performed via Kruskal-Wallis nonparametric ANOVA followed by a Dunn-Sidák post hoc test.
Glycosaminoglycan (GAG) Content
Mechanically stimulated callus tissues were analyzed for glycosaminoglycan content at post-operative days 10, 24, and 38 (n=3, 5, 7 respectively) and compared to glycosaminoglycan content of articular cartilage. Control (continuous fixation) specimens were excluded from these analyses because of the very limited amount of cartilage that was observed to form in these specimens (29).
Articular cartilage was harvested from the proximal tibia of contralateral limbs (n=29). Cylindrical cartilage/bone plugs (~2mm diameter) were cored from the tibial plateau, and the disc of articular cartilage was isolated with the aid of a dissecting microscope. Discs were pooled into three groups (n=8, 9, and 12 tibiae/group), and each group was analyzed separately.
Following papain digestion (P3125, Sigma, St. Louis, MO), the GAG contents of the mechanically stimulated callus tissue and isolated articular cartilage were analyzed using a commercially available dimethylmethylene blue (DMMB) assay kit (Blyscan, Biocolor Ltd, Newtownabbey, N. Ireland). A Kruskal-Wallis nonparametric ANOVA followed by a Dunn-Sidák post hoc test was used to compare GAG content among groups.
RESULTS
Microarray assays
Out of the 474 genes (including reference genes) that remained after initial filtering of spots with below-background hybridization intensity, 100 were differentially expressed between treatments, 13 were differentially expressed only over time, and four were differentially expressed with respect to an interaction between treatment and time (Figure 1A, Supplemental Tables 2 and 3). The great majority of these genes (94 genes) were upregulated in response to the stimulation (Figure 1A, Table 1). Hierarchical clustering of the differentially expressed genes resulted in 12 main patterns of differential gene expression, two of which contained a total of 84 of the upregulated genes (Clusters G and H, Figure 1A). One of these clusters (Cluster G) contained genes with gene ontology (GO) terms including cell proliferation, proteolysis, skeletal development, and cell early response. The other (Cluster H) contained genes involved in collagen binding, GAG binding, cartilage development, cartilage extracellular matrix, apoptosis, and cell proliferation. Only one cluster (Cluster D) showed an overall downregulation in response to the mechanical stimulation. GO terms associated with these downregulated genes include cytoskeleton protein binding, catalytic activity, and membrane-bound organelle. A complete list of all differentially expressed genes and their clusters can be found in the Supplemental Data (Supplemental Table 3).
Figure 1.

(A) Heatmap of the 119 differentially expressed genes, organized from top to bottom by hierarchical clustering. The color coding corresponds to the z-scores of the intensities. The hierarchical clustering dendrogram is shown to the left, with the horizontal axis indicating the degree of dissimilarity. Twelve clusters (a-l) were defined such that all nodes to the right of the open arrows are considered to be sufficiently similar to each other so as to represent a relatively homogeneous pattern of gene expression. The genes in each of these clusters are listed in Supplemental Table 3. (B) Examples of GO terms for the differentially expressed genes and the corresponding numbers of genes that were up/downregulated by stimulation.
Table 1.
Genes with highly significant (FDR<0.01) differential expression in mechanically stimulated callus tissues as compared to continuous fixation callus tissues. For brevity, only one GO term is presented for each gene. Clusters are labeled as in Figure 1A. A complete list of all genes that were differentially expressed (FDR<0.05) is given in Supplemental Table 3.
| Cluster | Gene Name | Abbreviation | GO Term |
|---|---|---|---|
| Upregulated | |||
| D | Adipose differentiation related protein | ADFP | lipid metabolism |
| F | Bone morphogenetic protein receptor type II | BMPR2 | skeletal development |
| D | Cadherin 11 | CDH11 | ossification |
| B | CDK103 | CDK103 | - |
| C | Chemokine (C-C motif) ligand 7 | CCL7 | glycosaminoglycan binding |
| C | Chemokine (C-X-C motif) ligand 13 | CXCL13 | inflammatory response |
| F | Chitinase 3-like 1 | CHI3L1 | polysaccharide metabolism |
| E | Chloride intracellular channel 2 | CLIC2 | ion transport |
| G | Chloride intracellular channel 4 | CLIC4 | ion transport |
| E | Cartilage linking protein | CTRL1 | glycosaminoglycan binding |
| F | Clusterin | CLU | transcription |
| F | Cyclin L1 | CCNL1 | transcription |
| C | Eukaryotic translation elongation factor 1a1 | EEF1A1 | translation |
| E | Fatty acid binding protein 5 | FABP5 | fatty acid binding |
| E | Ferritin, heavy polypeptide 1 | FTH1 | immune response |
| C | Fibroblast growth factor 7 | FGF7 | cell proliferation |
| D | Fibroblast growth factor inducible 14 | FIN14 | translation |
| A | Glutaminase | GLS | cell differentiation |
| E | Heat shock protein 5 | HSPA5 | anti-apoptosis |
| C | Hypoxia-inducible factor 1, alpha subunit | HIF1A | transcription |
| F | Interleukin 6 signal transducer | IL6ST | cell proliferation |
| F | Lysyl oxidase | LOX | collagen fibril organization |
| D | Lysyl oxidase-like 2 | LOXL2 | cell adhesion |
| C | Matrix metalloproteinase 13 | MMP13 | collagenase activity |
| C | Matrix metalloproteinase 3 | MMP3 | proteolysis |
| D | Myosin light chain C | MYC | transcription |
| D | Osteoglycin | OGN | growth factor activity |
| D | Parathyroid hormone-like peptide | PTHLH | osteoblast development |
| F | Patched homolog 1 | PTCH | hedgehog receptor activity |
| E | Phospholipase A2, group IB | PLA2G1B | phospholipase activity |
| F | Platelet-derived growth factor alpha | PDGFA | angiogenesis |
| D | Proteoglycan 4 (Lubricin) | PRG4 | cell proliferation |
| F | RGD1305185 | RGD1305185 | - |
| C | Ribonucleic acid binding protein 1 | RBP1 | retinol binding |
| F | Runt related transcription factor 1 | RUNX1 | transcription factor |
| D | Runt-related transcription factor 2 | RUNX2 | transcription factor |
| E | Serpin peptidase inhibitor, member 1 | SERPINH1 | collagen binding |
| C | Toll-like receptor 2 | TLR2 | peptidoglycan binding |
| E | Transmembrane protein 49 | TMEM49 | integral to membrane |
| E | Tumor necrosis factor (ligand) superfamily, member 11 | TNFSF11 | bone resorption |
| D | Tumor necrosis factor receptor superfamily, member 1B | TNFRSF1B | apoptosis |
| D | Ubiquitin-conjugating enzyme E2B | UBE2B | ligase activity |
| D | Uridine phosphorylase | UPP | nucleotide catabolic process |
| D | Wingless-type MMTV integration site family, member 11 | WNT11 | signal transduction |
| C | WNT1 inducible signaling pathway protein 2 | WISP2 | regulation of cell growth |
| Downregulated | |||
| B | Actinin alpha 3 | ACTN3 | actin binding |
| B | ATPase, Ca++ transporting, cardiac muscle, fast twitch 1 | ATP2A1 | hydrolase activity |
| B | Cadherin 4 | CDH4 | blood vessel development |
| B | COPII-associated small GTPase | SAR1A | nucleotide binding |
| B | Discoidin domain receptor family, member 2 | DDR2 | cell proliferation |
| B | Mitogen activated protein kinase 7 | MAPK7 | angiogenesis |
Irrespective of clustering, many of the genes that were upregulated are known to be involved in cartilage development, cell communication, cell adhesion, extracellular matrix synthesis, signal transduction, and skeletal development (Figure 1B). The patterns of several genes that are unique to cartilage, skeletal tissue and joint formation are shown in Figures 2 and 3. For example, Col9a1, which is necessary for articular cartilage maintenance (36), exhibited a peak in expression at day 24 in stimulated but not control specimens (Figure 2A). Collagen type V (Col5a1), which is expressed pericellularly in articular cartilage during joint development (7), exhibited an overall upregulation in stimulated specimens (Figure 2B). Prg4, which encodes a proteoglycan necessary for boundary lubrication in articular cartilage (37), showed a four-fold induction in stimulated specimens as compared to controls at day 24 (Figure 2C). Genes encoding GAG binding proteins such as cartilage linking protein 1 (Crtl1) (Figure 2D), follistatin-like protein 1 (Fstl1), and chemokine ligand 7 (Ccl7) (data not shown) were upregulated at multiple timepoints. Bmp1, a developmental protease that can induce chondrogenesis in vivo (38) and that coordinates matrix deposition and activation of other BMPs during skeletal morphogenesis (39), was also more highly expressed in stimulated than control specimens (Figure 3A), as were genes involved in diarthrodial joint development and function (Figure 3B–D).
Figure 2.

mRNA expression, as quantified by microarray analysis, of significantly differentially expressed genes encoding for cartilage matrix proteins and genes involved in GAG binding. The height of each bar represents the group mean, and error bars indicate one standard deviation. * = significant difference (p<0.05) for pairwise comparison. In the case of panel B (Col5a1), a significant effect of treatment was found in the ANOVA (p=0.02), but no pairwise differences were found between treatment groups at individual timepoints.
Figure 3.

mRNA expression, as quantified by microarray analysis, of selected, significantly differentially expressed genes involved in joint development and skeletal development. The height of each bar represents the group mean, and error bars indicate one standard deviation. * = significant difference (p<0.05) for pairwise comparison
qPCR
For all five genes examined by qPCR, the highest expression levels were found in the stimulated tissue and articular cartilage (Figure 4). The lowest expression levels were found in the bone tissue, and the control callus tissue exhibited intermediate expression levels. Either significant differences (p<0.05) or trends toward differences (0.05≤p≤0.08) were found between stimulated and control callus tissues for all genes except for Sox9. In addition, for all genes except for Prg4, no differences in expression were found between the stimulated callus tissue and articular cartilage, and no differences in expression were found between the control tissue and bone.
Figure 4.

qPCR results for three genes (Col9a1, Prg4, Ugdh) that the microarray analyses identified as differentially expressed between stimulated and control (continuous fixation) callus tissues and for two, important cartilage genes (Sox9 and aggrecan) that were not included in the final microarray analyses due to poor hybridization results on more than half (16) of the chips. The height of each bar represents the group mean, and error bars indicate one standard deviation. “AC” = articular cartilage; “Stim” = mechanically stimulated callus tissue; “CFix” = continuous fixation callus tissue; “Bone” = whole bone. * = significant difference (p<0.05); # = trend towards a difference (0.05≤p≤0.08)
Glycosaminoglycan content
Total, sulfated GAGs increased steadily over the timecourse of the bending stimulation (p<0.001) (Figure 5). Prior to the start of stimulation (day 10), the GAG content was only 11.9% of that of articular cartilage. However, following four weeks of stimulation (day 38), the GAG content of callus tissues was no different from that of articular cartilage (p=0.95).
Figure 5.
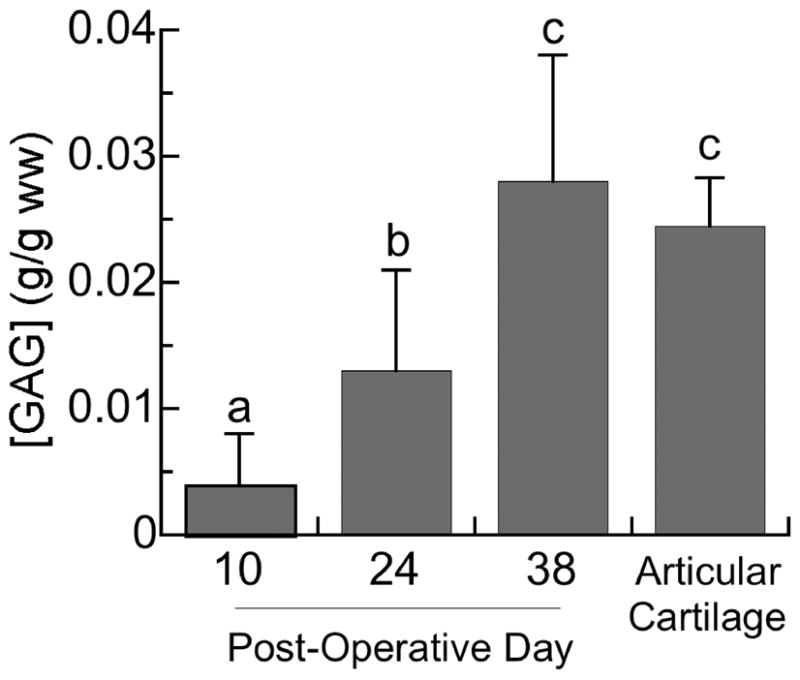
GAG content, expressed in grams per gram wet weight of tissue (g/g ww), for rat articular cartilage from the proximal tibia and for the mechanically stimulated callus tissues just prior to the onset of stimulation (day 10) and after two and four weeks of stimulation (days 24 and 38, respectively). The height of each bar represents the group mean, and error bars indicate one standard deviation. Bars labeled with different letters are significantly different (p<0.05) from one another.
DISCUSSION
Characterization of molecular expression patterns during post-natal cartilage formation provides novel insight into strategies that might be used for cartilage repair and regeneration. As such, the overall goal of this study was to profile mRNA expression patterns that occur during mechanically induced chondrogenesis in an adult animal. The microarray results indicate that the applied mechanical stimulation substantially altered expression patterns of numerous genes in the tissues within and surrounding the bone defect. The cohort of genes upregulated with stimulation contained a large representation of cartilage-related genes, including those necessary for hyaline cartilage function, GAG binding, and diarthrodial joint development. The qPCR results were consistent with the microarray data and further demonstrated that the mechanical stimulation resulted in mRNA expression patterns more similar to those of articular cartilage than bone. Analysis of the GAG content also indicated similarities between the mechanically stimulated callus tissues after four weeks of stimulation and articular cartilage. Taken together, these results demonstrate the potent effect of mechanical stimulation on molecular expression patterns and the ability of this stimulus to promote formation of cartilaginous tissue with both molecular and compositional similarities to articular cartilage.
The principal strength of this study was the investigation of a large but targeted set of genes. By using a custom-designed microarray, we were able to screen numerous genes that have been shown to be differentially expressed during skeletal development, fracture healing, skeletal tissue differentiation, and mechanotransduction. This approach served to characterize how expression of this specific set of genes can be modulated by mechanical factors and, in particular, which of these genes are involved in mechanically induced chondrogenesis. Moreover, with this approach, the resulting data may be mined as part of future studies that investigate the mechanotransduction mechanisms involved in this type of chondrogenesis as well as the possibilities for achieving functional hyaline cartilage post-natally. The small cohort of genes selected for analysis via qPCR were chosen in part to validate the microarray results and in part to provide additional exploration of the molecular mechanisms involved in the type of cartilage formation that we have observed in this animal model. An additional strength of this study was inclusion of GAG analyses, which provided strong evidence that the upregulation of many genes involved in hyaline cartilage formation resulted in translational events necessary for normal hyaline cartilage tissue formation and function. Future work with this animal model will include biochemical analyses of total collagen content and of the ratio of type II to type I collagen, as these characteristics are also known to be important for tissue function (40, 41).
This study also had several limitations. Most notably, it is unclear whether the mechanically regulated chondrogenesis that was observed within a healing osteotomy gap can be achieved at a joint surface or if the cellular and molecular mechanisms involved in this chondrogenic response are specific to the local milieu associated with the femoral mid-diaphysis. Probing this issue further will shed light on the extent to which these results can be extended to diarthrodial joints. Second, because articular cartilage and intact bone were included in the qPCR analyses but not the microarray analyses, the latter were thus restricted to investigating the effect of the mechanical stimulation and did not enable direct comparison of the transcriptional response of the stimulated tissue to that of articular cartilage or intact bone. Third, mRNA was isolated from the entire callus, which includes not only cartilage and newly formed woven bone, but also many other types of tissues, such as mature cortical bone, marrow, fibrocartilage and vascular elements. Further investigations using in situ hybridization would provide some insight into the spatial location of mRNA expression and the possible localization of certain transcripts to a particular tissue. Fourth, because we isolated the mRNA approximately 24 hours after the last stimulation period, we were unable to identify transient changes in gene expression immediately following the stimulation. Fifth, while microarray analyses enable simultaneous investigation of a large number of genes, this technique can be less sensitive than qPCR or ribonuclease protection assays (RPAs). For example, prior analyses of gene expression patterns in this animal model were carried out on a much smaller number of genes using RPAs. The difference in sensitivity is apparent when considering the seven genes that were successfully examined in both studies: of these seven, six were identified as differentially expressed by RPAs but only two by microarray analysis. Finally all animal experiments were performed on aged animals, which exhibit a delayed healing response (42). However, all experiments used age-matched controls, and we believe that older animals are highly relevant subjects for investigation of possibilities for cartilage repair and regeneration in the aged skeleton.
Examination of the microarray results indicates that the overall stimulation-induced upregulation of cartilage matrix genes was concentrated at days 24 and 38. This finding is consistent not only with the observed temporal increase in GAG content but also with prior analyses of this animal model that showed an increase over time in the amount of cartilage present in the callus, a peak at day 24 in collagen type II expression, and an almost six-fold greater cartilage volume in the stimulated specimens as compared to controls (29). We note, however, that in the present study, no difference in Sox9 expression was found between stimulated and control tissues at day 24, even though differences were found in expression of genes that are under transcriptional control of Sox9 (e.g. Col9a1, aggrecan, and Crtl1) (43–45). It is likely that a peak in Sox9 expression occurred prior to day 24 in the stimulated tissues and that the differences that were observed at day 24 include downstream effects of Sox9.
The suite of differentially expressed genes identified in this study provides interesting comparisons to expression patterns reported previously in studies of chondrocyte differentiation. For example, a number of the genes that were upregulated with the applied bending motion are also differentially expressed in differentiated vs. dedifferentiated human fetal epiphyseal chondrocytes (HFCs) in vitro (46). Of these genes, aggrecan, hypoxia-inducible factor 1α, decorin, Col5a1, Crtl1, matrilin 3, and Comp were more highly expressed in differentiated HFCs, and chitinase 3-like protein 1 (Chi3l1), Cd44, and cadherin 11 (Cdh11) were more highly expressed in dedifferentiated HFCs. While Cdh11 has been associated with mineralized nodule formation by chondrocytes and has been found to be expressed in growth plate, but not articular, chondrocytes (47), Cd44 has been identified as a marker of cells with high chondrogenic potential as defined by high levels of GAG synthesis (48).
The set of upregulated genes in the present study also contained some overlap with sets of genes identified in a prior comparison of expression profiles of human articular cartilage and meniscus (49). The overlap included Col9a1 (more highly expressed in articular cartilage than meniscus), lysyl oxidase (Lox) (more highly expressed in meniscus than articular cartilage), Comp and Mmp3 (both more highly expressed in articular cartilage and meniscus as compared to 29 other normal human tissues). Collectively, these data suggest that the cartilage in the present study has some similarities in molecular expression to hyaline cartilage, particularly with respect to several collagenous proteins and other key matrix constituents such as proteoglycans. However, similarities to fibrocartilage and physeal tissues were also found in terms of upregulation of the gene encoding for the cross-linking enzyme Lox and that for cadherins such as Cdh11 that have been localized to the hypertrophic zone of the growth plate (50). Chondrocyte hypertrophy and subsequent apoptosis and tissue mineralization are characteristic of endochondral ossification in fracture healing (31). The observed upregulation of cadherins in the present study, together with the lack of mineralization of the newly formed cartilage, suggests that the applied bending motion may inhibit the later stages of the endochondral process that is the default response of the fractured bone. These preliminary comparisons to different types of cartilage tissues serve to motivate a future investigation in which the experimental design directly compares the gene expression profile of the bending-stimulated cartilage to those of articular cartilage, fibrocartilage, and physeal cartilage for a much larger set of genes than was used in the qPCR in the present study.
The findings of this study should also be considered in the context of current understanding of the effects of mechanical factors on skeletal tissue differentiation and morphogenesis. While many aspects of skeletal healing and development are profoundly affected by mechanical cues, and while bone healing is recognized as a regenerative process, whether mechanical stimuli can promote regeneration of different types of mesenchymally derived tissues remains an open question. Our data show a mechanically induced upregulation of genes principally involved in joint cavity morphogenesis and skeletal development and of genes critical to articular cartilage function. These results suggest that the applied bending motion does more than simply inhibit bone healing and that it may be possible to use mechanical stimulation to developmentally direct at least a partial recapitulation of processes involved in diarthrodial joint development. As such, further study of the effects of this type of stimulation may identify key signaling events required for post-natal, hyaline cartilage formation or maintenance.
Supplementary Material
Acknowledgments
Funding was provided by NIH AR053353 (EFM).
Grant Support: NIH AR053353 (EFM)
References
- 1.Asik M, Ciftci F, Sen C, Erdil M, Atalar A. The microfracture technique for the treatment of full-thickness articular cartilage lesions of the knee: midterm results. Arthroscopy. 2008;24(11):1214–20. doi: 10.1016/j.arthro.2008.06.015. [DOI] [PubMed] [Google Scholar]
- 2.Gudas R, Kalesinskas RJ, Kimtys V, Stankevicius E, Toliusis V, Bernotavicius G, et al. A prospective randomized clinical study of mosaic osteochondral autologous transplantation versus microfracture for the treatment of osteochondral defects in the knee joint in young athletes. Arthroscopy. 2005;21(9):1066–75. doi: 10.1016/j.arthro.2005.06.018. [DOI] [PubMed] [Google Scholar]
- 3.Knutsen G, Drogset JO, Engebretsen L, Grontvedt T, Isaksen V, Ludvigsen TC, et al. A randomized trial comparing autologous chondrocyte implantation with microfracture. Findings at five years. J Bone Joint Surg Am. 2007;89(10):2105–12. doi: 10.2106/JBJS.G.00003. [DOI] [PubMed] [Google Scholar]
- 4.Kreuz PC, Erggelet C, Steinwachs MR, Krause SJ, Lahm A, Niemeyer P, et al. Is microfracture of chondral defects in the knee associated with different results in patients aged 40 years or younger? Arthroscopy. 2006;22(11):1180–6. doi: 10.1016/j.arthro.2006.06.020. [DOI] [PubMed] [Google Scholar]
- 5.Revell CM, Athanasiou KA. Success Rates and Immunologic Responses of Autogenic, Allogenic, and Xenogenic Treatments to Repair Articular Cartilage Defects. Tissue Eng Part B Rev. 2008 doi: 10.1089/ten.teb.2008.0189. [DOI] [PMC free article] [PubMed] [Google Scholar]
- 6.Dowthwaite GP, Edwards JC, Pitsillides AA. An essential role for the interaction between hyaluronan and hyaluronan binding proteins during joint development. J Histochem Cytochem. 1998;46(5):641–51. doi: 10.1177/002215549804600509. [DOI] [PubMed] [Google Scholar]
- 7.Bland YS, Ashhurst DE. Development and ageing of the articular cartilage of the rabbit knee joint: distribution of the fibrillar collagens. Anat Embryol (Berl) 1996;194(6):607–19. doi: 10.1007/BF00187473. [DOI] [PubMed] [Google Scholar]
- 8.Morrison EH, Ferguson MW, Bayliss MT, Archer CW. The development of articular cartilage: I. The spatial and temporal patterns of collagen types. J Anat. 1996;189 ( Pt 1):9–22. [PMC free article] [PubMed] [Google Scholar]
- 9.Gepstein A, Shapiro S, Arbel G, Lahat N, Livne E. Expression of matrix metalloproteinases in articular cartilage of temporomandibular and knee joints of mice during growth, maturation, and aging. Arthritis Rheum. 2002;46(12):3240–50. doi: 10.1002/art.10690. [DOI] [PubMed] [Google Scholar]
- 10.Kavanagh E, Ashhurst DE. Development and aging of the articular cartilage of the rabbit knee joint: Distribution of biglycan, decorin, and matrilin-1. J Histochem Cytochem. 1999;47(12):1603–16. doi: 10.1177/002215549904701212. [DOI] [PubMed] [Google Scholar]
- 11.Murphy JM, Heinegard R, McIntosh A, Sterchi D, Barry FP. Distribution of cartilage molecules in the developing mouse joint. Matrix Biol. 1999;18(5):487–97. doi: 10.1016/s0945-053x(99)00042-6. [DOI] [PubMed] [Google Scholar]
- 12.Archer CW, Dowthwaite GP, Francis-West P. Development of synovial joints. Birth Defects. Res Part C Embryo Today. 2003;69(2):144–55. doi: 10.1002/bdrc.10015. [DOI] [PubMed] [Google Scholar]
- 13.Mikic B, Isenstein AL, Chhabra A. Mechanical modulation of cartilage structure and function during embryogenesis in the chick. Ann Biomed Eng. 2004;32(1):18–25. doi: 10.1023/b:abme.0000007787.39262.a7. [DOI] [PubMed] [Google Scholar]
- 14.Osborne AC, Lamb KJ, Lewthwaite JC. Short-term rigid and flaccid paralyses diminish frowth of embryonic chick limbs and abbrogate joint cavity formation but differentially preserve pre-cavitated joints. Journal of Musculoskeletal and Neuron Interactions. 2002;2:448–456. [PubMed] [Google Scholar]
- 15.Fell HB, Canti RG. Experiments on the development in vitro of the avian knee joint. Proceedings of the Royal Society. 1934;B116:316–351. [Google Scholar]
- 16.Drachman DB, Sokoloff L. The role of movement in embyonic joint development. Developmental Biology. 1966;14:401–420. [Google Scholar]
- 17.Vanwanseele B, Lucchinetti E, Stussi E. The effects of immobilization on the characteristics of articular cartilage: current concepts and future directions. Osteoarthritis Cartilage. 2002;10(5):408–19. doi: 10.1053/joca.2002.0529. [DOI] [PubMed] [Google Scholar]
- 18.Dowthwaite GP, Ward AC, Flannely J, Suswillo RF, Flannery CR, Archer CW, et al. The effect of mechanical strain on hyaluronan metabolism in embryonic fibrocartilage cells. Matrix Biol. 1999;18(6):523–32. doi: 10.1016/s0945-053x(99)00044-x. [DOI] [PubMed] [Google Scholar]
- 19.Smith RL, Rusk SF, Ellison BE, Wessells P, Tsuchiya K, Carter DR, et al. In vitro stimulation of articular chondrocyte mRNA and extracellular matrix synthesis by hydrostatic pressure. J Orthop Res. 1996;14(1):53–60. doi: 10.1002/jor.1100140110. [DOI] [PubMed] [Google Scholar]
- 20.Quinn TM, Grodzinsky AJ, Buschmann MD, Kim YJ, Hunziker EB. Mechanical compression alters proteoglycan deposition and matrix deformation around individual cells in cartilage explants. J Cell Sci. 1998;111 ( Pt 5):573–83. doi: 10.1242/jcs.111.5.573. [DOI] [PubMed] [Google Scholar]
- 21.Takahashi I, Nuckolls GH, Takahashi K, Tanaka O, Semba I, Dashner R, et al. Compressive force promotes sox9, type II collagen and aggrecan and inhibits IL-1beta expression resulting in chondrogenesis in mouse embryonic limb bud mesenchymal cells. J Cell Sci. 1998;111 ( Pt 14):2067–76. doi: 10.1242/jcs.111.14.2067. [DOI] [PubMed] [Google Scholar]
- 22.Mauck RL, Byers BA, Yuan X, Tuan RS. Regulation of cartilaginous ECM gene transcription by chondrocytes and MSCs in 3D culture in response to dynamic loading. Biomech Model Mechanobiol. 2007;6(1–2):113–25. doi: 10.1007/s10237-006-0042-1. [DOI] [PubMed] [Google Scholar]
- 23.Angele P, Schumann D, Angele M, Kinner B, Englert C, Hente R, et al. Cyclic, mechanical compression enhances chondrogenesis of mesenchymal progenitor cells in tissue engineering scaffolds. Biorheology. 2004;41(3–4):335–46. [PubMed] [Google Scholar]
- 24.Le AX, Miclau T, Hu D, Helms JA. Molecular aspects of healing in stabilized and non- stabilized fractures. J Orthop Res. 2001;19(1):78–84. doi: 10.1016/S0736-0266(00)00006-1. [DOI] [PubMed] [Google Scholar]
- 25.Goodship AE, Kenwright J. The influence of induced micromovement upon the healing of experimental tibial fractures. J Bone Joint Surg Br. 1985;67(4):650–5. doi: 10.1302/0301-620X.67B4.4030869. [DOI] [PubMed] [Google Scholar]
- 26.Cullinane DM, Salisbury KT, Alkhiary Y, Eisenberg S, Gerstenfeld L, Einhorn TA. Effects of the local mechanical environment on vertebrate tissue differentiation during repair: does repair recapitulate development? J Exp Biol. 2003;206(Pt 14):2459–71. doi: 10.1242/jeb.00453. [DOI] [PubMed] [Google Scholar]
- 27.Claes L, Eckert-Hubner K, Augat P. The effect of mechanical stability on local vascularization and tissue differentiation in callus healing. J Orthop Res. 2002;20(5):1099–105. doi: 10.1016/S0736-0266(02)00044-X. [DOI] [PubMed] [Google Scholar]
- 28.Epari DR, Schell H, Bail HJ, Duda GN. Instability prolongs the chondral phase during bone healing in sheep. Bone. 2006;38(6):864–70. doi: 10.1016/j.bone.2005.10.023. [DOI] [PubMed] [Google Scholar]
- 29.Salisbury Palomares KT, Gleason RE, Mason ZD, Cullinane DM, Einhorn TA, Gerstenfeld LC, et al. Mechanical stimulation alters tissue differentiation and molecular expression during bone healing. J Orthop Res. 2009;27(9):1123–1132. doi: 10.1002/jor.20863. [DOI] [PMC free article] [PubMed] [Google Scholar]
- 30.Ferguson C, Alpern E, Miclau T, Helms JA. Does adult fracture repair recapitulate embryonic skeletal formation? Mech Dev. 1999;87(1–2):57–66. doi: 10.1016/s0925-4773(99)00142-2. [DOI] [PubMed] [Google Scholar]
- 31.Gerstenfeld LC, Cullinane DM, Barnes GL, Graves DT, Einhorn TA. Fracture healing as a post-natal developmental process: molecular, spatial, and temporal aspects of its regulation. J Cell Biochem. 2003;88(5):873–84. doi: 10.1002/jcb.10435. [DOI] [PubMed] [Google Scholar]
- 32.Bais M, McLean J, Sebastiani P, Young M, Wigner N, Smith T, et al. Transcriptional analysis of fracture healing and the induction of embryonic stem cell-related genes. PLoS One. 2009;4(5):e5393. doi: 10.1371/journal.pone.0005393. [DOI] [PMC free article] [PubMed] [Google Scholar]
- 33.Kerr MK, Churchill GA. Experimental design for gene expression microarrays. Biostatistics. 2001;2(2):183–201. doi: 10.1093/biostatistics/2.2.183. [DOI] [PubMed] [Google Scholar]
- 34.Yang YH, Dudoit S, Luu P, Speed TP. SPIE BiOS. San Jose, CA: 2001. Normalization for cDNA microarray data; p. 2001. [Google Scholar]
- 35.Kerr MK, Martin M, Churchill GA. Analysis of variance for gene expression microarray data. J Comput Biol. 2000;7(6):819–37. doi: 10.1089/10665270050514954. [DOI] [PubMed] [Google Scholar]
- 36.Nakata K, Ono K, Miyazaki J, Olsen BR, Muragaki Y, Adachi E, et al. Osteoarthritis associated with mild chondrodysplasia in transgenic mice expressing alpha 1(IX) collagen chains with a central deletion. Proc Natl Acad Sci U S A. 1993;90(7):2870–4. doi: 10.1073/pnas.90.7.2870. [DOI] [PMC free article] [PubMed] [Google Scholar]
- 37.Schmidt TA, Gastelum NS, Nguyen QT, Schumacher BL, Sah RL. Boundary lubrication of articular cartilage: role of synovial fluid constituents. Arthritis Rheum. 2007;56(3):882–91. doi: 10.1002/art.22446. [DOI] [PubMed] [Google Scholar]
- 38.Wozney JM, Rosen V, Celeste AJ, Mitsock LM, Whitters MJ, Kriz RW, et al. Novel regulators of bone formation: molecular clones and activities. Science. 1988;242(4885):1528–34. doi: 10.1126/science.3201241. [DOI] [PubMed] [Google Scholar]
- 39.Scott IC, Blitz IL, Pappano WN, Imamura Y, Clark TG, Steiglitz BM, et al. Mammalian BMP-1/Tolloid-related metalloproteinases, including novel family member mammalian Tolloid-like 2, have differential enzymatic activities and distributions of expression relevant to patterning and skeletogenesis. Dev Biol. 1999;213(2):283–300. doi: 10.1006/dbio.1999.9383. [DOI] [PubMed] [Google Scholar]
- 40.Williamson AK, Chen AC, Masuda K, Thonar EJ, Sah RL. Tensile mechanical properties of bovine articular cartilage: variations with growth and relationships to collagen network components. J Orthop Res. 2003;21(5):872–80. doi: 10.1016/S0736-0266(03)00030-5. [DOI] [PubMed] [Google Scholar]
- 41.Wong M, Ponticiello M, Kovanen V, Jurvelin JS. Volumetric changes of articular cartilage during stress relaxation in unconfined compression. J Biomech. 2000;33(9):1049–54. doi: 10.1016/s0021-9290(00)00084-1. [DOI] [PubMed] [Google Scholar]
- 42.Bak B, Andreassen TT. The effect of aging on fracture healing in the rat. Calcified Tissue International. 1989;45(5):292–297. doi: 10.1007/BF02556022. [DOI] [PubMed] [Google Scholar]
- 43.Kou I, Ikegawa S. SOX9-dependent and -independent transcriptional regulation of human cartilage link protein. J Biol Chem. 2004;279(49):50942–8. doi: 10.1074/jbc.M406786200. [DOI] [PubMed] [Google Scholar]
- 44.Sekiya I, Tsuji K, Koopman P, Watanabe H, Yamada Y, Shinomiya K, et al. SOX9 enhances aggrecan gene promoter/enhancer activity and is up-regulated by retinoic acid in a cartilage-derived cell line, TC6. J Biol Chem. 2000;275(15):10738–44. doi: 10.1074/jbc.275.15.10738. [DOI] [PubMed] [Google Scholar]
- 45.Zhang P, Jimenez SA, Stokes DG. Regulation of human COL9A1 gene expression. Activation of the proximal promoter region by SOX9. J Biol Chem. 2003;278(1):117–23. doi: 10.1074/jbc.M208049200. [DOI] [PubMed] [Google Scholar]
- 46.Stokes DG, Liu G, Coimbra IB, Piera-Velazquez S, Crowl RM, Jimenez SA. Assessment of the gene expression profile of differentiated and dedifferentiated human fetal chondrocytes by microarray analysis. Arthritis Rheum. 2002;46(2):404–19. doi: 10.1002/art.10106. [DOI] [PubMed] [Google Scholar]
- 47.Matsusaki T, Aoyama T, Nishijo K, Okamoto T, Nakayama T, Nakamura T, et al. Expression of the cadherin-11 gene is a discriminative factor between articular and growth plate chondrocytes. Osteoarthritis Cartilage. 2006;14(4):353–66. doi: 10.1016/j.joca.2005.10.008. [DOI] [PubMed] [Google Scholar]
- 48.Grogan SP, Barbero A, Diaz-Romero J, Cleton-Jansen AM, Soeder S, Whiteside R, et al. Identification of markers to characterize and sort human articular chondrocytes with enhanced in vitro chondrogenic capacity. Arthritis Rheum. 2007;56(2):586–95. doi: 10.1002/art.22408. [DOI] [PubMed] [Google Scholar]
- 49.Ochi K, Daigo Y, Katagiri T, Saito-Hisaminato A, Tsunoda T, Toyama Y, et al. Expression profiles of two types of human knee-joint cartilage. J Hum Genet. 2003;48(4):177–82. doi: 10.1007/s10038-003-0004-8. [DOI] [PubMed] [Google Scholar]
- 50.Sampson HW, Dearman AC, Akintola AD, Zimmer WE, Parrish AR. Immunohistochemical localization of cadherin and catenin adhesion molecules in the murine growth plate. J Histochem Cytochem. 2007;55(8):845–52. doi: 10.1369/jhc.7A7184.2007. [DOI] [PubMed] [Google Scholar]
Associated Data
This section collects any data citations, data availability statements, or supplementary materials included in this article.