Abstract
The important role that non-coding RNA plays in cell biology makes it an attractive target for molecular recognition. However, the discovery of small molecules that bind double helical RNA selectively and may serve as biochemical probes and potential drug leads has been relatively slow. Herein, we show that peptide nucleic acids, as short as six nucleobases, bind very strongly (Ka > 107) and sequence selectively to a homopurine tract of double helical RNA at pH 5.5. The isothermal titration calorimetry and circular dichroism experiments suggest that the binding mode may be a sequence selective triple helix formation. Our results have implications for development of biochemical probes to study function of non-coding RNAs and design of compounds with potential antibacterial and antiviral activity.
Introduction
The central role that non-coding RNAs play in gene expression makes them attractive targets for molecular recognition. However, the discovery of small molecules that bind RNA selectively has been relatively slow.1 The standard paradigm of designing ligands for biological receptors uses shape selective recognition of a relatively rigid binding pocket. It works well for proteins, but has been less successful for RNA because of the conformational flexibility of the negatively charged phosphate backbone, which lowers the selectivity of the binding and complicates rational design of the “shape” of the ligand. The surface of an RNA helix is relatively uniform and presents little opportunity for the traditional shape selective molecular recognition. On the other hand, hydrogen bonding mediated base pairing is the key feature of helical nucleic acids and therefore, inherently the most effective way of sequence selective recognition of RNA. We envisioned that a major groove triple helix2 formation could provide the most straightforward sequence selective recognition of double helical RNA.
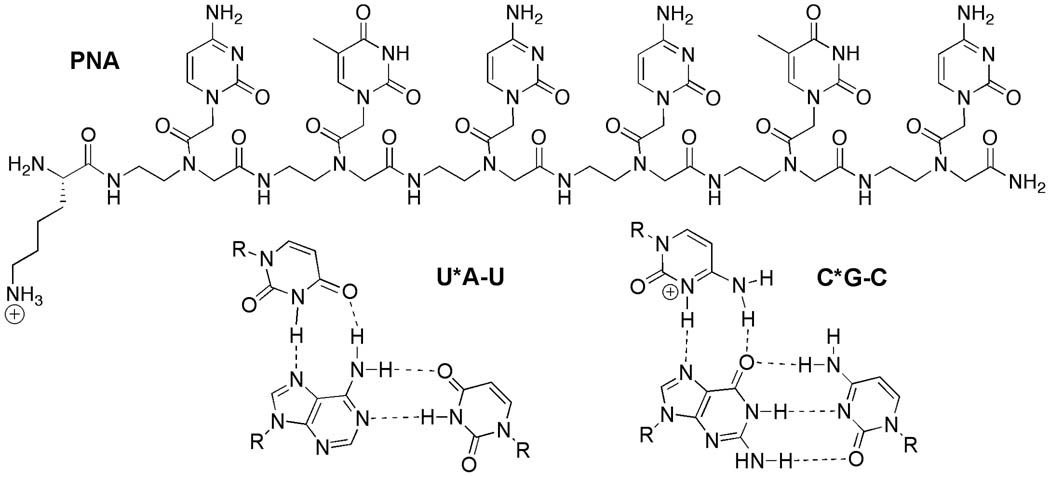
In contrast to DNA,2 RNA triple helices have not been extensively studied. Compared to DNA the major groove of an RNA double helix is deep and narrow, which may hinder the formation of the triple helix. Modestly stable, all RNA triple helices are formed via parallel binding of a pyrimidine rich third strand to a purine rich strand of the double helix.3,4 The sequence selectivity derives from recognition of adenosine-uridine base pairs by uridine (U*A-U triplet) and guanosine-cytidine base pairs by protonated cytidine (C*G-C triplet) via the Hoogsteen hydrogen bonding scheme (Figure 1). Interestingly, DNA as the third strand does not form stable triple helix with RNA,3,4 which suggest that short synthetic DNA oligonucleotides cannot be used to recognize double helical RNA.
Figure 1.
Structure of PNA (PNA3) and Hoogsteen base triplets.
Practical applications of triple helices are hindered by two problems: (1) slow kinetics of formation and (2) low thermal stability. Both are caused, at least in part, by electrostatic repulsion between the negatively charged double helix and the incoming third strand oligonucleotide. We hypothesized that these problems could be overcome by using a neutral third strand oligonucleotide analogue, such as peptide nucleic acid (PNA, Figure 1).5 Surprisingly and in contrast to the large number of studies in DNA,6 there are almost no data on triple helices formed by PNA and double helical RNA. Toulme and co-workers7 used electrophoretic mobility shift assay to show that a PNA 13mer had relatively low affinity for an RNA hairpin. However, the results were not conclusive because the complex studied had two consecutive T*C-G mismatches and the assay provided only qualitative binding estimates. Herein, we used isothermal titration calorimetry (ITC) to show that PNAs, as short as six nucleobases, bind strongly and sequence selectively to a homopurine tract of double helical RNA. Calorimetric and circular dichroism results were consistent with triple helix formation.
Results
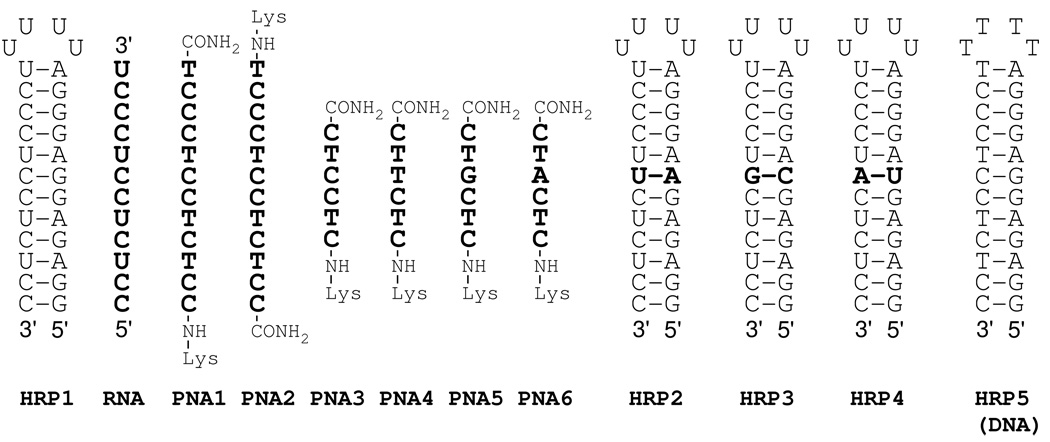
To test if PNA forms stable triple helices with RNA, we chose the hairpin previously studied by Roberts and Crothers (HRP1, Figure 2) using UV thermal melting.3 The experiment under the original conditions (100 mM of sodium acetate and 1.0 mM of EDTA, pH 5.5) showed the expected biphasic UV melting curve (Figure S1, Supporting information) for binding of the RNA third strand (RNA) to HRP1 with a triplex to duplex transition at tm≈ 52 °C and a hairpin to single strand transition at tm> 90 °C. Surprisingly, neither PNA1 nor PNA2, which had the same sequence as RNA and differed in polarity (COOH to NH2) of backbone, showed triplex to duplex transitions. However, the shape of the curves suggested that the missing transitions might be shifted to higher temperature and overlapped with the duplex to single strand transition. To test this notion and obtain detailed thermodynamic characterization of the binding we used the isothermal titration calorimetry (ITC).
Figure 2.
Sequences of RNA hairpins and PNA ligands.
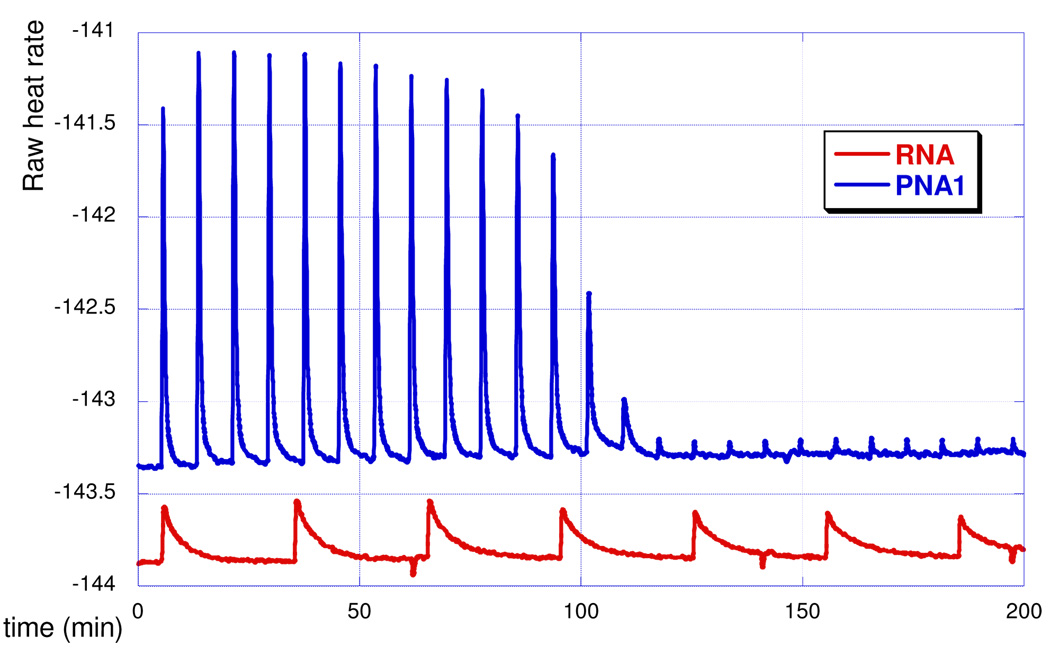
ITC directly measures enthalpy of binding and is one of the best methods to study RNA-ligand interactions.8 ITC has been used to characterize the thermodynamics of PNA binding to DNA9,10 and formation of modified DNA triple helices.11 In a typical ITC experiment, the RNA hairpin (~5 µM) was placed in a calorimeter cell (NanoITC, TA Instruments), the PNA ligand (~100 µM) was added in small portions (5 µL) and the heat output due to PNA-RNA interaction was recorded. The data were fitted using NanoAnalyze software (TA Instruments) to give association constant Ka, binding enthalpy ΔH and binding order (stoichiometry). The ITC results (Figure 3) clearly showed that the affinity of PNA1 for HRP1 (Table 1, entry 2) was at least an order of magnitude higher than the affinity of RNA (Table 1, entry 1). The binding order (indicating a 1:1 complex) and the lower affinity of PNA2 (Table 1, entry 3) were consistent with a triple helix formation. The sequence of PNA1 aligned parallel (COOH to NH2 aligned 3’ to 5’) to the homopurine tract of HRP1, as favored in the triple helix. The sequence of PNA2 aligned antiparallel (COOH to NH2 aligned 5’ to 3’) to the homopurine tract of HRP1, as favored in the double helix. Qualitative examination of the peak shapes (cf., red and blue traces) suggested that, compared to RNA, PNA bound significantly faster to the RNA hairpin, presumably because of the lack of electrostatic repulsion. The heat output peaks for PNA1 returned to the baseline after injection at least three times faster than the peaks for RNA. In agreement with the original report,3 ITC did not detect any binding of a DNA third strand to HRP1 (Figure S5). Reduction of the length of PNA revealed that even a hexamer (PNA3) had higher binding affinity to HRP1 than the original RNA 12mer (Table 1, cf. entry 1 and 4).
Figure 3.
ITC titration curves of RNA and PNA1 binding to HRP1.
Table 1.
Thermodynamic data for binding of PNA to RNA hairpin HRP1.a
| Entry | Sequence | Ka × 107 M−1 |
−ΔH kcal/mol |
−ΔS eu |
−ΔG kcal/mol |
Binding order |
|
|---|---|---|---|---|---|---|---|
| 1 | RNA | 5’-CCUCUCCUCCCU | 1.3 | 56.1 | 156 | 9.7 | 0.8 |
| 2 | PNA1 | NH2-CCTCTCCTCCCT | 35 ± 30 | 55.4 ± 5.3 | 147 ± 17 | 11.5 ± 0.6 | 1.2 ± 0.1 |
| 3 | PNA2 | NH2-TCCCTCCTCTCC | 4.5 | 42.5 | 108 | 10.4 | 1.3 |
| 4 | PNA3 | NH2-CTCCTC | 8.4 ± 8 | 29.4 ± 5.3 | 63 ± 17 | 10.6 ± 0.5 | 1.1 ± 0.2 |
| 5 | PNA1 b | NH2-CCTCTCCTCCCT | 8.7 ± 4 | 86.6 ± 3.9 | 254 ± 13 | 10.8 ± 0.1 | 0.74 ± 0.01 |
| 6 | PNA1 c | NH2-CCTCTCCTCCCT | 0.05 | 36.3 | 96 | 7.7 | 1.0 |
Association constants Ka (average ± standard deviation) in 100 mM sodium acetate, 1.0 mM EDTA, pH 5.5.
Reverse order of titration – RNA is added via syringe to PNA in calorimeter cell.
Same buffer at pH 7.
A potential concern for interpreting the ITC data was aggregation and non-specific binding of PNA that might cause strong heat output peaks. To check that the ITC data represented the binding of PNA to RNA and not changes in self-structure of PNA, we performed the reverse titration experiment where PNA1 was placed in the calorimeter cell and titrated with excess of HRP1. Fitting of the data (Figure S7) gave somewhat lower association constant (Table 1, entry 5) than that obtained while adding PNA to RNA (Table 1, c.f. entry 2 and 5). The enthalpy of binding was significantly higher and the binding order (0.74) indicated that more PNA (about 1.35 equivalents) was binding to RNA under the reverse titration conditions. Overall, the reverse titration experiment confirmed that the ITC data represented the binding of PNA to RNA. However, as discussed below, the binding equilibria might have involved some self-structures of PNA and contributions from invasion complexes that could be responsible for the observed discrepancies.
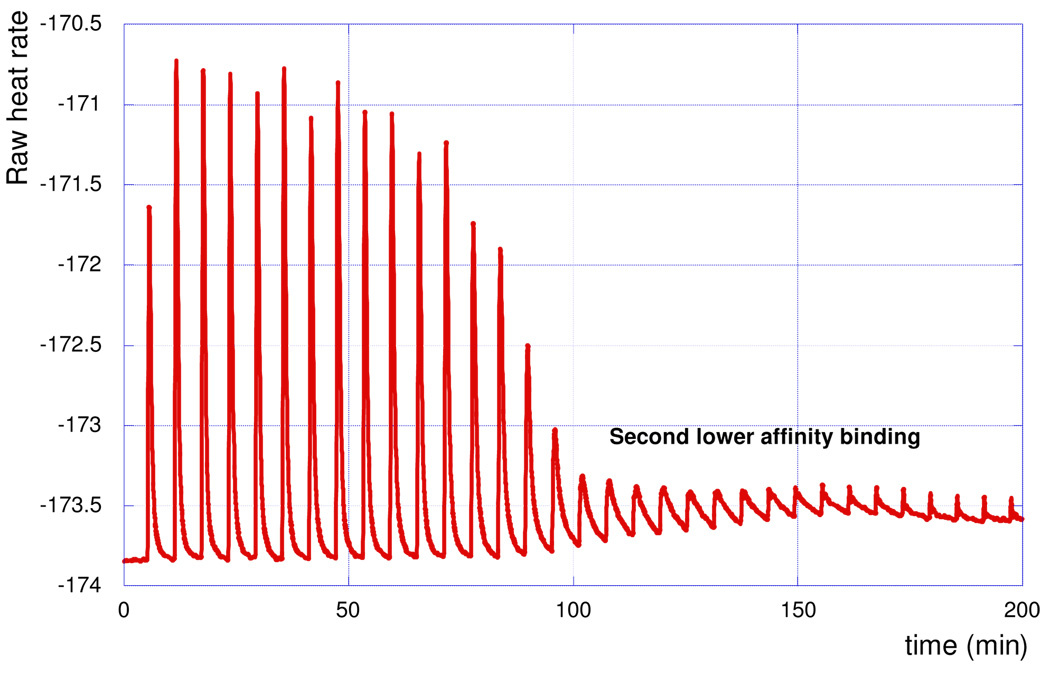
To compare our data to the well-studied recognition of DNA double helix by PNA, we tested binding of PNA1 to a DNA hairpin HRP5 (Figure 2). ITC experiment (Figure 4) showed strong binding. However, the titration curve was somewhat more complicated than in the case of the RNA hairpin (c.f., blue trace in Figure 3 and Figure 4). After the initial strong peaks, the heat output did not return to the base line but continued as a series of smaller peaks indicating a possible second lower affinity binding process (Figure 4), which could be due to the conversion of triple helix to invasion complex at higher PNA concentrations, as previously observed by Hansen et al.6 Fitting the initial peaks (Figure S8) gave Ka ~ 3 × 10⁷, which was consistent with literature data for triple helix binding of similar PNAs to a DNA duplex.6 Thus, under our experimental conditions PNA1 had somewhat higher affinity for an RNA hairpin (Ka = 3.5 × 10⁸) than for a DNA hairpin.
Figure 4.
ITC titration curves of PNA1 binding to DNA hairpin HRP5.
Next, we tested the binding of PNA1 to HRP1 at physiological pH (Table 1, entry 6). Since the formation of C*G-C triplet requires protonation of cytosine heterocycle (pKa ca 4.5, Figure 1) triple helices are expected to be less stable at pH 7 than at pH 5.5. Despite the fact that PNA1 contained eight cytosines (66% out 12 nucleobases) we observed reasonably strong (Ka = 5 × 10⁵) binding to RNA hairpin at pH 7 (Table 1, entry 6) at 25 °C. However, we observed no binding of PNA1 to HRP1 in either ITC or UV experiments under physiological conditions: 37 °C, in 2 mM MgCl2, 90 mM KCl, 10 mM NaCl, 50 mM potassium phosphate at pH 7.4. The decrease in affinity at higher pH was consistent with that observed for PNA-DNA triple helices.6 The strand invasion forming a 1:1 PNA-RNA Watson-Crick duplex would not be expected to depend on pH.
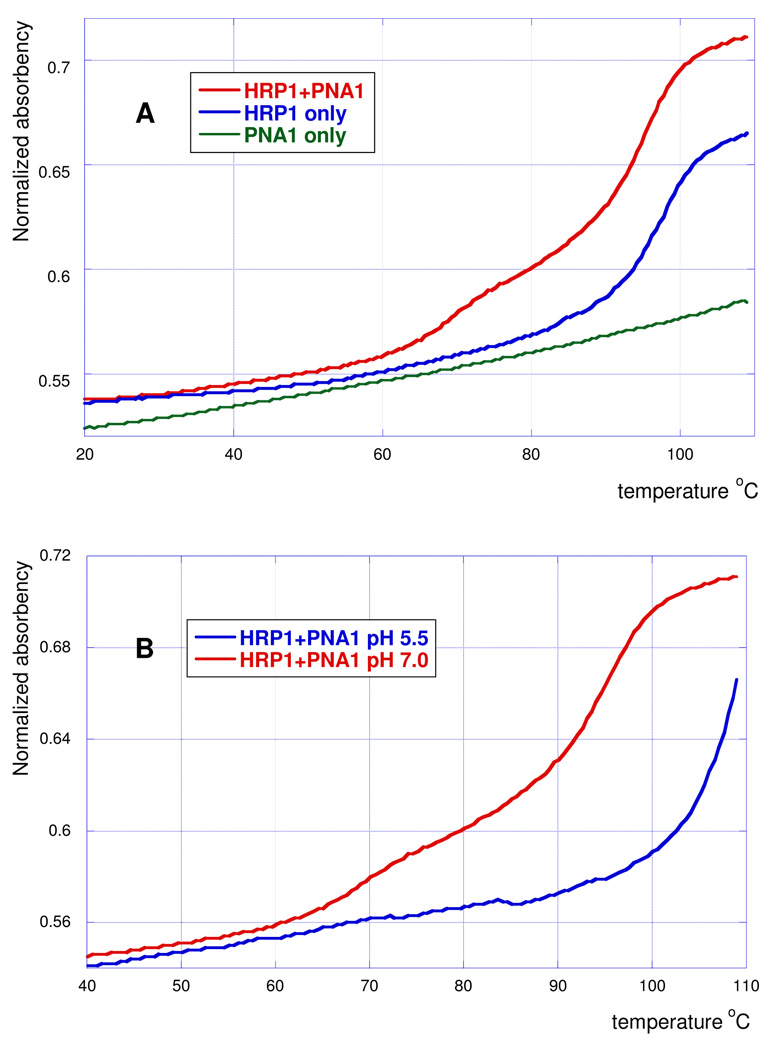
To compare the complex formation at pH 5.5 and 7.0 we performed UV melting experiments in sealed cells going up to 110 °C. The higher end temperature allowed for better observation of shifts in the hairpin to single strand transition. The melting curve of HRP1 and PNA1 at pH 7 had the expected biphasic shape (Figure 5A, red curve). The lower temperature transition might be assigned to dissociation of the third PNA strand from the triple helix, while the higher temperature transition was due to melting of the RNA hairpin. The melting curve of HRP1 only (Figure 5A, blue curve) showed only the high temperature transition as expected for hairpin to RNA single strand melting. The melting curve of PNA1 only (Figure 5A, green curve) showed no transition, which indicated that under these conditions PNA1 did not form extensive self-structure. Comparison of melting curves at pH 5.5 and 7.0 (Figure 5B, red and blue curves, respectively) clearly showed that at pH 5.5 the complex had only one transition that was shifted about 10 °C higher and was consistent with direct melting of the high affinity complex to single PNA and RNA strands. Overall, the results were consistent with the proposed triple helix formation.
Figure 5.
UV melting curves of PNA1 binding to HRP1 (2 µM, in 100 mM sodium acetate, 1.0 mM EDTA). (A) Comparison of HRP1 and PNA1 (1:1, red), HRP1 only (blue) and PNA1 only (green) at pH 7.0. (B) Comparison of HRP1 and PNA1 (1:1) at pH 5.5 (blue) and pH 7.0 (red).
Finally, we studied the sequence specificity of RNA recognition by checking PNAs with all four nucleosides at a variable position (PNA3-6, Figure 2) against RNA hairpins featuring all four base pairs (HRP1-4) to be recognized by the variable base (Table 2). The two combinations featuring the expected Hoogsteen base triplets PNA3-HRP1 (C*G-C) and PNA4-HRP2 (T*A-U) clearly led to the most stable complexes (Ka >107, bold red in Table 2). All other combinations, which formed mismatched triplets, decreased the binding affinity significantly. Mismatches with the G-C base pair were the most stable, reducing the binding affinity about ten times. Mismatches with the U-A base pair were the least stable, reducing the binding affinity by about three orders of magnitude. Consistent with sequence selective triple helix formation, combinations that would involve Watson Crick base pairs PNA5-HRP3 and PNA6-HRP4 (blue in Table 2) were among the least stable.
Table 2.
Sequence specificity of PNA binding to RNA hairpins.
| PNA (variable base) |
HRP1 a (G-C) | HRP2 a (A-U) | HRP3 a (C-G) | HRP4 a (U-A) |
|---|---|---|---|---|
| PNA3 (C) | 8.4 | 0.04 | 0.05 | 0.02 |
| PNA4 (T) | 0.27 | 4.7 | 0.05 | 0.002 |
| PNA5 (G) | 0.15 | 0.04 | 0.02 | 0.009 |
| PNA6 (A) | 0.6 | 0.16 | 0.07 | 0.005 |
Association constants Ka × 107 M−1 in sodium acetate buffer, pH 5.5.
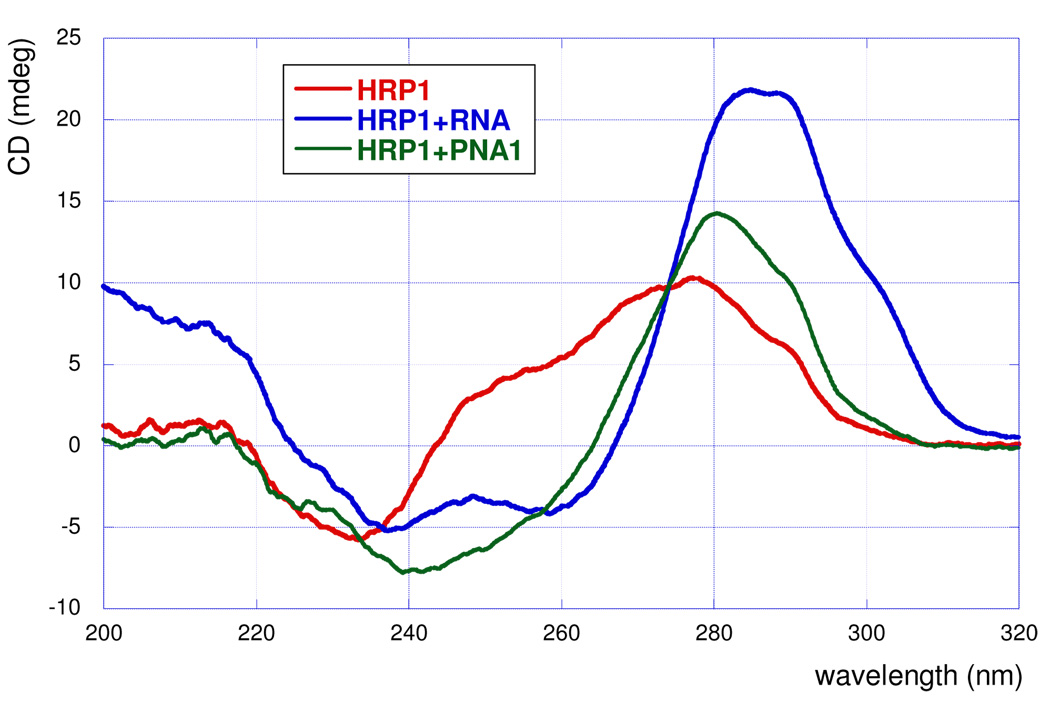
Further evidence for triple helix formation was obtained by circular dichroism (CD) spectroscopy (Figure 6). Wittung et al.12 used CD spectroscopy to confirm the triple helix formation between PNA and double helical DNA. In our experimental system, binding of RNA and PNA1 to HRP1 resulted in similar changes in the CD signal, decrease at 240–260 nm and increase at 280–290 nm, which were fully consistent with the CD spectra previously observed for the triple helical binding of cytosine rich PNA to double stranded DNA.12
Figure 6.
CD spectra of RNA and PNA1 binding to HRP1 (5 µM, 1:1 complexes in the ITC buffer).
Discussion
PNA binds to double helical DNA via two competing binding modes, triple helix (PNA:DNA, 1:1) and strand invasion (where PNA displaces one of the DNA strands) typically followed by a triple helix formation (PNA:DNA, 2:1).6 Thymine-rich homopyrimidine PNAs generally prefer invasion complexes, while cytosine-rich PNAs prefer triple helix formation.12 The binding mode depends not only on sequence of PNA but also on experimental conditions, such as salt concentration, DNA duplex stability and PNA concentration. Triple helices involving RNA duplexes are less studied than DNA triplexes.3,4 Except the single report by Toulme and co-workers,7 triple helix formation between PNA and RNA double helix is virtually unknown.
Our results showed that PNAs as short as six nucleobases bind very strongly and sequence selectively to a homopurine tract of double helical RNA at pH 5.5. Although we could not exclude presence of minor amounts of invasion complexes, overall the data were consistent with a triple helix formation. The invasion complex, where PNA would first invade the RNA helix and form a new duplex by displacing one of the original RNA strands, would lead to a 2:1 complex, a PNA*RNA-PNA triple helix. The binding order obtained in our experiments (Table 1) was close to one, which indicated formation of either a triple helix or a 1:1 invasion complex without involvement of the third PNA strand. The fact that PNA1 had higher affinity for HRP1 than PNA2 fit better with the triple helix formation. The backbone polarity of PNA1 was parallel (the amino-end of PNA aligns with the 5’-end of RNA hairpin) to the purine rich strand of HRP1, as favored in Hoogsteen triple helices. The backbone polarity of PNA2 was antiparallel, as favored in Watson-Crick double helices. Thus, if the binding mode were 1:1 invasion complex (RNA-PNA double helix), PNA2 would be expected to have higher binding affinity than PNA1, which was not the case. Consistent with triple helix formation involving protonated cytosine heterocycles in PNA, the binding affinity was significantly decreased at pH 7.
The binding of hexamer PNA3 to RNA duplex exhibited excellent sequence selectivity that was fully consistent with Hoogsteen base triplets but not with Watson-Crick base pairs. If the binding mode involved duplex formation via strand invasion, combinations PNA5-HRP3 and PNA6-HRP4 (blue in Table 2), which would lead to Watson-Crick base pairs (G-C and A-U, respectively), would have higher stability than others. Thus, the sequence selectivity lent strong support to the proposed triple helix formation. Finally, the CD spectra of RNA and PNA1 bound to HRP1 were fully consistent with previous results on PNA-DNA triple helices. Although minor amounts of invasion complexes might have been formed during our experiments (the binding order in Table 1 was slightly higher than one), all the data suggested that sequence selective triple helix formation was the main binding mode.
The excellent sequence selectivity also alleviated concerns that PNA aggregation and non-specific association to RNA’s surface might be the cause of strong heat output peaks in the ITC experiments. However, the reverse titration experiment gave somewhat different binding parameters (Table 1, entries 2 and 5) indicating possible involvement of more complex equilibria in the binding process. Overall, the binding constant, although somewhat smaller, was in the expected range (c.f, 35 × 107 to 8.7 × 10⁷). The significant difference in binding enthalpy might be due to some self-structure of the PNA strands and different competition by invasion complexes in direct and reverse titration experiments.
Vesnaver and Breslauer13 showed that even marginally stable self-structures of DNA single strands contribute significantly to enthalpies observed in ITC experiments. It is conceivable that the PNA single strands had similar effect in our experiments. If the self-structure of PNA depended on concentration, it would be different in direct (100 µM PNA in syringe) and reverse (5 µM PNA in cell) titration experiments and could have significant impact on the enthalpy of binding.13 Two results suggested that PNA1 did not aggregate or form extensive self-structure under our experimental conditions. First, examination of the late regions (after the RNA binding is saturated) of the ITC titration trace (Figure 3) revealed very small residual peaks due to dilution of PNA into buffer (5 µL of ~100µM diluted in ~1mL). Significant aggregation would be expected to give stronger heat output signal due to deaggregation upon ~200 times dilution into reaction cell. Second, PNA1 did not show any UV melting transition (Figure 5A, green curve). Significant self-structure would be expected to show some melting, as was observed for the DNA strands studied by Vesnaver and Breslauer.13
The results of direct and reverse titration experiments might have different contributions from competing strand invasion. In the reverse titration experiment, PNA was in the calorimeter cell at a high initial concentration (5 µM) and was consumed as the binding proceeded. Such a set up might have favored more invasion complex formation, which was also indicated by higher PNA to RNA ratio (binding order of 0.74) in the reverse titration experiment. In the direct titration experiment, RNA was in the cell at a high concentration (5 µM) and PNA’s initial concentration was kept low (diluted to 0.5 µM after injection) and slowly built up when the RNA binding saturated. Such a set up might have favored less invasion complex formation. It is conceivable that the discrepancies in association constant, binding enthalpy and stoichiometry were caused by contributions from both self-structure and invasion complexes.
Whatever the exact contributions of other species to the binding equilibrium might be, they did not affect the sequence selectivity of PNA3. Results in Table 2 clearly showed that PNAs as short as hexamers (PNA3 and PNA4) had high affinity (Ka > 107) and excellent sequence selectivity in binding to a homopurine tract of double helical RNA.
Conclusions
We have found that short pyrimidine PNAs bind strongly and sequence selectively to purine tract of double helical RNA at pH 5.5. Although it is likely that minor amounts of invasion complexes form concurrently, our data are consistent with triple helix formation as the major mode of binding. To our knowledge, this is the first study to suggest a strong and relatively fast recognition of double helical RNA by PNA.
Brief review of secondary structure databases of non-coding RNAs reveals that it is relatively common to find short homopurine tracts of eight and more contiguous purines, sometimes interrupted by one or two pyrimidines, in bacterial ribosomal RNAs (http://www.rna.ccbb.utexas.edu/) and micro RNAs (http://www.mirbase.org/). Our results of strong binding of short PNA suggest the possibility of designing relatively small PNA analogues to recognize such binding sites. It is conceivable that further development of chemical modifications6,14 may allow recognition of isolated pyrimidines in the context of homopurine triple helix at physiological pH, which may provide a novel way to recognize and interfere with function of non-coding RNAs.
Experimental Part
In a typical ITC experiment, RNA hairpin solution (0.95 mL, 5.25 µM) was titrated with PNA solution (50 × 5 µL, 96 µM) using a Nano ITC G2 (TA Instruments). For experimental details and data, see Supporting information. The titration data (Figures S2–S24) were analyzed using NanoAnalyze software (TA Instruments) using an independent model to obtain the fitting graph and thermodynamic binding data (Table S1).
Supplementary Material
ACKNOWLEDGMENT
We thank Binghamton University and NIH (R01 GM071461) for support of this research.
Footnotes
Supporting Information Available: Details of PNA synthesis and ITC experiments and data. This material is available free of charge via the Internet at http://pubs.acs.org.
REFERENCES
- 1.Thomas JR, Hergenrother PJ. Chem. Rev. 2008;108:1171–1224. doi: 10.1021/cr0681546. [DOI] [PubMed] [Google Scholar]; Sucheck SJ, Wong CH. Curr. Opin. Chem. Biol. 2000;4:678–686. doi: 10.1016/s1367-5931(00)00142-3. [DOI] [PubMed] [Google Scholar]
- 2.Fox KR, Brown TQ. Rev. Biophys. 2005;38:311–320. doi: 10.1017/S0033583506004197. [DOI] [PubMed] [Google Scholar]
- 3.Roberts RW, Crothers DM. Science. 1992;258:1463–1466. doi: 10.1126/science.1279808. [DOI] [PubMed] [Google Scholar]
- 4.Han H, Dervan PB. Proc. Natl. Acad. Sci. U. S. A. 1993;90:3806–3810. doi: 10.1073/pnas.90.9.3806. [DOI] [PMC free article] [PubMed] [Google Scholar]; Escude C, Francois JC, Sun JS, Ott G, Sprinzl M, Garestier T, Helene C. Nucleic Acids Res. 1993;21:5547–5553. doi: 10.1093/nar/21.24.5547. [DOI] [PMC free article] [PubMed] [Google Scholar]
- 5.Nielsen PE, Egholm M, Berg RH, Buchardt O. Science. 1991;254:1497–1500. doi: 10.1126/science.1962210. [DOI] [PubMed] [Google Scholar]
- 6.For a leading reference, see Hansen ME, Bentin T, Nielsen PE. Nucleic Acids Res. 2009;37:4498–4507. doi: 10.1093/nar/gkp437..
- 7.Aupeix K, Le Tinevez R, Toulme JJ. FEBS Lett. 1999;449:169–174. doi: 10.1016/s0014-5793(99)00427-5. [DOI] [PubMed] [Google Scholar]
- 8.Feig AL. Biopolymers. 2007;87:293–301. doi: 10.1002/bip.20816. [DOI] [PMC free article] [PubMed] [Google Scholar]; Buurma NJ, Haq I. Methods. 2007;42:162–172. doi: 10.1016/j.ymeth.2007.01.010. [DOI] [PubMed] [Google Scholar]; Schwarz FP, Reinisch T, Hinz H-J, Surolia A. Pure Appl. Chem. 2008;80:2025–2040. [Google Scholar]
- 9.For recent reviews, see Ratilainen T, Holmen A, Norden B. In: Peptide Nucleic Acids. 2nd Ed. Nielsen PE, editor. Wymondham, UK: Horizon Biosciences; 2004. pp. 77–105. Ratilainen T, Norden B. In: Methods in Molecular Biology, volume 208: Peptide Nucleic Acids: Methods and Protocols. Nielsen PE, editor. Totowa, NJ: Humana Press Inc; 2002. pp. 59–88..
- 10.Ratilainen T, Holmen A, Tuite E, Haaima G, Christensen L, Nielsen PE, Norden B. Biochemistry. 1998;37:12331–12342. doi: 10.1021/bi9808722. [DOI] [PubMed] [Google Scholar]; Schwarz FP, Robinson S, Butler JM. Nucleic Acids Res. 1999;27(24):4792–4800. doi: 10.1093/nar/27.24.4792. [DOI] [PMC free article] [PubMed] [Google Scholar]; Ratilainen T, Holmen A, Tuite E, Nielsen PE, Norden B. Biochemistry. 2000;39(26):7781–7791. doi: 10.1021/bi000039g. [DOI] [PubMed] [Google Scholar]
- 11.Chin T-M, Tseng M-H, Chung K-Y, Hung F-S, Lin S-B, Kan L-S. J. Biomol. Struct. Dyn. 2001;19:543–553. doi: 10.1080/07391102.2001.10506762. [DOI] [PubMed] [Google Scholar]
- 12.Wittung P, Nielsen P, Norden B. Biochemistry. 1997;36:7973–7979. doi: 10.1021/bi963136b. [DOI] [PubMed] [Google Scholar]
- 13.Vesnaver G, Breslauer KJ. Proc. Natl. Acad. Sci. USA. 1991;88:3569–3573. doi: 10.1073/pnas.88.9.3569. [DOI] [PMC free article] [PubMed] [Google Scholar]
- 14.For recent reviews, see Rusling DA, Broughton-Head VJ, Brown T, Fox KR. Curr. Chem. Biol. 2008;2:1–10. Buchini S, Leumann CJ. Curr. Opin. Chem. Biol. 2003;7:717–726. doi: 10.1016/j.cbpa.2003.10.007. For a lead reference, see c) Rusling DA, Powers VEC, Ranasinghe RT, Wang Y, Osborne SD, Brown T, Fox KR. Nucleic Acids Res. 2005;33:3025–3032. doi: 10.1093/nar/gki625..
Associated Data
This section collects any data citations, data availability statements, or supplementary materials included in this article.


