Abstract
The atomic structure of small molecules and polypeptides can be attained from anisotropic NMR parameters such as dipolar couplings (DC) and chemical shifts (CS). Separated local field experiments resolve DC and CS correlations into two dimensions. However, crowded NMR spectra represent a significant obstacle for the complete resolution of these anisotropic parameters. Using the PISEMA (Polarization Inversion Spin Exchange at the Magic Angle) experiment as a foundation, we designed new pulse schemes that use a constant time evolution in the dipolar (indirect) dimension to measure DC and CS correlations at high resolution. We demonstrated this approach on a 4-pentyl-4′-cyanobiphenyl (5CB) liquid crystal sample, achieving a resolution enhancement ranging from 30 to 60 % for the resonances in the dipolar dimension. These new experiments open the possibility of obtaining significant resolution enhancement for multidimensional NMR experiments carried out on oriented liquid crystalline samples as well as oriented membrane proteins.
Keywords: PISEMA, SE-PISEMA, Solid-state NMR, Sensitivity Enhancement, Resolution Enhancement, Separated Local Field Experiments, Constant Time Evolution
INTRODUCTION
The atomic structures of both magnetically aligned liquid crystals or polypeptides uniformly aligned in membrane mimetic systems can be obtained by measuring orientational-dependent anisotropic NMR parameters such as dipolar couplings (DC) and chemical shifts (CS) (1, 2, 3, 4, 5).
Separated local field (SLF) experiments have made great contributions in measuring and resolving these correlations in two dimensions, making a significant impact in the way the structure and dynamics of macromolecules are characterized (6). SLF experiments resolve the CS of spin S (15N or 13C) and the DC between spins I (1H) and S in two dimensions. If the CS tensor of spin S and the distance between spins I and S are known, then the observables are converted into orientational-dependent restraints for structure determination (1, 2, 3). The scaling of these parameters with respect to their theoretical values is a strong indication of molecular dynamics. Therefore, these techniques can in principle give structural and dynamics information simultaneously(7). Several outstanding examples of liquid crystalline molecules as well as membrane peptides have been studied using this approach (8, 9, 10, 11, 12, 13, 14, 15, 16, 17, 18).
In spite of their high degree of alignment, the spectra of these molecules are often complicated by dipolar broadening as well as spectral overlap. Several variants of the SLF experiment have been proposed to obtain DC/CS correlations at high resolution(19, 20, 20, 21, 22). All of these pulse sequences mainly differ in the decoupling schemes used in the indirect (dipolar) dimension. Among those experiments, polarization inversion spin exchange at the magic angle, or PISEMA, is the most popular and robust (7). The SEMA scheme utilized in the dipolar dimension of the PISEMA pulse sequence is relatively insensitive to pulse calibration, and for large dipolar couplings with limited 1H chemical shift dispersion, it gives a resolution superior to all the other variants (7). A recent modification of the PISEMA experiment allows one to recover the sine modulated dipolar coherence, increasing the sensitivity of this experiment up to 40%(23). The efficiency of sensitivity enhancement schemes has been demonstrated for the PISEMA experiment (or SE-PISEMA) as well as HETCOR pulse sequences (SE-HETCOR) for both single crystal and membrane proteins aligned in magnetically aligned lipid bicelles (23, 24, 25).
In this letter, we propose a method for enhancing the resolution of PISEMA experiment in the dipolar dimension using constant time (CT) evolution. CT evolution was originally introduced for liquid state NMR to obtain proton decoupled homonuclear spectra in the indirect dimension(26, 27). Nowadays, CT evolution is routinely used to achieve resolution enhancement in multidimensional heteronuclear correlation NMR experiments in liquid state (28) as well as magic angle spinning (MAS) experiments for solid samples(29, 30). For a 4-pentyl-4′-cyanobiphenyl (5CB) liquid crystal sample, we found that the CT evolution in the dipolar dimension increases the spectral resolution from 30 to 60%. We show that it is possible to combine the CT evolution with the SE element, increasing both resolution and sensitivity. Although the CT evolution is implemented into the PISEMA and SE-PISEMA pulse sequences, it can be incorporated into other 2D and 3D experiments for oriented membrane proteins, improving the resolution in the dipolar dimensions of crowded NMR spectra.
THEORY
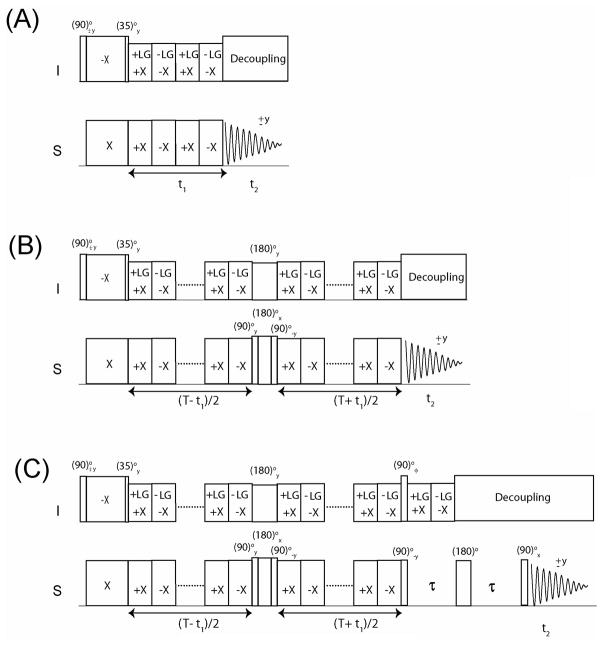
In the PISEMA experiment (Figure 1A), the cross polarization (CP) period followed by the 35° pulse on proton (I spin), prepares the polarization inversion state (I′z − S′ z). Spin exchange between the I and S spins (where S is either 13C or 15N) is then established during t1 evolution by either applying a frequency-switched Lee-Goldburg (FSLG)(31) or a phase modulated Lee-Goldburg (PMLG)(32) homonuclear decoupling sequence on the I spins synchronously with 180° phase-shifted 2π pulses on the S spins, satisfying the Hartmann-Hahn condition. As a result, the spin diffusion among I spins and the S spin chemical shift evolution are suppressed, giving rise to a scaled heteronuclear DC evolution(7, 33). For an I-S spin system, the evolution of spin operators is described as follows:
| (1) |
Figure 1.
Schematics for PISEMA (a), CT-PISEMA (b) and SECT-PISEMA pulse sequences. For SECT-PISEMA a phase φ = y, − y is used for interleaved scans (Rance-Kay detection mode). All pulse sequences use a two-step phase cycle between initial (90)° pulse and receiver phases.
During t2 acquisition under 1H heteronuclear dipolar decoupling, only gives rise to a detectable signal. The Hamiltonian and the spin operators of Equation (1) are described in a doubly tilted rotating (DTR) frame defined by:
| (2) |
Where DIS is the heteronuclear dipolar coupling (DIS = ωIS/2π) and sPISEMA is the scaling factor of the dipolar Hamiltonian (sPISEMA = sin θm = 0.82) (7). The spin operators in the doubly rotating frame and the doubly tilted rotating frame are given by Ii and Ii′ (i = x, y and z), respectively. In the presence of relaxation during t1, the final density matrix of Equation (1) with 2 scans per t1 increment can be written as(34, 35, 36, 37, 37),
| (3) |
Where T1ρ and R respectively represent the spin-lattice relaxation time and the proton spin diffusion rate in tilted rotating frame. The second term in Equation (3), , gives rise to a zero frequency peak in the dipolar dimension.
In liquid state NMR, CT experiments are designed by refocusing the chemical shift and/or J-coupling Hamiltonians through inverting the sign of the Hamiltonian with 180° pulse(s) either with phases x or y(26, 27). In the PISEMA experiment, the sign of the dipolar Hamiltonian (represented in the DTR frame, Equation 2) can be inverted by applying a (180)° y pulse on the I spin and a (180)° z pulse on the S spin, where the latter is obtained by a composite pulse (90)° y(180)° x(90)° −y. This can be formulated as:
| (4) |
Unlike the conventional PISEMA experiment, the dipolar evolution in the constant time PISEMA (CT-PISEMA, Figure 1B) occurs during a constant evolution time (T), with a dwell time (DW) set to 2 FSLG cycles. For the first increment, the π pulses are applied in the middle of time T so that the dipolar evolution is completely refocused. For the ith increment (i = 1, 2, 3…n), the 180° pulses are moved to the left by (i − 1) FSLG cycles. Hence, the dipolar evolution takes place for 2× (i − 1) FSLG cycles or DW × (i − 1). The constant time T is set to T = DW × (n − 1), where n is the total number of increments. The resulting density matrix is:
| (5) |
Where , and t1 = (i − 1) × duration of one FSLG cycle.
In the CT-PISEMA experiment, the dipolar and zero frequency components are less affected by relaxation (see Results and Discussion). In analogy with Equation (3), the relaxation effects on dipolar and zero frequency components are indicated with A′ and B′, respectively. The resulting density matrix of CT-PISEMA experiment with two scans for each increment is given by
| (6) |
The CT evolution, however, results in a reduction of signal intensity that can be exacerbated by relaxation effects for specific resonances. This problem is well known in liquid state NMR experiments of large macromolecular complexes. To overcome this problem, we implemented a sensitivity enhancement (SE) scheme (23, 24) after the CT period. The pulse scheme (SECT-PISEMA) is reported in Figure 1C and allows one to detect both cosine and sine modulated dipolar coherences in a single scan right after the CT period(23, 24). To achieve this, we alternated phase φ of the 90° pulse on the I spin before the τ period from y to −y in successive scans, inverting the sign of the sine modulated dipolar coherences. Two data sets are recorded in interleaved mode with φ = y and −y. The two data sets are then added and subtracted to uncouple the cosine and sine modulated dipolar coherences.
| (7) |
In the presence of relaxation during t1, the resulting density matrices of Equation (7) with φ = y, −y are represented by ρ1 and ρ2, respectively:
| (8) |
Addition and subtraction of ρ1 and ρ2 respectively give cosine and sine dipolar oscillations, ρc and ρs:
| (9) |
The final density matrix is obtained by adding ρc and ρs. Note that ρc and ρs are 90° phase shifted in both the t1 and t2 dimensions, therefore a relative 90° zero order phase shift is applied in both dimensions. i.e., the Rance-Kay data processing(38).
| (10) |
The sensitivity enhancement of SECT-PISEMA (Equation 10) over CT-PISEMA (Equation 6) is given by , where the factor compensates the increase in RMS noise due to data processing. Interestingly the sine component of SECT-PISEMA, ρs (Equation 9), does not contain the zero frequency component ( ). This effect was obtained by introducing a pulse on the I spin prior to the τ period, which does not affect the S spin coherence and cancels the zero frequency peak upon subtraction of ρ2 from ρ1 (Equation 8). (23) Note that the sensitivity of sine-CT-PISEMA is lower than the SECT-PISEMA (which is the sum of sine and cosine components) by a factor of .
EXPERIMENTAL
All of the experiments were carried out on an oriented liquid crystal sample of 4-pentyl-4′-cyanobiphenyl (5CB) on a 700 MHz VNMRS spectrometer at temperature 25°C. The spectra were acquired with an acquisition time of 10 ms, recycle delay of 6 seconds and CP contact time of 5 ms. The RF power on I and S spin channels were set to 62.5 kHz, which corresponds to a 4 μs 90° pulse, whereas the RF power on I channel during the constant time period (T) was set to 51 kHz for a 62.5 kHz effective field. The composite (90)° z pulse on the S-channel is obtained by a (90)° y-(180°) x-(90°) −y pulse train of 12 μs with an RF power of 83 kHz, whereas the (180)° y pulse of 12 μs on I-channel is obtained with 42 kHz RF power. Dwell time was set to 64 μs and duration of each FSLG block was 32 μs. FSLG in our case is obtained by phase modulation, by ramping the phase of 1H RF field. SPINAL-64 decoupling was applied during acquisition with 50 kHz 1H RF field. Conventional PISEMA was acquired with 64 t1 increments, whereas the CT-PISEMA and SECT-PISEMA were acquired with 21 t1 increments. A total of 16 scans were used for each increment. For SECT-PISEMA, two data sets were acquired for each increment (in interleaved fashion) with φ = y and −y with 8 scans used for each data set. All the experiments were processed with forward linear prediction (LP) of t1 signal up to 128 points and 90° phase-shifted sine bell window function in the F1 and F2 dimensions.
For PISEMA and CT-PISEMA, the t1 dimension was processed in real mode, whereas for SECT-PISEMA t1 dimesion was processed in Rance-Kay mode(38).
RESULTS AND DISCUSSION
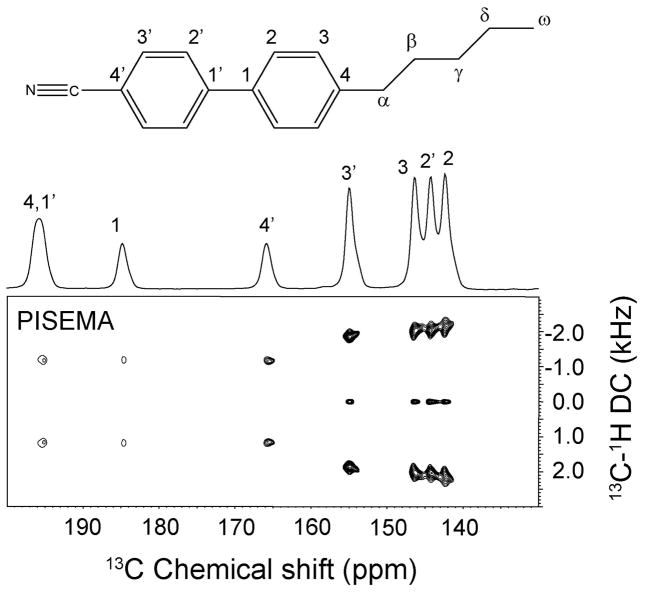
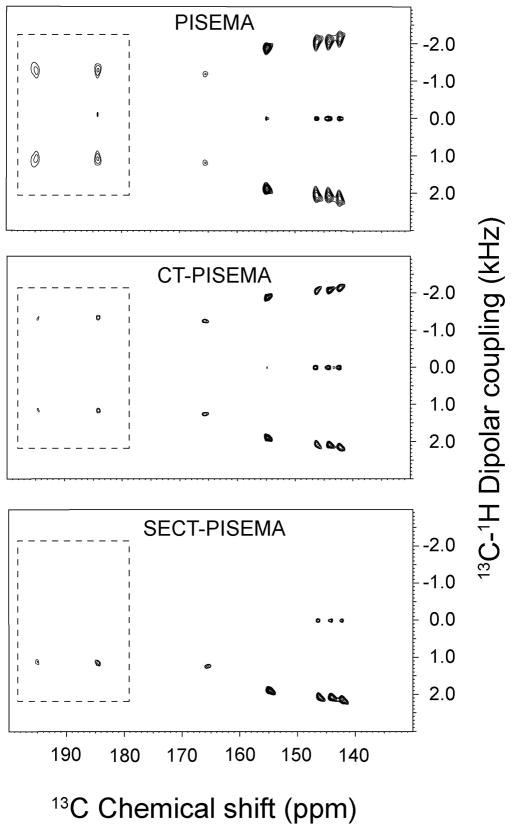
The conventional PISEMA experiments acquired with 64 t1 increments is reported in Figure 2. The PISEMA spectra with and without constant time evolution of the 5CB liquid crystal are compared in Figure 3. From the visual inspection of the 2D contours of the 5CB resonances, it is apparent that the 5CB resonances of the PISEMA spectrum have broader dipolar lines than those obtained from both the CT-PISEMA and SECT-PISEMA experiments. A more quantitative comparison obtained by measuring the line widths from the 1D dipolar cross sections shown in Figure 4. Table 1 shows that the CT evolution reduces the line widths dramatically, with a resolution enhancement that ranges from 30 to 60 % across the 5CB spectrum. In the SECT-PISEMA experiment, the dipolar lines are narrowed by 100 to 250 Hz with respect to conventional PISEMA experiment.
Figure 2.
Chemical structure and nomenclature for the 5CB molecule. The assignment was taken from Sandstrom and co-workers(40, 41). The one-dimensional 13C spectrum was obtained using a cross polarization experiment with 5 ms contact time. The PISEMA was acquired with 64 t1 increments. The spectrum was processed with linear prediction of t1 signal up to 128 points. 90° shifted sine bell window function is applied in both dimensions. The scale of the dipolar dimension was corrected according to a theoretical factor of 0.82.
Figure 3.
Comparison of the 2D spectra of PISEMA, CT-PISEMA, and SECT-PISEMA experiments acquired with 21 t1 increments. For SECT-PISEMA the τ period was set to 125 μs. The 13C carrier frequency was set to 162 ppm. All the spectra were processed with linear prediction of t1 signal up to 128 points. 90° shifted sine bell window function is applied in both dimensions. The scale of the dipolar dimensions was corrected according to a theoretical factor of 0.82. All of the spectra were plotted with the same scale. The intensities of the peaks in the dotted boxes are multiplied by a factor of 2. The comparison of both resolution and sensitivity for these experiments are reported in Tables 1 and 2, respectively.
Figure 4.
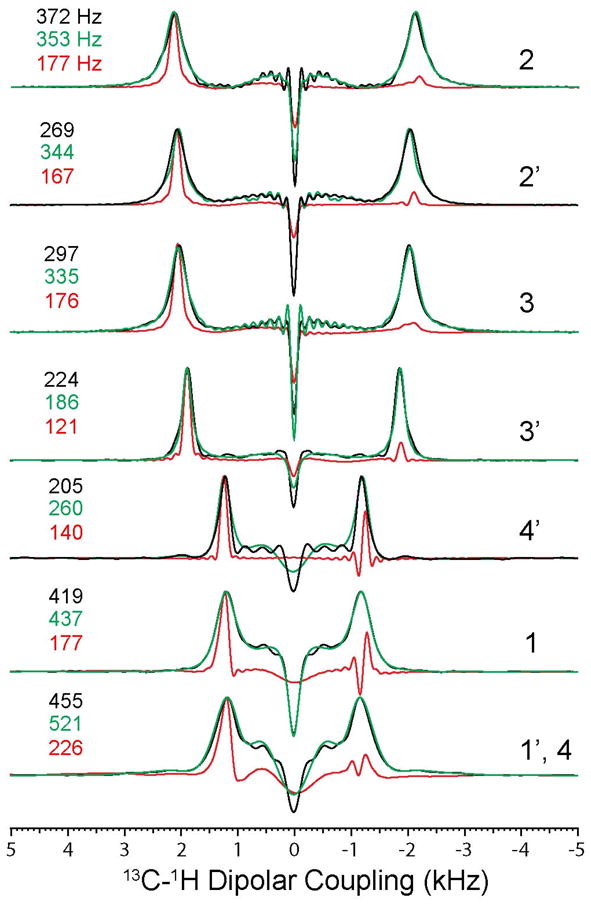
Comparison of dipolar line widths of PISEMA (black) and SECT-PISEMA (red) experiments from Figs. 3a and 3c, respectively. The dipolar cross sections shown in green color are from the PISEMA spectrum of Figure 3b.
Table 1.
Dipolar line widths (FWHM) for PISEMA and SECT-PISEMA experiments from the spectra reported in Figures 3 and 4.
| 13C Resonance | PISEMA with 64 t1 increments | PISEMA with 21 t1 increments | SECT-PISEMA with 21 t1 increments | Percentage of Resolution Enhancement* |
|---|---|---|---|---|
| 2 | 372 Hz | 353 Hz | 177 Hz | 52 |
| 2′ | 269 Hz | 344 Hz | 167 Hz | 38 |
| 3 | 297 Hz | 335 Hz | 176 Hz | 40 |
| 3′ | 224 Hz | 186 Hz | 121 Hz | 46 |
| 4′ | 205 Hz | 260 Hz | 140 Hz | 31 |
| 1 | 419 Hz | 437 Hz | 177 Hz | 58 |
| 1′, 4 | 455 Hz | 521 Hz | 226 Hz | 50 |
Resolution enhancement (percentage) of the SECT-PISEMA with respect to PISEMA experiment with 64 t1 increments.
To illustrate the gain in resolution and the different dipolar relaxation for these SLF experiments, we compared the signal decay in the indirect (dipolar) dimension for the PISEMA, CT-PISEMA, and SECT-PISEMA experiments. Figure 5 shows the dipolar oscillations (t1 dimensions) of the carbon 2 resonance with and without linear prediction for the different experiments. For the PISEMA experiment and the CT-PISEMA variant, only cosine dipolar oscillations are detected during the acquisition time. In contrast, for SECT-PISEMA experiment the SE schemes allowed us to detect both cosine- and sine-modulated dipolar coherences. As expected from theory, the cosine components for both SECT-PISEMA and CT-PISEMA are identical. It is apparent, however, that the constant time dipolar oscillation of CT- and SECT-PISEMA is less affected by the relaxation than the conventional PISEMA experiment. Note that for the PISEMA experiment we acquired a total of 64 increments for the indirect dimension, while for both the CT- and SECT-PISEMA experiments, due to the fast relaxation of 1, 3, and 4′ carbon nuclei, the total evolution time T was set to 1280 μs. The latter corresponds to 21 increments in the t1 dimension and a dwell time of 64 μs.
Figure 5.
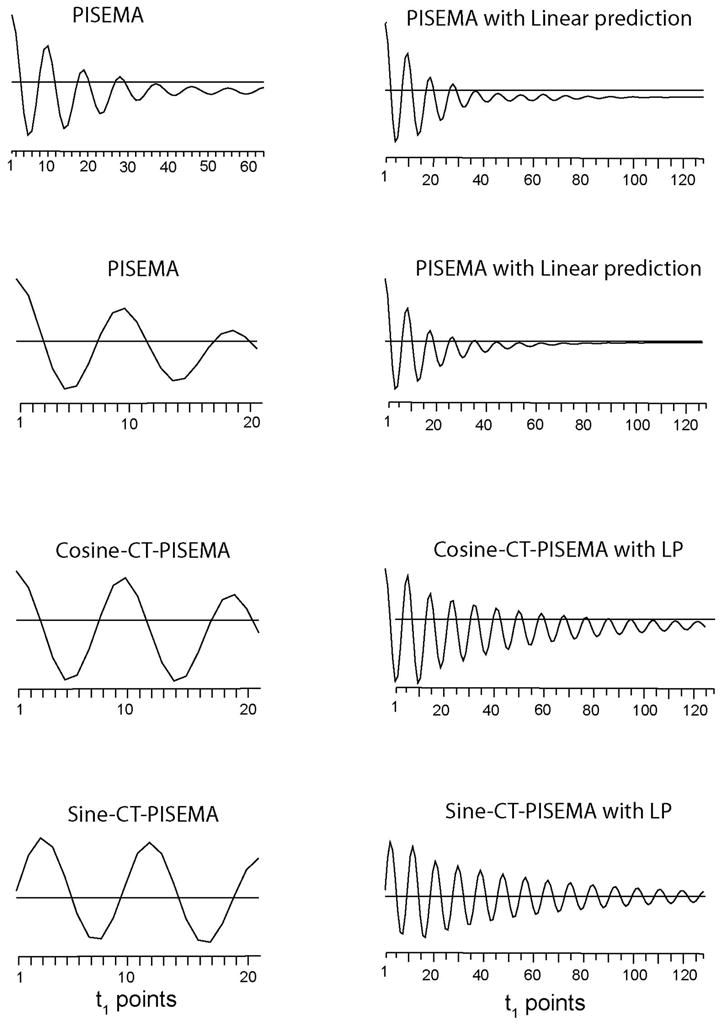
Dipolar oscillations (t1 signal) for 13C resonance ‘2’ from the PISEMA and SECT- PISEMA experiments reported in Figures 2 and 3. Left panel shows the experimental FID from the t1 dimension, right panel shows the corresponding FID from the t1 dimension obtained by forward linear prediction of 128 points.
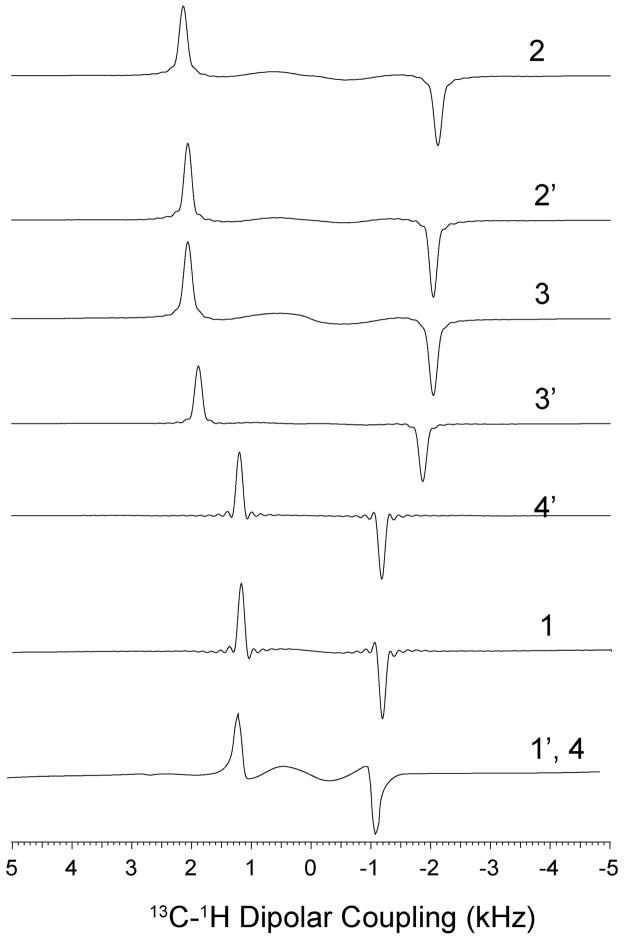
Although still present, the zero-frequency peak (probably caused by pulse imperfections) in the sine dipolar spectra is drastically reduced (Figure 6). This can also be seen from Figure 5, where the sine modulated dipolar oscillation in t1 dimension (sine-CT-PISEMA) is symmetric with respect to the zero line, while the cosine modulated dipolar component (cosine-CT-PISEMA and PISEMA) falls slightly below the zero line. The latter is due to the contribution from the negative component of zero frequency (Figure 4). The reduction of the zero-frequency component makes the sine modulated dipolar coherence spectrum very useful for measuring small dipolar couplings that are often obliterated by the truncation artifacts of the intense zero-frequency peak (see Figure 3). The last trace of Figure 5 is slightly distorted due to the pulse imperfection resulting from the large 13C offset (35 ppm for resonance 1′). The negligible zero-frequency components in the sine-CT-PISEMA spectra of Figure 5 are dispersive. This is due to imaginary Fourier transformation of the sine component of the dipolar coherences. Nevertheless, the traces of the sine-CT-PISEMA spectrum show much smaller truncation artifacts than the corresponding traces reported in Figure 3 for both PISEMA and SECT-PISEMA.
Figure 6.
Dipolar cross-sections of sine-CT-PISEMA spectrum. The 1D traces show negligible zero-frequency peak for the sine component of the dipolar coherences.
The sensitivity enhancement for carbon resonances of a 5CB liquid crystal obtained using the SECT-PISEMA over both the PISEMA and CT-PISEMA pulse sequences is reported in Table 2. From these values, it is clear that the loss of sensitivity for CT-PISEMA is negligible for for the resonances corresponding to carbons 2′, 3′, and 4′. The spectral processing using linear prediction improves the sensitivity slightly. Except for carbons 1 and 1′, the sensitivity of SECT-PISEMA is ~10 to 30% higher than the PISEMA experiment, while the gain of sensitivity for the SECT-PISEMA over the CT-PISEMA experiment ranges from 15 to 35 %.
Table 2.
Sensitivity enhancement factors of CT-PISEMA and SECT-PISEMA experiments from the spectra reported in Figure 3b and 3c. The sensitivity enhancement factors are normalized with respect to the PISEMA experiment reported in 3a.
| 13C resonance | CT-PISEMA | SECT-PISEMA |
|---|---|---|
| 2 | 1.00 | 1.29 |
| 2′ | 1.04 | 1.33 |
| 3 | 0.92 | 1.14 |
| 3′ | 1.04 | 1.23 |
| 4′ | 1.18 | 1.23 |
| 1 | 0.84 | 1.00 |
| 1′, 4 | 0.8 | 0.95 |
In solution NMR experiments, typical semi-CT or CT experiments, the total evolution time is kept constant and the 180° pulses are moved from the middle to the beginning or end of the evolution period in time increments equal to the dwell time(39). Since the total evolution time is constant, the NMR lines are subjected only to inhomogeneous broadening (39). The homogenous relaxation for time T is same for all t1 increments and acts as a multiplicative factor, reducing all of the line intensities. As a consequence, the CT period in a pulse sequences enhances the spectral resolution in the indirect dimension at the expense of sensitivity (39).
In this paper, we show that CT evolution is possible in solids by refocusing of dipolar Hamiltonian in the doubly-tilted rotating frame. Although one should be aware of the relaxation properties of the system under analysis, the CT period can be optimized to dramatically improve spectra resolution. The CT scheme introduced here should allow the design of new multidimensional NMR experiments analogous to liquid state NMR to improve the resolution in the indirect dimensions.
CONCLUSIONS
In conclusion, we show that the resolution of the resonances in the PISEMA experiment can be drastically improved by introducing a constant time evolution in the dipolar dimension. This implementation was possible by refocusing of dipolar Hamiltonian in the doubly tilted rotating frame. This concept can be utilized as a new paradigm to design new pulse sequences with improved resolution and sensitivity.
Although demonstrated for the PISEMA experiment, the extension of this method to other rotating frame SLF experiments is straightforward. While the resolution enhancement has been demonstrated with a liquid crystalline molecule, we can anticipate that a significant contribution of this implementation will be achieved for the congested dipolar spectra of membrane proteins aligned in magnetically aligned lipid bicelles.
Footnotes
Publisher's Disclaimer: This is a PDF file of an unedited manuscript that has been accepted for publication. As a service to our customers we are providing this early version of the manuscript. The manuscript will undergo copyediting, typesetting, and review of the resulting proof before it is published in its final citable form. Please note that during the production process errors may be discovered which could affect the content, and all legal disclaimers that apply to the journal pertain.
References
- 1.Quine JR, Cross TA, Chapman MS, Bertram R. Bull Math Biol. 2004;66:1705. doi: 10.1016/j.bulm.2004.03.006. [DOI] [PubMed] [Google Scholar]
- 2.Ketchem R, Roux B, Cross T. Structure. 1997;5:1655. doi: 10.1016/s0969-2126(97)00312-2. [DOI] [PubMed] [Google Scholar]
- 3.Shi L, Traaseth NJ, Verardi R, Cembran A, Gao J, Veglia G. J Biomol NMR. 2009;44:195. doi: 10.1007/s10858-009-9328-9. [DOI] [PMC free article] [PubMed] [Google Scholar]
- 4.Bertram R, Quine JR, Chapman MS, Cross TA. J Magn Reson. 2000;147:9. doi: 10.1006/jmre.2000.2193. [DOI] [PubMed] [Google Scholar]
- 5.Mo Y, Cross TA, Nerdal W. Biophys J. 2004;86:2837. doi: 10.1016/S0006-3495(04)74336-2. [DOI] [PMC free article] [PubMed] [Google Scholar]
- 6.Waugh JS. Proc Natl Acad Sci USA. 1976;73:1394. doi: 10.1073/pnas.73.5.1394. [DOI] [PMC free article] [PubMed] [Google Scholar]
- 7.Ramamoorthy A, Wei Y, Dong-Kuk L. Ann Rev NMR Spec. 2004;52:1. [Google Scholar]
- 8.Naito A. Solid State Nucl Magn Reson. 2009;36:67. doi: 10.1016/j.ssnmr.2009.06.008. [DOI] [PubMed] [Google Scholar]
- 9.Traaseth NJ, Shi L, Verardi R, Mullen DG, Barany G, Veglia G. Proc Natl Acad Sci U S A. 2009;106:10165–70. doi: 10.1073/pnas.0904290106. [DOI] [PMC free article] [PubMed] [Google Scholar]
- 10.Traaseth NJ, Verardi R, Torgersen KD, Karim CB, Thomas DD, Veglia G. Proc Natl Acad Sci USA. 2007;104:14676. doi: 10.1073/pnas.0701016104. [DOI] [PMC free article] [PubMed] [Google Scholar]
- 11.Ramamoorthy A, Lee DK, Narasimhaswamy T, Nanga RP. Biochim Biophys Acta. 2010;1798:223. doi: 10.1016/j.bbamem.2009.08.012. [DOI] [PMC free article] [PubMed] [Google Scholar]
- 12.Dvinskikh SV, Durr UH, Yamamoto K, Ramamoorthy A. J Am Chem Soc. 2007;129:794. doi: 10.1021/ja065536k. [DOI] [PMC free article] [PubMed] [Google Scholar]
- 13.Cui T, Canlas CG, Xu Y, Tang P. Biochim Biophys Acta. 2010;1798:161. doi: 10.1016/j.bbamem.2009.08.009. [DOI] [PMC free article] [PubMed] [Google Scholar]
- 14.Salnikov E, Aisenbrey C, Vidovic V, Bechinger B. Biochim Biophys Acta. 2010;1798:258. doi: 10.1016/j.bbamem.2009.06.021. [DOI] [PubMed] [Google Scholar]
- 15.Mascioni A, Karim C, Zamoon J, Thomas DD, Veglia G. J Am Chem Soc. 2002;124:9392. doi: 10.1021/ja026507m. [DOI] [PubMed] [Google Scholar]
- 16.Mascioni A, Karim C, Barany G, Thomas DD, Veglia G. Biochemistry. 2002;41:475. doi: 10.1021/bi011243m. [DOI] [PubMed] [Google Scholar]
- 17.Kovacs FA, Cross TA. Biophys J. 1997;73:2511. doi: 10.1016/S0006-3495(97)78279-1. [DOI] [PMC free article] [PubMed] [Google Scholar]
- 18.Hu J, Asbury T, Achuthan S, Li C, Bertram R, Quine JR, Fu R, Cross TA. Biophys J. 2007;92:4335. doi: 10.1529/biophysj.106.090183. [DOI] [PMC free article] [PubMed] [Google Scholar]
- 19.Yamamoto K, Lee DK, Ramamoorthy A. Chem Phys Lett. 2005;407:289. doi: 10.1016/j.cplett.2005.04.017. [DOI] [PMC free article] [PubMed] [Google Scholar]
- 20.Nevzorov AA, Opella SJ. J Magn Reson. 2007;185:59. doi: 10.1016/j.jmr.2006.09.006. [DOI] [PubMed] [Google Scholar]
- 21.Wu CH, Ramamoorthy A, Opella SJ. J Mag Res. 1994;109:270. [Google Scholar]
- 22.Dvinskikh SV, Yamamoto K, Ramamoorthy A. J Chem Phys. 2006;125:34507. doi: 10.1063/1.2212939. [DOI] [PubMed] [Google Scholar]
- 23.Gopinath T, Veglia G. J Am Chem Soc. 2009;131:5754. doi: 10.1021/ja900096d. [DOI] [PMC free article] [PubMed] [Google Scholar]
- 24.Gopinath T, Verardi R, Traaseth NJ, Veglia G. J Phys Chem B. 2010 doi: 10.1021/jp909778a. [DOI] [PMC free article] [PubMed] [Google Scholar]
- 25.Gopinath T, Traaseth NJ, Mote K, Veglia G. J Am Chem Soc. 2010 doi: 10.1021/ja905991s. [DOI] [PMC free article] [PubMed] [Google Scholar]
- 26.Bax A, Freeman R. J Mag Res. 1981;44:542–561. [Google Scholar]
- 27.Rance M, Wagner G, Sorensen OW, Wuthrich K, Ernst RR. J Mag Res. 1984;59:250–261. [Google Scholar]
- 28.Vuister GW, Bax A, Bax A. J Mag Res. 1992;98:428–435. [Google Scholar]
- 29.De Vita E, Frydman L. J Magn Reson. 2001;148:327. doi: 10.1006/jmre.2000.2255. [DOI] [PubMed] [Google Scholar]
- 30.Chen L, Olsen RA, Elliott DW, Boettcher JM, Zhou DH, Rienstra CM, Mueller LJ. J Am Chem Soc. 2006;128:9992. doi: 10.1021/ja062347t. [DOI] [PubMed] [Google Scholar]
- 31.Bielecki A, Kolbert AC, de Groot HjM, Griffin RG, Levitt MH. Adv Magn Reson. 1990;14:111. [Google Scholar]
- 32.Vinogradov E, Madhu PK, Vega S. Chem Phys Lett. 1999;314:443–50. [Google Scholar]
- 33.Gan Z. J Magn Reson. 2000;143:136. doi: 10.1006/jmre.1999.1971. [DOI] [PubMed] [Google Scholar]
- 34.Muller L, Kumar Anil, Baumann Thomas, Ernst Richard R. Phys Rev Lett. 1974;32:1402. [Google Scholar]
- 35.Tian F, Fu R, Cross TA. J Magn Reson. 1999;139:377. doi: 10.1006/jmre.1999.1794. [DOI] [PubMed] [Google Scholar]
- 36.Fu R, Tian C, Cross TA. J Magn Reson. 2002;154:130. doi: 10.1006/jmre.2001.2468. [DOI] [PubMed] [Google Scholar]
- 37.Sinha N, Ramanathan KV. Chemical Physics Letters. 2000;332:125. [Google Scholar]
- 38.Rance M, Soerensen OW, Bodenhausen G, Wagner G, Ernst RR, Wutrich K. Biochem Biophys Res Commun. 1983;117:479. doi: 10.1016/0006-291x(83)91225-1. [DOI] [PubMed] [Google Scholar]
- 39.Cavanagh J, Fairbrother JW, Palmer AG, III, Skelton NJ. 1996 [Google Scholar]
- 40.Dvinskikh SV, Zimmermann H, Maliniak A, Sandstrom D. J Magn Reson. 2003;163:46. doi: 10.1016/s1090-7807(03)00058-2. [DOI] [PubMed] [Google Scholar]
- 41.Dvinskikh SV, Yamamoto K, Scanu D, Deschenaux R, Ramamoorthy A. J Phys Chem B. 2008;112:12347. doi: 10.1021/jp803265z. [DOI] [PubMed] [Google Scholar]


