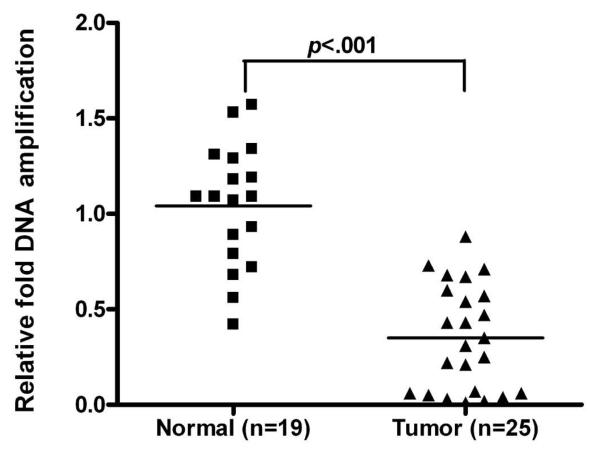
Figure 4. Comparison of DNA copy number amplification (variation is better or not?) in Normal vs Tumor samples.
Quantification of CHFR DNA copy number in 19 normal samples and 25 EACs was determined using Real-time PCR and normalized to the average value of all the normal samples, as described in materials and methods. Black boxes and triangles represent normal and tumor samples respectively. The horizontal bars represent the mean of DNA copy number.

